1. INTRODUCTION
Dementia is a progressive neurodegenerative disorder characterized by a decline in cognitive, behavioral, and social functions from brain damage or injury. This disease represents one of the leading causes of disability and dependency among the elderly population globally (Haiga et al., 2024). According to World Health Organization (WHO), approximately 55.2 million individuals were affected globally in 2022, with projection of reaching 131 million by 2050 due to population aging (WHO, 2022). The prevalence of dementia is known to double every 5 years after the age of 65, leading to a significant reduction in the ability to live independently and perform daily activities (Monson, 2023; Zamboni et al., 2024). Alzheimer’s disease (AD) is the most common cause of dementia, followed by vascular dementia, Parkinson’s disease dementia, Lewy body dementia, frontotemporal dementia, and mixed forms of dementia (Guindin-Orama et al., 2025; Yang, 2025).
One of the principal pathogenic mechanisms underlying AD is dysfunction of the cholinergic system, which is closely associated with the activity of the enzyme acetylcholinesterase (AChE). Specifically, AChE catalyzes the hydrolysis of neurotransmitter acetylcholine (ACh) into acetate and choline, thereby terminating synaptic signal transmission (Reynoso-García et al., 2025). Under pathological AD conditions, increased AChE activity accelerates ACh degradation, causing a significant reduction in synaptic ACh levels (Vecchio et al., 2021). This neurotransmitter deficiency disrupts crucial neuronal signal transmission in key cognitive processes such as memory, attention, and learning, contributing to hallmark AD symptoms including memory impairment and executive dysfunction (Reubun, 2022).
Based on this mechanism, AChE inhibitor-based therapies have been developed to prevent ACh degradation, thereby prolonging its availability in the synaptic cleft and improving cognitive function (Chen et al., 2022). Synthetic inhibitors such as donepezil (DNPZ), rivastigmine, and galantamine have shown clinical efficacy in stabilizing or slowing cognitive and behavioral decline in patients (Ismail et al., 2025). However, the clinical use of these synthetic compounds is often limited by various adverse effects, including nausea, vomiting, diarrhea, bradycardia, sleep disturbances, kidney toxicity, headache, and dermal hypersensitivity, which are associated with excessive stimulation of peripheral and central cholinergic systems during long-term use (Hussain and Bloemer, 2023). The therapies also remain symptomatic and are unable to halt the underlying neurodegenerative progression of the disease (Dehraj and Vaditake, 2025). The decline in long-term clinical effectiveness and the potential for pharmacological resistance further emphasize the need for the development of novel AChE inhibitors that are more selective, effective, and safe. Therefore, the exploration of natural AChE inhibitors derived from medicinal plants have gained increasing attention due to the ability of phytochemicals to exert competitive biological activity with potentially lower toxicity profiles (Safithri et al., 2025).
Plant extracts contain primary metabolites that support growth and cellular metabolism, as well as secondary metabolites derived from primary metabolism, contributing to the biological activities (Arisandi et al., 2025). These secondary metabolites, including phenolics, flavonoids, and tannins, are widely associated with antioxidant and neuroprotective properties. One plant rich in these bioactive compounds is cinnamon (Cinnamomumburmannii), which has been reported to show diverse pharmacological activities, including antioxidant, anticholinergic, antidiabetic, antibacterial, anti-inflammatory, and neuroprotective effects (Rahwal et al., 2025; Shalihah et al., 2021). Several studies have shown that cinnamon extracts are rich in phenolic, flavonoid, and tannin compounds, accompanied by strong antioxidant activity as evaluated by 2,2-diphenyl-1-picrylhydrazyl (DPPH), ferric reducing antioxidant power (FRAP), and thiobarbituric acid (TBA) assays (Lestari, 2025; Maulana et al., 2022).
Previous in silico studies have reported that certain bioactive compounds in cinnamon, such as epicatechin (EPI) and medioresinol, show strong binding affinity toward the active site of AChE, with interaction patterns comparable to reference ligands (Syarafina et al., 2022). Additionally, in vitro investigations have reported that single cinnamon extracts show higher inhibitory activity than combinations of herbal extracts (Huda et al., 2022). These results suggest that cinnamon has considerable potential to inhibit ACh degradation and support the maintenance of cholinergic function in AD.
To accurately identify and characterize the bioactive components in cinnamon extracts, advanced analytical methods such as ultra high performance liquid chromatography-quadrupole-orbitrap-high resolution mass spectrometer (UHPLC-Q-Orbitrap-HRMS) are required. These methods can enable the separation and detection of complex metabolites with high sensitivity and precision (Prasanthi et al., 2024; Sari et al., 2025). Furthermore, computational methods such as molecular docking allow efficient evaluation of ligand–protein interactions and binding affinity, complementing in vitro results (Hu et al., 2023). This shows that the integration of experimental and in silico methods is effective in accelerating natural product-based drug discovery.
Based on the description above, this study aims to quantify the secondary metabolite contents of Cinnamon bark ethanol extract, including phenolics, flavonoids, and tannins, as well as evaluate antioxidant capacity using DPPH, FRAP, and TBA-based lipid peroxidation inhibition assays. The potential of the extract as AChE inhibitor is also assessed using Ellman’s method, while ligand–enzyme interactions are analyzed through molecular docking along with pharmacokinetic and toxicity predictions. This integrated method is expected to provide a comprehensive understanding of the potential of cinnamon bioactive compounds as natural AChE inhibitors and support the development of alternative plant-based therapies for AD.
2. MATERIALS and METHODS
Cinnamon bark was obtained from a 20-year-old plant (collection no. BMK0284102016) sourced from the Collection Garden of the Tropical Biopharmaceuticals Research Center, IPB University, Bogor Regency, Indonesia (–6.54740; 106.71592). The samples obtained were washed with running water to remove adhering impurities and sun-dried for three days with a total drying duration of nine hours. Subsequently, the dried material was ground into powder, sieved through a 60-mesh sieve, and stored in plastic containers at room temperature for further analysis (Maulana et al., 2022).
Moisture content of Cinnamon bark simplicia was determined using the gravimetric oven-drying method. Initially, porcelain crucibles were heated at 105°C, cooled in a desiccator, and weighed. Approximately 1 g of the sample was dried at 105°C for 3 h, cooled, and reweighed until a constant weight was obtained. A moisture content of less than 10% was considered to meet quality requirements (Safithri et al., 2023). Moisture content was calculated using the following Equation (1).
W0: initial simplicia weight (g), W1: final simplicia weight (g).
A total of 10 g of cinnamon bark simplicia was extracted using the maceration method with 70% ethanol at a ratio of 1:10 (w/v) for 4 × 24 h. The filtrate was concentrated using a rotary evaporator at 45°C–50°C to obtain a viscous extract (Gholam et al., 2025). The extract yield was expressed as a percentage using the following Equation (2).
Total phenolic content (TPC) and total tannin content (TTC) were determined using Folin–Ciocalteu method. Initially, 20 μL of the extract sample was transferred into a 96-well microplate, followed by adding 120 μL of 10% Folin–Ciocalteu reagent. After incubation for 5 min, 80 μL of sodium carbonate solution (7.5%–10%) was added. The mixture was homogenized and incubated in the dark for 30 min. Absorbance was measured using a nano-spectrophotometer at wavelengths of 750 nm and 664 nm for TPC and TTC, respectively. Calibration curves were prepared using gallic acid (0–150 ppm) and tannic acid (12.5–100 ppm) as standards (Yuniasih et al., 2023). TPC and TTC were expressed as gallic acid equivalents (GAE) and tannic acid equivalents (TAE), respectively, based on the corresponding calibration curves (3).
C: concentration standard, V: volume, M: mass, DF: dilution factor.
Total flavonoid content (TFC) was determined using the aluminum chloride (AlCl3) colorimetric method. Based on the experimental procedures, 10 μL of the extract sample was mixed with 50 μL of ethanol, 10 μL of 10% AlCl3 solution, 10 μL of 1 M potassium acetate (CH3COOK), and 120 μL of distilled water. The mixture was incubated in the dark at room temperature for 30 min, followed by absorbance measurement at 415 nm using a nano-spectrophotometer. A calibration curve was prepared using quercetin at concentrations ranging from 0 to 450 ppm (Putri et al., 2025). TFC was expressed as quercetin equivalents (QE) based on the calibration curve (4).
C: concentration standard, V: volume, M: mass, DF: dilution factor.
Antioxidant activity was determined using the DPPH method. Initially, 100 μL of the extract sample was mixed with 100 μL of DPPH solution (125 μmol/L in ethanol) in a 96-well microplate. The mixture was homogenized and incubated in the dark for 30 min. Absorbance was measured at 515 nm using a nano-spectrophotometer, with Trolox (0–80 μM) used as a positive control (Maulana et al., 2022). Antioxidant activity was expressed as Trolox equivalent antioxidant capacity (TEAC) and reported as μmol Trolox equivalents (TE) per g of extract, calculated using Equation (5).
C: concentration standard, V: volume, M: mass, DF: dilution factor.
Antioxidant activity was evaluated using FRAP method. Fresh FRAP reagent was prepared by mixing 300 mmol/L acetate buffer (pH 3.6), 10 mmol/L TPTZ solution, and 20 mmol/L FeCl3 solution at a ratio of 10:1:1 (v/v/v). A total of 20 μL of the extract sample was added to 180 μL of FRAP reagent in a 96-well microplate and incubated at 37°C for 15 min. Absorbance was measured at 595 nm using a nano-spectrophotometer. Antioxidant capacity was expressed as μmol TE/g extract based on a Trolox calibration curve (0–400 μM; Tunnisa et al., 2022). Meanwhile, antioxidant activity was expressed as TEAC and reported as μmol TE per g of extract (6).
C: concentration standard, V: volume, M: mass, DF: dilution factor.
A mixture consisting of 50 mM linoleic acid in 96% ethanol, distilled water, and phosphate buffer was incubated at 40°C. Subsequently, an aliquot of 1 mL of the mixture was reacted with 2 mL of 1% TBA and 2 mL of 20% trichloroacetic acid, followed by heating at 100°C for 10 min. After centrifugation, the absorbance was measured at 532 nm using a nanospectrophotometer. 1,1,3,3-Tetramethoxypropane (TMP; 2.5–25 μmol) was used as the standard for quantification. Vitamin E (200 ppm) was used as a positive control, while distilled water and a 100 ppm sample solution were used as negative controls. Antioxidant capacity was expressed as percentage inhibition (Purwanto et al., 2022). The percentage inhibition of the extract was calculated using the following Equation (7).
Compound analysis was performed using a UHPLC Vanquish system coupled to a Q Exactive Plus Orbitrap high-resolution mass spectrometer (Thermo Fisher Scientific, Waltham, MA, USA). The 70% ethanol extract (5 mg) was dissolved in 1 mL of methanol, filtered through a 0.2 μm nylon membrane filter, and injected into the chromatographic system. Separation was achieved on an Accucore C18 column (100 × 2.1 mm, 1.5 μm particle size) at a flow rate of 0.2 mL/min using a gradient elution of water containing 0.1% formic acid (A) and acetonitrile containing 0.1% formic acid (B). The column temperature was maintained at 30°C, and the injection volume was set at 2 μL. Mass spectrometric analysis was performed in positive and negative electrospray ionization modes over an m/z range of 100–1,500. Compound identification was carried out by comparison with ChemSpider and mzCloud databases (Safithri et al., 2025).
AChE inhibitory activity was evaluated using Ellman’s method with a commercial assay kit (ab138871). All kit components were prepared according to the manufacturer’s instructions, and the enzyme solution was stored at low temperature before use. The reaction was carried out in a microplate with a final volume of 150 μL and incubated at room temperature. The reaction was initiated by the addition of acetylthiocholine (AChT) as the substrate, and absorbance was measured at 410 nm using a microplate reader after 20 min of incubation (Nurinsani et al., 2024). The composition and volume of reagents used for the blank, negative control, positive control, and sample reactions are summarized in Table 1. Enzyme activity and percentage inhibition were calculated according to Equation (8). The IC50 value was determined by regression analysis based on the inhibition curve using either linear or logarithmic models, as described in Equations (9a) and (9b).
For the linear regression model (y = ax + b).
For the logarithmic regression model (y = aln(x) + b).
a: slope of the regression equation, b: intercept of the regression equation, IC50, concentration required to inhibit 50% of AChE activity.
Molecular docking was performed using YASARA Structure software. Following this method, the three-dimensional (3D) structure of AChE receptor was loaded, and the receptor file was prepared in *s format. Water molecules, co-crystallized ligands, and polypeptide B subunits were removed, and appropriate hydrogen atoms were added to the amino acid residues. The grid box was defined at the binding site region based on the best validation results, with a grid size of 2.5 Å. Subsequently, the receptor and test ligands were prepared for docking, and simulation parameters were adjusted as required. Molecular docking simulations were executed using Macro module of YASARA with AMBER14 force field to calculate ligand–receptor interaction energies. The resulting docking poses were extracted and converted into Protein Data Bank (PDB) format for further interaction analysis (Gholam et al., 2026; Safithri et al., 2025).
Drug-likeness evaluation was performed using SwissADME web server by inputting the two-dimensional (2D) structures of the compounds. The evaluated parameters were based on Lipinski’s Rule of Five, including molecular weight, logarithm of the partition coefficient (log P), and the number of hydrogen bond donors and acceptors. Pharmacokinetic and toxicity predictions of the candidate compounds were conducted using pkCSM platform by submitting the compound structures in SMILES format. The analyzed ADMET parameters included human intestinal absorption (%HIA), Caco-2 cell permeability, blood–brain barrier (BBB) penetration, plasma protein binding (PPB), and toxicity potential based on Ames mutagenicity and carcinogenicity predictions.
Statistical analysis was performed to evaluate the effects of C. burmannii extract on secondary metabolite quantification, antioxidant capacity, and AChE inhibition. Data analysis was conducted using Minitab 17 software. One-way analysis of variance (ANOVA) was applied at a 95% confidence level, and statistically significant differences were determined at a p-value < 0.05. 2D and 3D interaction analyses of ligand–receptor complexes were performed using BIOVIA Discovery Studio and PyMOL software.
3. RESULTS and DISCUSSION
Moisture content is an important parameter in determining the quality of plant raw materials. This is because excessive moisture can promote the growth of microorganisms such as molds, yeasts, and bacteria, leading to degradation of phytochemical constituents and reduced stability during storage (Nakra et al., 2025). As presented in Table 2, gravimetric analysis showed that moisture content of Cinnamon Bark simplicia was 5.83 ± 0.17%. This value meets the requirements of Indonesian Herbal Pharmacopoeia, which specifies moisture content < 16% for herbal raw materials, thereby supporting the stability of the material during long-term storage (Kementerian Kesehatan Republik Indonesia, 2017).
| Parameter | Mean (%) |
|---|---|
| Moisture content | 5.83 ± 0.17 |
| Yield | 37.14 ± 0.41 |
The obtained moisture content is comparable to the 6.71% reported by Prasetyorini et al. (2021) in cinnamon bark samples. However, moisture content alone is insufficient to represent the overall quality consistency of plant-derived materials. This shows the need for a comprehensive evaluation, considering physicochemical properties, phytochemical composition, and processing conditions, influencing the stability and bioactivity of plant metabolites (Djarot et al., 2023). Postharvest handling, drying methods, and environmental factors such as temperature and humidity can affect the quality and stability of plant materials during storage (Ban et al., 2024). Previous studies have shown that different drying methods can alter the physicochemical characteristics, essential oil content, and bioactive compound profiles of cinnamon bark, indicating the importance of processing conditions in determining raw material quality (Li et al., 2024). Although moisture content is an important indicator of storage stability and microbial safety, additional physicochemical and phytochemical analyses are essential to ensure the consistency and reliability of the extract used for further studies.
Extraction using the maceration method with 70% ethanol produced an extraction yield of 37.14 ± 0.41% (Table 2), which was higher than the 32.21% reported by Anggraini et al. (2021). Differences in extraction yield can be influenced by several factors, including simplicia particle size, solvent polarity, extraction duration, and the diffusion efficiency of bioactive compounds. The use of 70% ethanol contributed to the high extraction yield because the intermediate polarity enabled effective extraction of phenolic compounds from plant matrices (Kuspradini et al., 2024; Tourabi et al., 2025). Furthermore, the obtained yield exceeded the minimum requirement of 25.4% specified in Indonesian Herbal Pharmacopoeia, indicating good extraction efficiency (Kementerian Kesehatan Republik Indonesia, 2017).
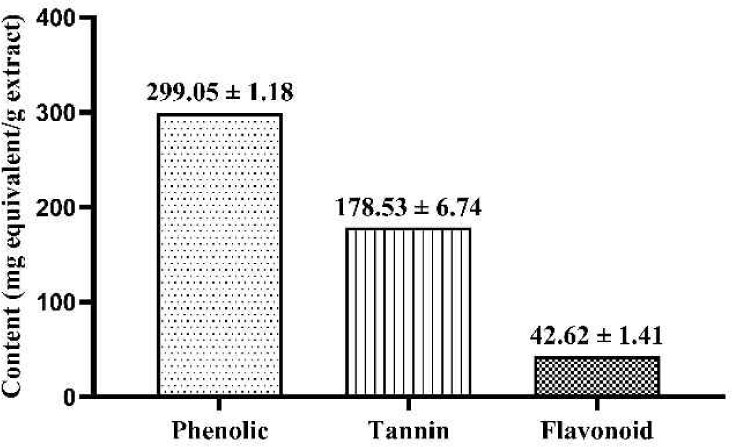
TPC was determined using Folin–Ciocalteu method, with absorbance measured at a wavelength of 750 nm through a nano-spectrophotometer. Gallic acid was used as the calibration standard. Based on observation, the calibration curve obtained from absorbance data was described by the equation y = 0.0049x + 0.00168, with a regression coefficient (R2) of 0.99. TPC of ethanol extract of cinnamon bark was 299.05 ± 1.18 mg GAE/g extract (Fig. 1). This value was significantly higher than the 100.37 ± 0.11 mg GAE/g extract obtained Maulana et al. (2022) and phenolic content reported by Mnge et al. (2025) for ethanol extract of Cinnamomum verum (223.69 ± 23 mg GAE/g extract).
Phenolic compounds play a major role in antioxidant activity due to their ability to donate electrons and neutralize free radicals (Andrés et al., 2023). In this study, the high phenolic content observed was associated with the effectiveness of 70% ethanol as a solvent with intermediate polarity, which was optimal for extracting moderately polar phenolic compounds (Favas et al., 2022). Therefore, solvent polarity is considered a crucial factor in enhancing TPC in plant extracts. In addition to extraction parameters, environmental conditions such as ultraviolet radiation exposure, drought stress, and soil composition have been reported to influence phenolic biosynthesis in plants (Kharisma et al., 2023; Salam et al., 2023).
TTC was determined using Folin–Ciocalteu method, with absorbance measured at 664 nm through a nano-spectrophotometer. Tannic acid dissolved in 70% ethanol was used as the calibration standard. Specifically, TTC was calculated based on the calibration curve described by the equation y = 0.0068x – 0.0054, with an R2 value of 0.99, which obtained a value of 178.53 ± 6.74 mg TAE/g extract (Fig. 1). This value was substantially higher than the 42.89 ± 0.77 mg catechin (CAT) equivalents/g extract reported by Novaryatiin et al. (2023) for Cinnamomum javanicum.
Tannins are secondary metabolites that play an important role in plant defense systems by acting as protective agents against biotic and abiotic stresses (Molnar et al., 2024). Variations in tannin content among plant species, as well as different plant parts within the same species, are often associated with changing ecological adaptation strategies. This is because the biosynthesis of tannins is generally influenced by environmental factors such as altitude, light intensity, temperature, water availability, and soil type. Consequently, plants growing under more challenging environmental conditions tend to produce higher levels of secondary metabolites as a self-protection mechanism (Iqbal and Poór, 2025).
TFC was determined using AlCl3 method, with absorbance measured at 415 nm using a nano-spectrophotometer. Quercetin dissolved in 70% ethanol was used as the reference standard. The calibration curve was described by the equation y = 0.0016x – 0.0013, with an R2 value of 0.99. The analysis showed that cinnamon bark extract contained 42.62 ± 1.41 mg QE/g extract (Fig. 1). This value was higher than the results obtained by Mnge et al. (2025) for C. verum (5.03 ± 0.44 mg QE/g extract), but lower than TFC of C. javanicum at 126.96 ± 3.17 mg QE/g extract reported by Novaryatiin et al. (2023), which reached 126.96 ± 3.17 mg QE/g extract.
Variations in flavonoid content are influenced by ecological factors, including sunlight intensity, humidity, and soil nutrient availability, which play key roles in regulating flavonoid biosynthetic pathways (Salam et al., 2023). Additionally, extraction parameters such as solvent type, temperature, and extraction duration affect flavonoid recovery efficiency (Zhu et al., 2025). Geographic variation, as reported by Kharisma et al. (2023), further emphasizes that both environmental and genetic factors significantly contribute to flavonoid content variability in C. burmannii.
DPPH assay was used to evaluate the free radical scavenging ability of the extract through a hydrogen atom donation mechanism, which was indicated by a color change of DPPH solution from deep purple to yellow as a result of radical reduction (Kiptiyah et al., 2021). Absorbance was measured at a wavelength of 515 nm using a nano-spectrophotometer, and antioxidant capacity was calculated based on a Trolox standard curve with the regression equation y = 0.005x + 0.0268 and a regression coefficient (R²) of 0.985.
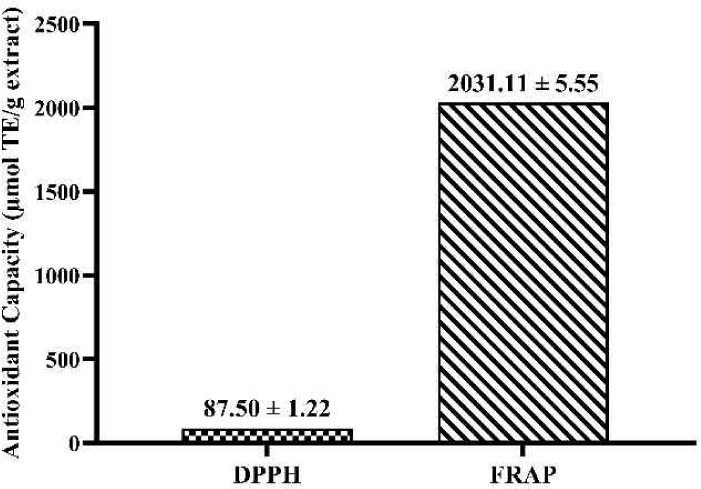
The results showed that ethanol extract of Cinnamon Bark had DPPH radical scavenging capacity of 87.50 ± 1.22 μmol TE/g extract (Fig. 2). In comparison, this value was lower than 426.00 ± 0.05 μmol TE/g extract obtained for ginger extract (Plana et al., 2025). The difference indicates that antioxidant activity of Cinnamon bark extract is lower than ginger extract under similar conditions. However, the observed activity suggests that cinnamon bark contains bioactive antioxidant compounds, particularly phenolic and flavonoid compounds, which contribute to free radical scavenging activity. Differences in antioxidant capacity between plant extracts can also be influenced by variations in phytochemical composition, extraction conditions, and the relative abundance of phenolic constituents.
The high antioxidant capacity observed in cinnamon bark extract was associated with the use of 70% ethanol as the extraction solvent. This solvent possesses intermediate polarity, thereby enabling more efficient extraction of semi-polar antioxidant compounds compared to water or absolute ethanol. The conditions enhance the extraction efficiency of bioactive compounds, leading to improved DPPH radical scavenging capacity (Kurniasari et al., 2024).
FRAP assay was used to evaluate antioxidant capacity based on the ability of bioactive compounds to reduce ferric ions (Fe3+) to ferrous ions (Fe2+) through an electron-transfer mechanism. This reduction is indicated by the formation of Fe2+–TPTZ complex, producing an intense blue color under acidic conditions (Heckmann et al., 2024). Furthermore, antioxidant capacity was quantified using a Trolox calibration curve (y = 0.0018x – 0.0276; R2 = 0.994).
Ethanol extract of cinnamon bark showed a high FRAP antioxidant capacity of 2,031.11 ± 5.55 μmol TE/g extract, corresponding to 508.37 ± 1.39 mg TE/g extract. This value was lower compared to the (1,415.71 mg ascorbic acid equivalent (AAE)/g extract) reported by Antasionasti and Jayanto (2021) for cinnamon extract obtained using 96% ethanol. The difference in results is due to solvent polarity, which influences the profile and concentration of extracted phenolic compounds (Kurniasari et al., 2024). Antioxidant capacity observed in this study remained higher than other herbal materials, such as Zingiber officinale (142.17 mg AAE/g extract) and Curcuma xanthorrhiza (81.48 μmol TE/g dry weight), confirming cinnamon bark as a potent source of reducing antioxidants (Amin et al., 2024; Asyhar et al., 2023).
TBA assay was used to evaluate antioxidant capacity of cinnamon bark ethanol extract in inhibiting lipid peroxidation through the quantification of malondialdehyde (MDA), a final product of linoleic acid auto-oxidation. This method is based on the reaction between one molecule of MDA and two molecules of TBA, forming a pink-colored MDA–TBA complex that is analyzed using a UV–Vis spectrophotometer at 532 nm (Leon and Borges, 2020; Purwanto et al., 2022). The intensity of the color is directly proportional to MDA concentration and shows the extent of lipid peroxidation, indicating that lower absorbance values represent reduced free radical activity (Mariutti, 2022).
MDA levels were quantified using a calibration curve constructed from TMP as MDA precursor, which yielded a linear regression equation of y = 0.025x – 0.0096 with a high coefficient of determination (R2 = 0.998). The maximum incubation time for linoleic acid peroxidation was observed on day 7. This is indicated by a continuous increase in absorbance from day 0 to 7 during the propagation phase of lipid peroxidation, followed by a decline on day 8 due to the degradation of conjugated dienes into MDA. However, previous studies reported maximum incubation times between days 3 and 6 (Purwanto et al., 2022), suggesting that variations in experimental conditions could influence lipid peroxidation kinetics.
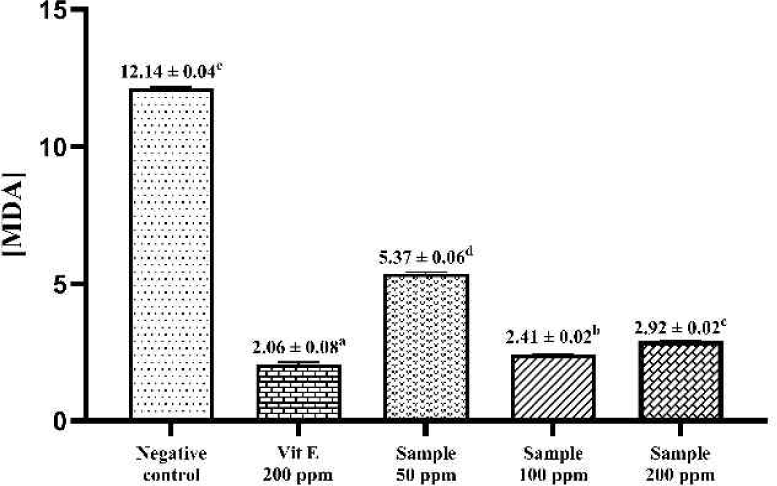
The quantitative analysis of vitamin E at a concentration of 200 ppm (positive control) showed the lowest MDA level (2.06 ± 0.08 μmol/L) with an inhibition percentage of 83.00 ± 0.006%, confirming its role as a chain-breaking antioxidant through hydrogen atom donation mechanisms (Laksono et al., 2023; You et al., 2024). In comparison, the negative control (70% ethanol) produced the highest MDA concentration (12.14 ± 0.04 μmol/L), indicating extensive lipid peroxidation in the absence of antioxidant protection (Darbar et al., 2021).
Cinnamon bark ethanol extract significantly reduced MDA levels (p < 0.05) at all tested concentrations. Based on the results, optimal antioxidant activity was observed at 100 ppm (2.41 ± 0.02 μmol/L), which was more effective than both 50 ppm and 200 ppm concentrations (Fig. 3). Duncan’s multiple range test confirmed significant differences among treatments, indicating the presence of an optimal concentration, where bioactive compounds such as phenolics and flavonoids exerted maximal antioxidant activity. At higher concentrations, these compounds could potentially show pro-oxidant effects, as reported in previous studies.
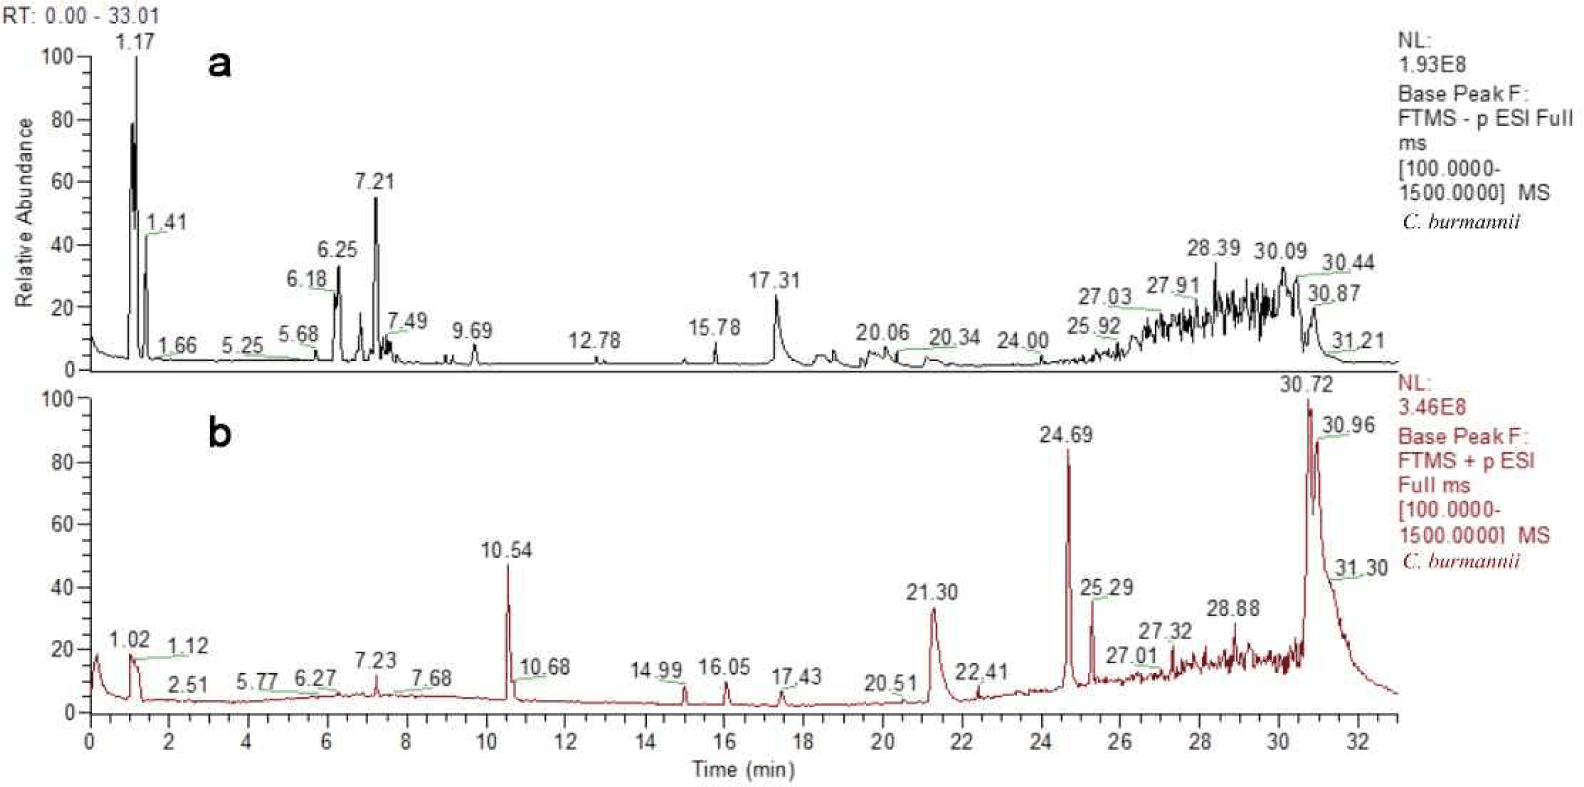
Metabolite profiling of ethanol extract using UHPLC–Q–Orbitrap–HRMS in both positive electrospray ionization mode (ESI [M+H]+) and negative ionization mode ([M–H]–) identified 55 compounds, as presented in Fig. 4 and Table 3. The chromatograms showed a broad distribution of peaks across the retention time range, indicating the chemical diversity of metabolites with varying degrees of polarity. Early retention times (approximately 1.0–1.4 min) were dominated by polar metabolites, primarily carbohydrates, organic acids, and amino acids, classified as primary metabolites and generally included in fundamental plant metabolic processes. In comparison, metabolites eluting at medium to high retention times were predominantly semi-polar to nonpolar secondary metabolites, particularly phenolics, flavonoids, and polyphenols, which contributed to the biological activities of plants (Nan et al., 2025).
As shown in Table 3, coumarin (CMR) was the most abundant compound in the extract (11.29%), followed by hex-2-ulose (9.23%), cinnamtannin B1 (7.77%), glucoheptonic acid (6.76%), and choline (5.32%). This indicates that Cinnamon bark ethanol extract is rich in a diverse combination of primary and secondary metabolites. The presence of phenolic and polyphenolic compounds such as cinnamtannin B1, procyanidin B2, CAT, and EPI suggests potential relevance to antioxidant-related biological functions (Ayuda-Durán et al., 2024; Jia et al., 2023). Meanwhile, carbohydrates and organic acids may contribute to metabolite stability and facilitate potential synergistic effects within the extract. The wide variation in relative abundance and retention times shows the chemical complexity of the extract, indicating that the extract possesses a complex metabolite profile with high potential as a source of functionally valuable bioactive compounds (Anggela et al., 2024; Liang et al., 2022; Liu et al., 2024).
AChE inhibitory activity in this study was evaluated using Ellman’s method, with absorbance measured at 410 nm and an optimal incubation time of 20 min. This method was selected due to the high sensitivity in detecting changes in enzymatic activity through the formation of 5-thio-2-nitrobenzoate (TNB) ions, generated from the reaction between 5,5′-dithiobis-(2-nitrobenzoic acid) (DTNB) and thiocholine released during substrate hydrolysis by AChE. DNPZ hydrochloride was used as a positive control because of its well-established clinical efficacy as AChE inhibitor in the treatment of AD. The results indicated that DNPZ had highly potent in vitro AChE inhibitory activity, as shown by an IC50 value of 0.03 μg/mL (Fig. 5). Similarly, David et al. (2021) observed a comparable IC?? value of 0.03 μg/mL, thereby confirming the reliability and stability of DNPZ as a reference AChE inhibitor under in vitro conditions.
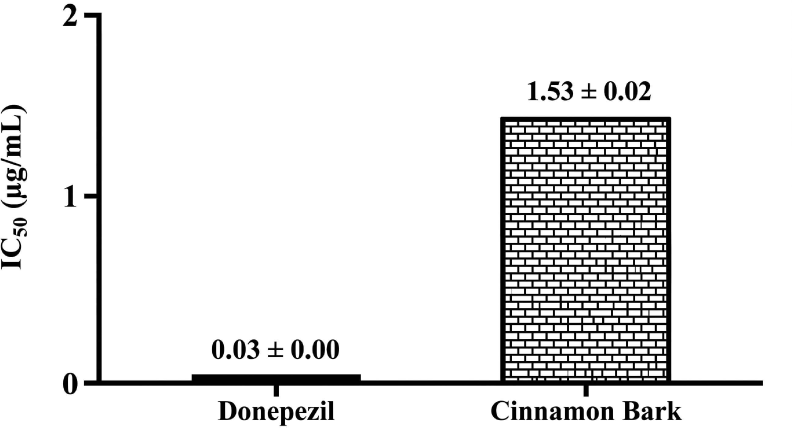
The extract showed lower inhibitory potency than DNPZ, with IC50 value of 1.53 ± 0.02 μg/mL (Fig. 5). Based on established classifications of enzyme inhibitory strength, this value falls within the category of very strong inhibitors (< 10 μg/mL; Deepa and Dennis, 2025). Generally, AChE inhibitory activity is classified into four categories according to IC50 values, namely very strong (< 10 μg/mL), strong (10–50 μg/mL), moderate (50–100 μg/mL), and weak (> 100 μg/mL; Deepa and Dennis, 2025). These results correlated with the values obtained by Huda et al. (2022), where cinnamon bark showed very strong AChE inhibitory potential. However, the inhibitory activity observed in this study was higher compared to other herbal materials under comparable in vitro assay conditions, such as red betel (Piper crocatum; IC50 = 11.10 μg/mL) and cardamom (Amomum compactum; IC50 = 24.90 μg/mL; Nurinsani et al., 2024; Pavarino et al., 2023).
Molecular docking is a computational method used to predict the orientation and binding affinity of a ligand within the active site of a target protein (Kulkarni et al., 2025). As presented in Table 4, molecular docking results indicated that DNPZ, used as the reference ligand, had the lowest binding energy (–11.37 kcal/mol), followed by caffeoylshikimic acid (CSA; –10.39 kcal/mol), EPI (–9.81 kcal/mol), and CAT (–9.42 kcal/mol). In comparison, CMR and hydroxycinnamaldehyde (HCA) showed relatively higher binding energies of –7.39 and –7.25 kcal/mol, respectively.
All ligands interacted with key amino acid residues in AChE active site, particularly Trp86, Gly121–Gly122, Ser203, Phe295, Phe297, Phe338, Tyr337, Tyr341, and His447, which played critical roles in ligand recognition and catalytic activity (Table 4). Based on the ranking of binding energies, DNPZ showed the highest binding affinity, followed by CSA, EPI, and CAT, while phenylpropanoid-type ligands had comparatively lower binding affinities.
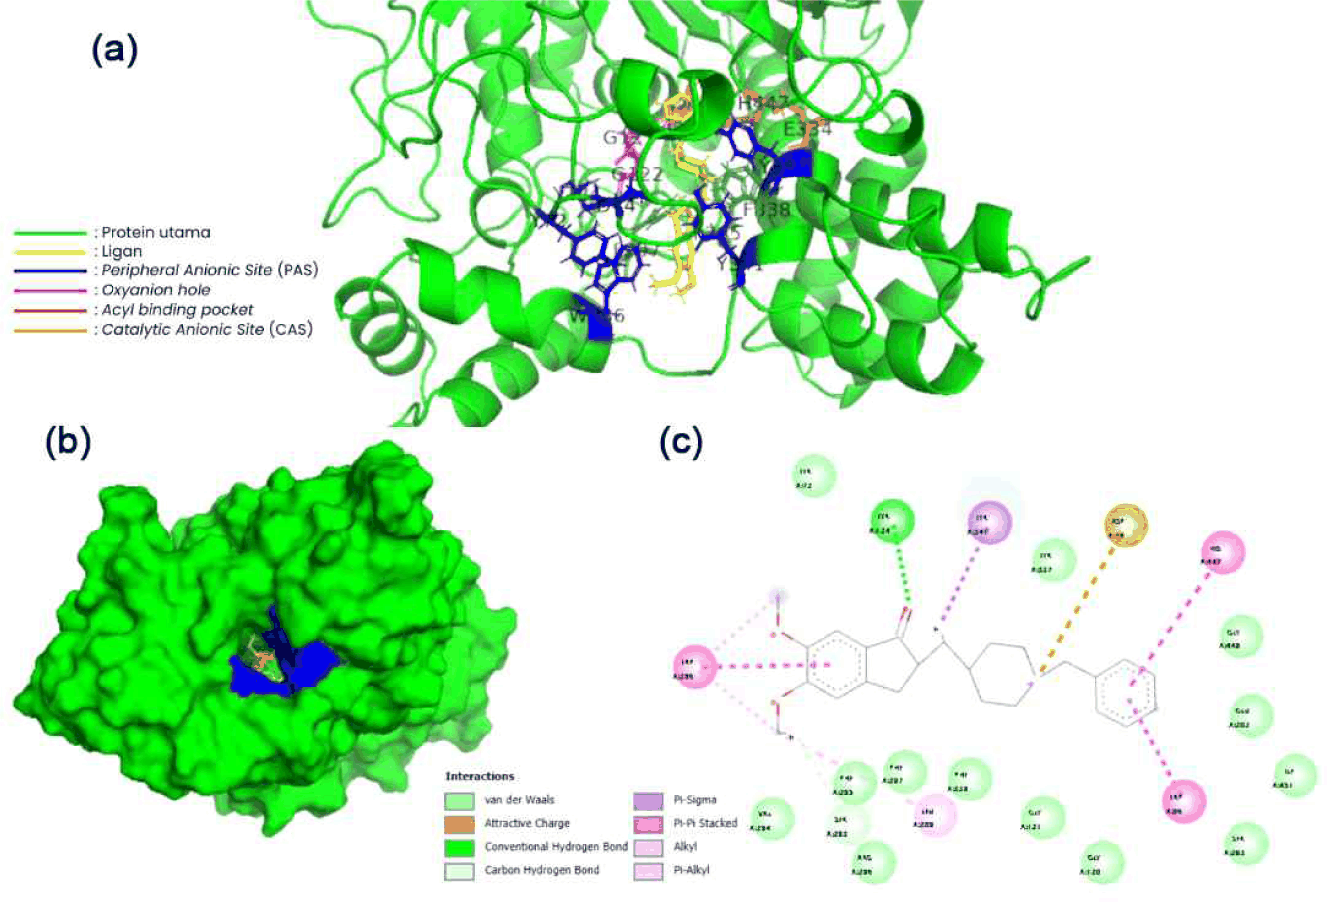
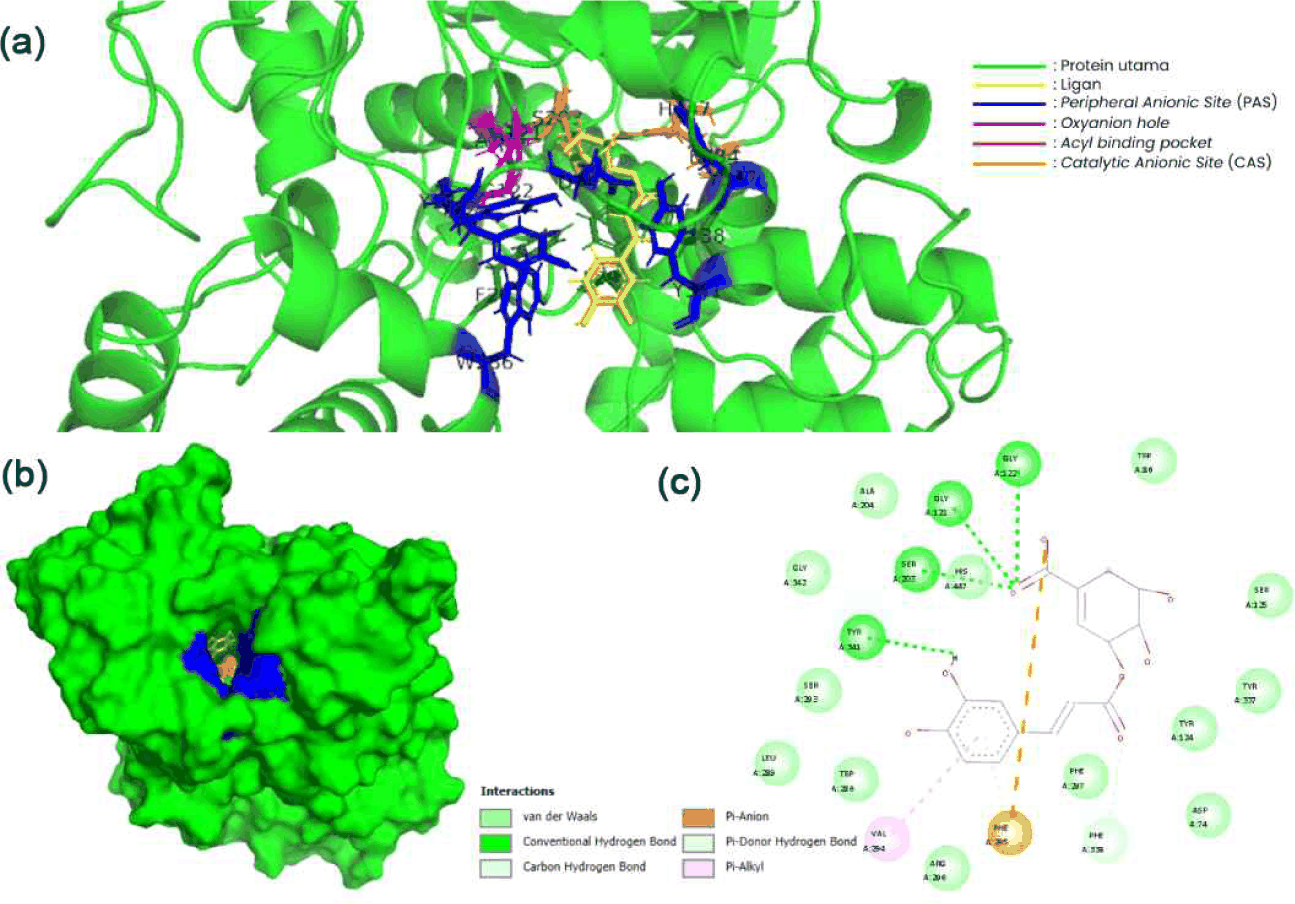
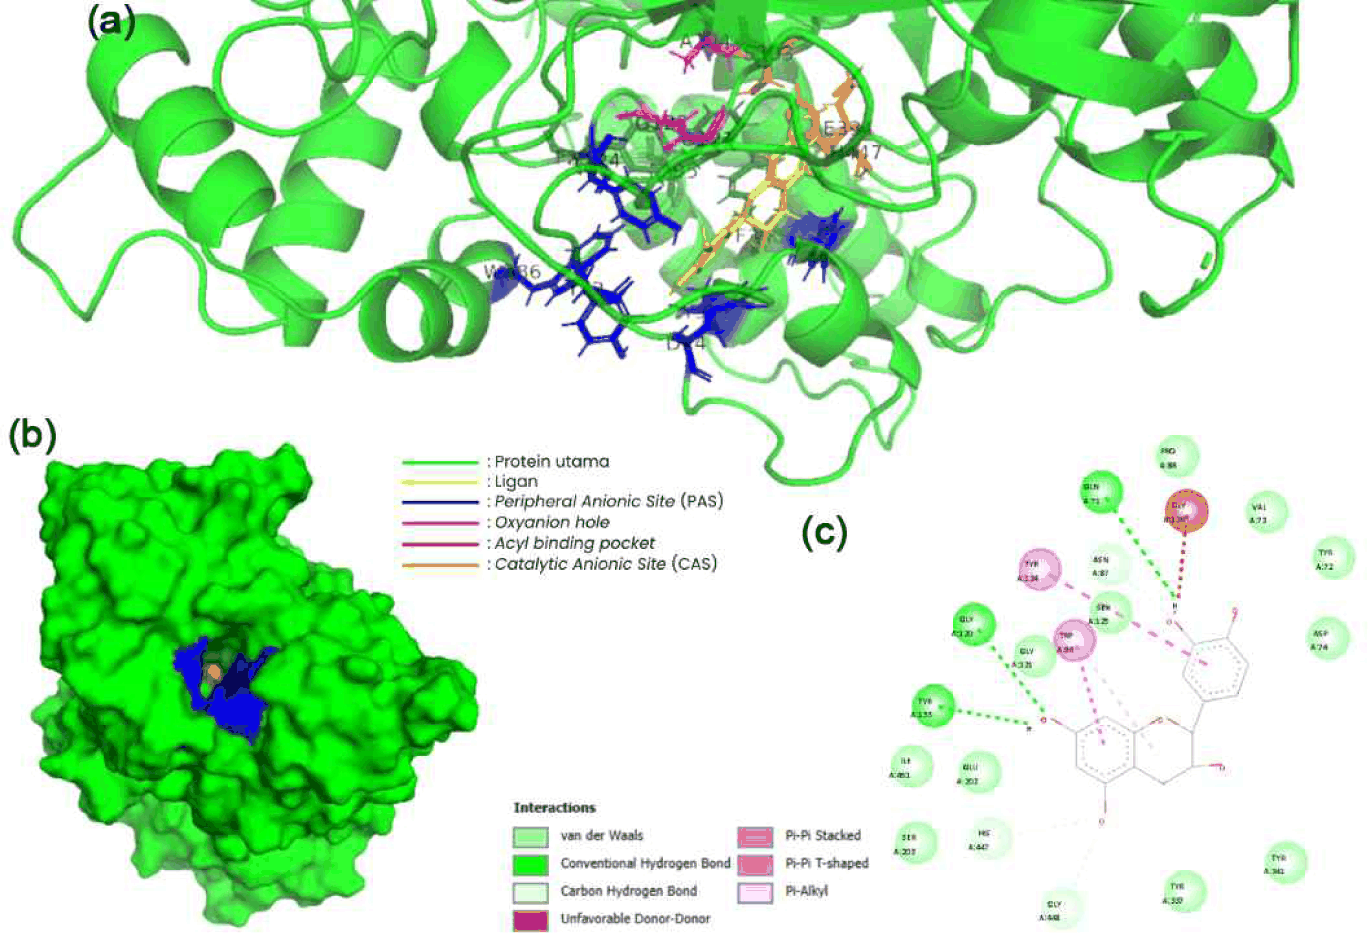
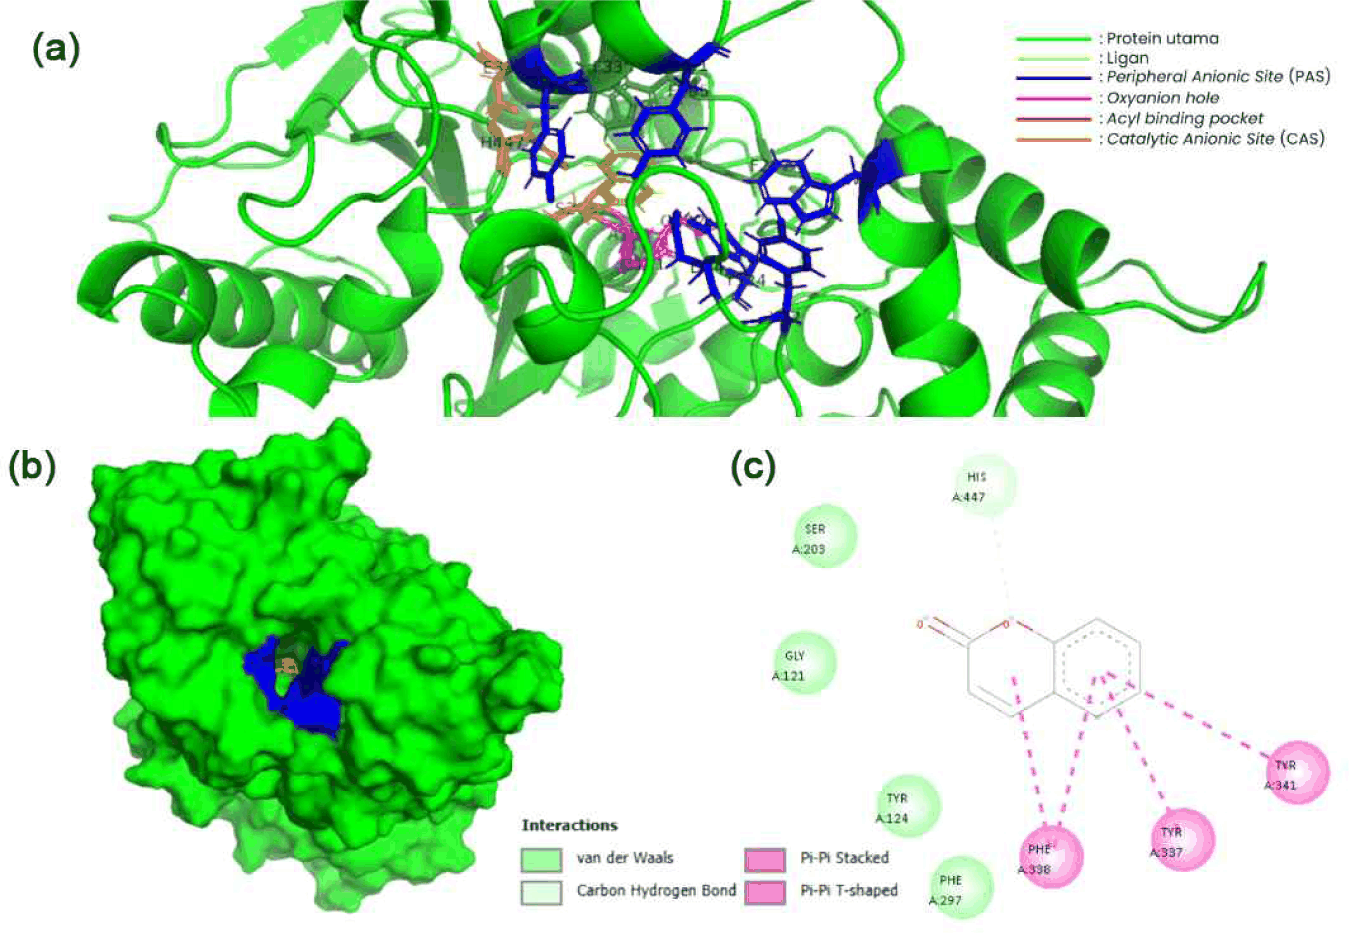
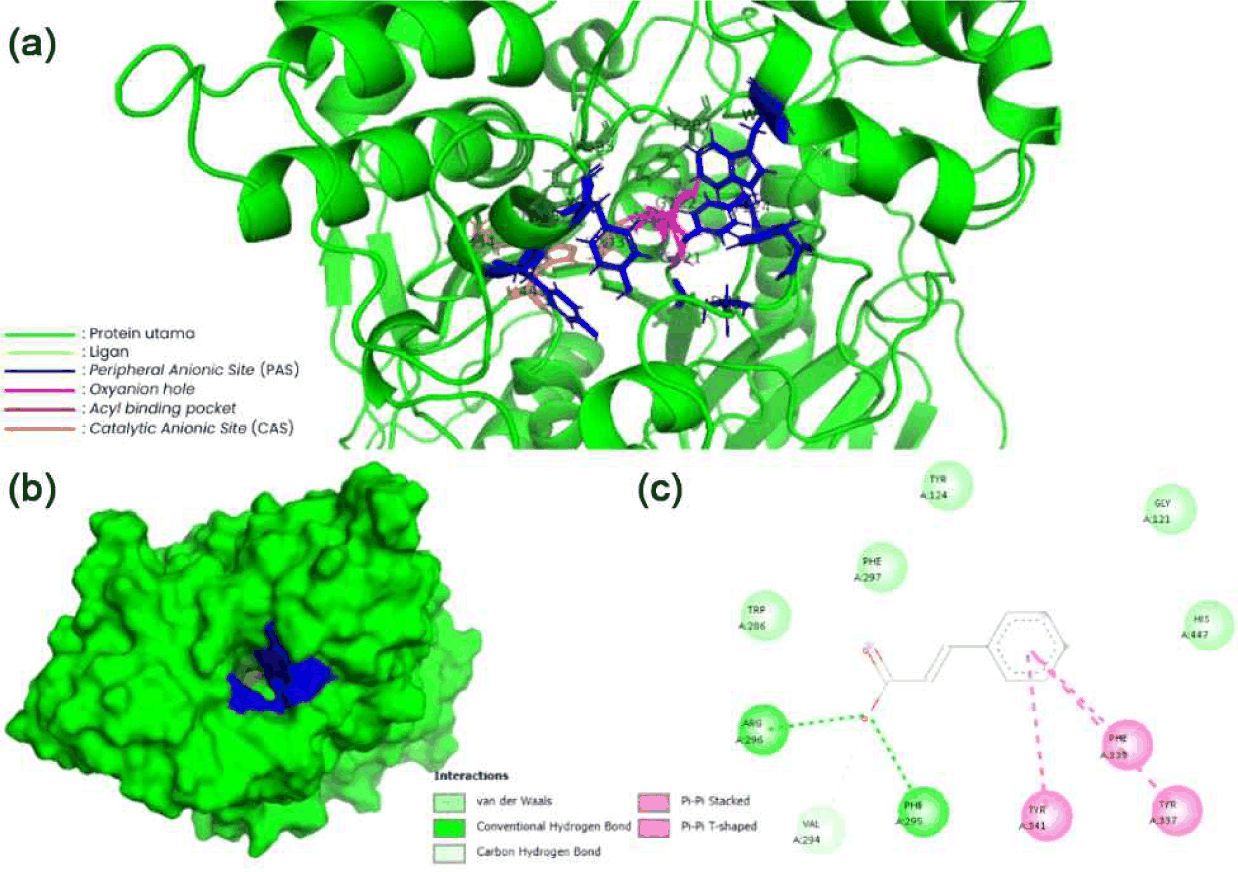
Based on the results, 3D and 2D docking visualizations further elucidated the interaction patterns between the selected ligands and AChE active site (Figs. 6–11). DNPZ occupied the active gorge of AChE and interacted simultaneously with the PAS and CAS, forming hydrogen bonds and π–π interactions with key residues, including Trp86, Tyr124, Ser203, and His447 (Fig. 6). Similarly, CSA adopted a stable binding orientation along the active gorge, showing multiple hydrogen bonds and polar interactions with residues in both PAS and CAS regions (Fig. 7).
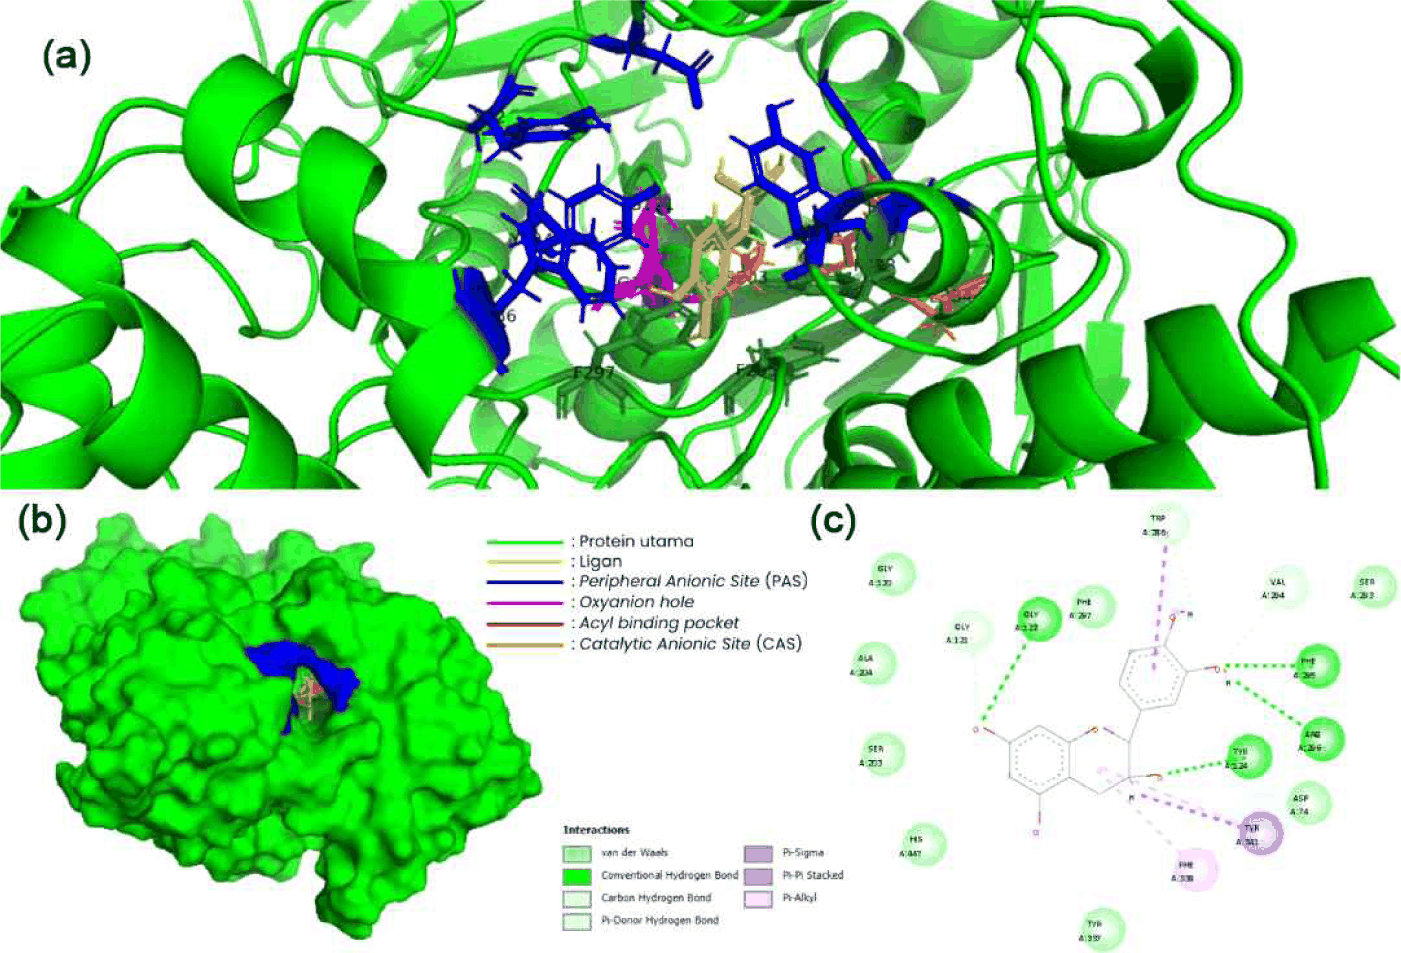
EPI and CAT showed comparable binding modes, occupying the substrate-binding pocket and interacting with residues associated with the catalytic triad and oxyanion hole, such as Ser203, Gly121–Gly122, and His447, along with aromatic residues including Trp86 and Tyr337 (Figs. 8 and 9). In comparison, CMR and HCA showed less extensive interaction networks, predominantly including hydrophobic contacts and fewer hydrogen bonds within the active site (Figs. 10 and 11). Overall, ligands capable of engaging residues across PAS, CAS, and oxyanion hole regions showed more stable binding to AChE, consistent with their lower binding energy values (Table 4).
Drug-likeness evaluation is a crucial step in the early screening of compounds as potential drug candidates, providing insight into their physicochemical suitability and oral bioavailability (Lee et al., 2022). In this study, the best-performing ligands identified from molecular docking were further evaluated for their physicochemical properties using SwissADME, with the results shown in Table 5. Generally, orally active drug candidates are expected to meet the criteria of Lipinski’s Rule of Five, including a molecular weight below 500 Da, a maximum of five hydrogen bond donors, ten hydrogen bond acceptors, and a moderate topological polar surface area (TPSA). For compounds intended to target the central nervous system (CNS), high gastrointestinal (GI) absorption and the ability to penetrate BBB are considered essential parameters (Miebs et al., 2024; Zhu et al., 2023).
Based on SwissADME analysis (Table 5), DNPZ, used as the reference ligand, showed a molecular weight of 379.49 Da, low TPSA, high GI absorption, and favorable BBB permeability. EPI, CSA, and CAT also satisfied Lipinski’s criteria, indicating acceptable basic drug-likeness properties. CSA showed low GI absorption and poor BBB permeability, while EPI and CAT had high GI absorption but were not predicted to cross BBB because of their relatively elevated TPSA values. In comparison, CMR and HCA showed high predicted GI absorption and favorable BBB permeability, due to their lower molecular weights and TPSA values. This observation is consistent with previous reports indicating that compounds with TPSA values below 100 Å2 are more likely to cross BBB (Kato et al., 2023).
In silico pharmacokinetic and toxicity predictions were conducted using pkCSM. The results presented in Table 6 showed significant differences in ADMET profiles among the tested compounds. Based on the established standard, compounds with HIA ? 85%, positive Caco-2 permeability, and logBB values close to or above zero are considered to have favorable oral absorption and CNS distribution (Kus et al., 2023; Stéen et al., 2022). Compounds predicted to be non-mutagenic, non-hepatotoxic, and not acting as substrates or inhibitors of CYP3A4 are also preferred due to their lower risk of toxicity and drug–drug interactions (Lee et al., 2024; Lin et al., 2022; Lou et al., 2023).
According to pkCSM predictions (Table 6), DNPZ showed high HIA (93.70%), positive Caco-2 permeability (1.27), and moderate BBB penetration (logBB = 0.16). Despite these properties, DNPZ was predicted to be hepatotoxic, acting as both substrate and inhibitor of CYP3A4, which could be associated with an increased risk of drug–drug interactions. CSA, EPI, and CAT showed less favorable pharmacokinetic profiles, characterized by moderate HIA, low Caco-2 permeability, and limited BBB penetration. All three compounds were predicted to be non-mutagenic and non-hepatotoxic, without interacting with CYP3A4. In comparison, CMR and HCA showed pharmacokinetic profiles more closely related to ideal drug-like characteristics, including high HIA (> 92%) and positive Caco-2 permeability. Among these compounds, HCA had comparatively better BBB penetration due to their lower TPSA values and molecular size. Toxicity predictions further indicated that CMR and HCA were non-mutagenic and non-hepatotoxic.
4. CONCLUSIONS
In conclusion, this study shows that ethanol extract of cinnamon bark is rich in secondary metabolites, particularly phenolic, flavonoid, and tannin contents. These compounds are associated with strong antioxidant activity, effective inhibition of lipid peroxidation, and significant AChE inhibitory activity, as indicated by IC50 value of 1.53 ± 0.02 μg/mL. UHPLC-Q-Orbitrap-HRMS analysis identifies a total of 55 compounds in the extract. These include HCA, which shows potential as a promising AChE inhibitor characterized by stable interactions with the enzyme active site as well as favorable in silico pharmacokinetic and toxicity profiles. In line with the analysis, this study shows the potential of cinnamon bark ethanol extract and its bioactive constituents as a valuable natural source of AChE inhibitors, which can support further exploration in the development of complementary strategies for AD management.