1. INTRODUCTION
The forestry sector is integral to Indonesia’s economy as a supplier of primary raw materials to the downstream sector, mainly in the form of logs, and as an engine for economic growth through increased investment, improved export performance, and internal revenue generated by governments through tax and non-tax activities. The forestry sector also contributes substantially to employment and business opportunities (Mutaqin et al., 2022). Indonesia’s forestry industry is in a state of stagnation and declining productivity and is often referred to as a “sunset industry”. One considerable challenge is the limited supply of raw materials, which has led to a steady decline in wood-processing production (Benyamin et al., 2019; Maharani et al., 2025). According to the 2019–2045 Production Forest Development Road Map, Indonesia aims to produce 269.05 million m3 of wood annually from plantation forests and 14.31 million m3 from natural forests by 2045. The number of logs produced in Indonesia in 2022 was only 64.65 million m3 (BPS, 2022). To meet the need for industrial raw materials, some wood raw materials are imported from other countries (KLHK, 2022). The existing gap between the demand for and production of wood materials highlights the urgent need to improve demand fulfillment to meet future targets. Wood demand can be met through measures such as growing fast-growing species in plantations (Hadi et al., 2022). One alternative, a potentially fast-growing species native to Indonesia, is Neolamarckia macrophylla (Roxb.). Bosser (Cahyono et al., 2015; Halawane et al., 2011; Sandalayuk et al., 2023).
N. macrophylla is a fast-growing tree species endemic to Indonesia, with an area of natural distribution ranging from Sulawesi to Maluku (Augustina et al., 2023). This species can grow in lowland areas up to 1,000 m above sea level (asl) and is commonly found in several forest landscapes, including secondary forests, riverbanks, valleys, and hill ridges (Cahyono et al., 2015; Halawane et al., 2011; Shi et al., 2020). This species is also known for its adaptability to various soil types and rapid growth, and is widely planted in industrial and community forests (Irawan and Purwanto, 2014; Mpapa et al., 2025; Sandalayuk et al., 2023; Yuniarti et al., 2023). N. macrophylla growth can be optimized by growing in more favorable areas, such as damp areas, and is less tolerant of drought stress (Yulianti and Sudrajat, 2016). The species can reach 45 m in height with a branch-free height of 30 m; a diameter of 40–50 cm; and straight, self-pruning trunks, making it suitable for timber production without intensive silvicultural intervention. The wood characteristics of N. macrophylla are classified as durability class IV and strength class II–III, with long, straight fibers, and a smooth texture (Augustina et al., 2023; Priadi et al., 2021). These wood characteristics make it ideal for use in pulp, paper, plywood, particleboard, and construction materials (Cahyono et al., 2015; Halawane et al., 2011; Lempang, 2014).
The development of N. macrophylla in forest plantations is limited by the availability of genetically-superior seed sources and requires support for high-quality seeds. The procurement of high-quality seeds for native species is often an obstacle to reforestation activities, both nationally in Indonesia and globally (Bosshard et al., 2021; Di Sacco et al., 2021). Sources of high-quality genetic seeds have been unavailable (DPTH, 2022) and the initiation of tree breeding activities involving diversity from a relatively wide growing distribution is required. Several initial progeny tests have been conducted for the development of N. macrophylla seed sources (A’ida et al., 2019) with 108 families from Sulawesi, and 55 families from Konawe, Southeast Sulawesi (Surip et al., 2017).
The results presented by A’ida et al. (2019) and Surip et al. (2017) showed low-to-moderate heritability estimates for individual and family tree heights and diameters, indicating that genetic material from a broader distribution is necessary to optimize N. macrophylla breeding programs. Additional wood quality parameters are needed, considering that for specific purposes, the wood quality of N. macrophylla is still low (Augustina et al., 2023; Priadi et al., 2020), especially for solid wood, so that breeding activities to produce plantations with shorter cycles and a higher quantity of timber can be realized (Nugroho et al., 2024). To enhance the effectiveness of breeding programs, genetic material from a wide geographical range must be incorporated. Collecting genetic material from a wider geographical distribution is believed to increase genetic diversity and improve the effectiveness of breeding activities (Zobel and Talbert, 1984).
The current study evaluated the growth and wood quality of 72 families from 10 populations across Sulawesi and Maluku using a progeny test established at the Parungpanjang Forest Research Station in Bogor. The objective of this study was to estimate the genetic parameters for growth and wood quality traits of 6-y-old N. macrophylla to select progeny tests for solid wood seed sources in Parungpanjang, Bogor.
2. MATERIALS and METHODS
The progeny test of N. macrophylla was established using genetic material from plus trees (mother trees) that were growing naturally in 10 populations, i.e., eight populations from the Sulawesi region (Konawe, East Luwu, Muna, Buton, Banggai, Wajo, Manado, and Kotamobagu) and two populations from the Maluku region (Tidore and Seram islands; Fig. 1). Plus tree selection was conducted following the method described by Clark and Wilson (2005). The distance between selected mother trees in each population was set at 100 m to prevent the collection of seeds from related mother trees. Geoclimatic information and the number of N. macrophylla mother trees used to establish the progeny tests are presented in Table 1.
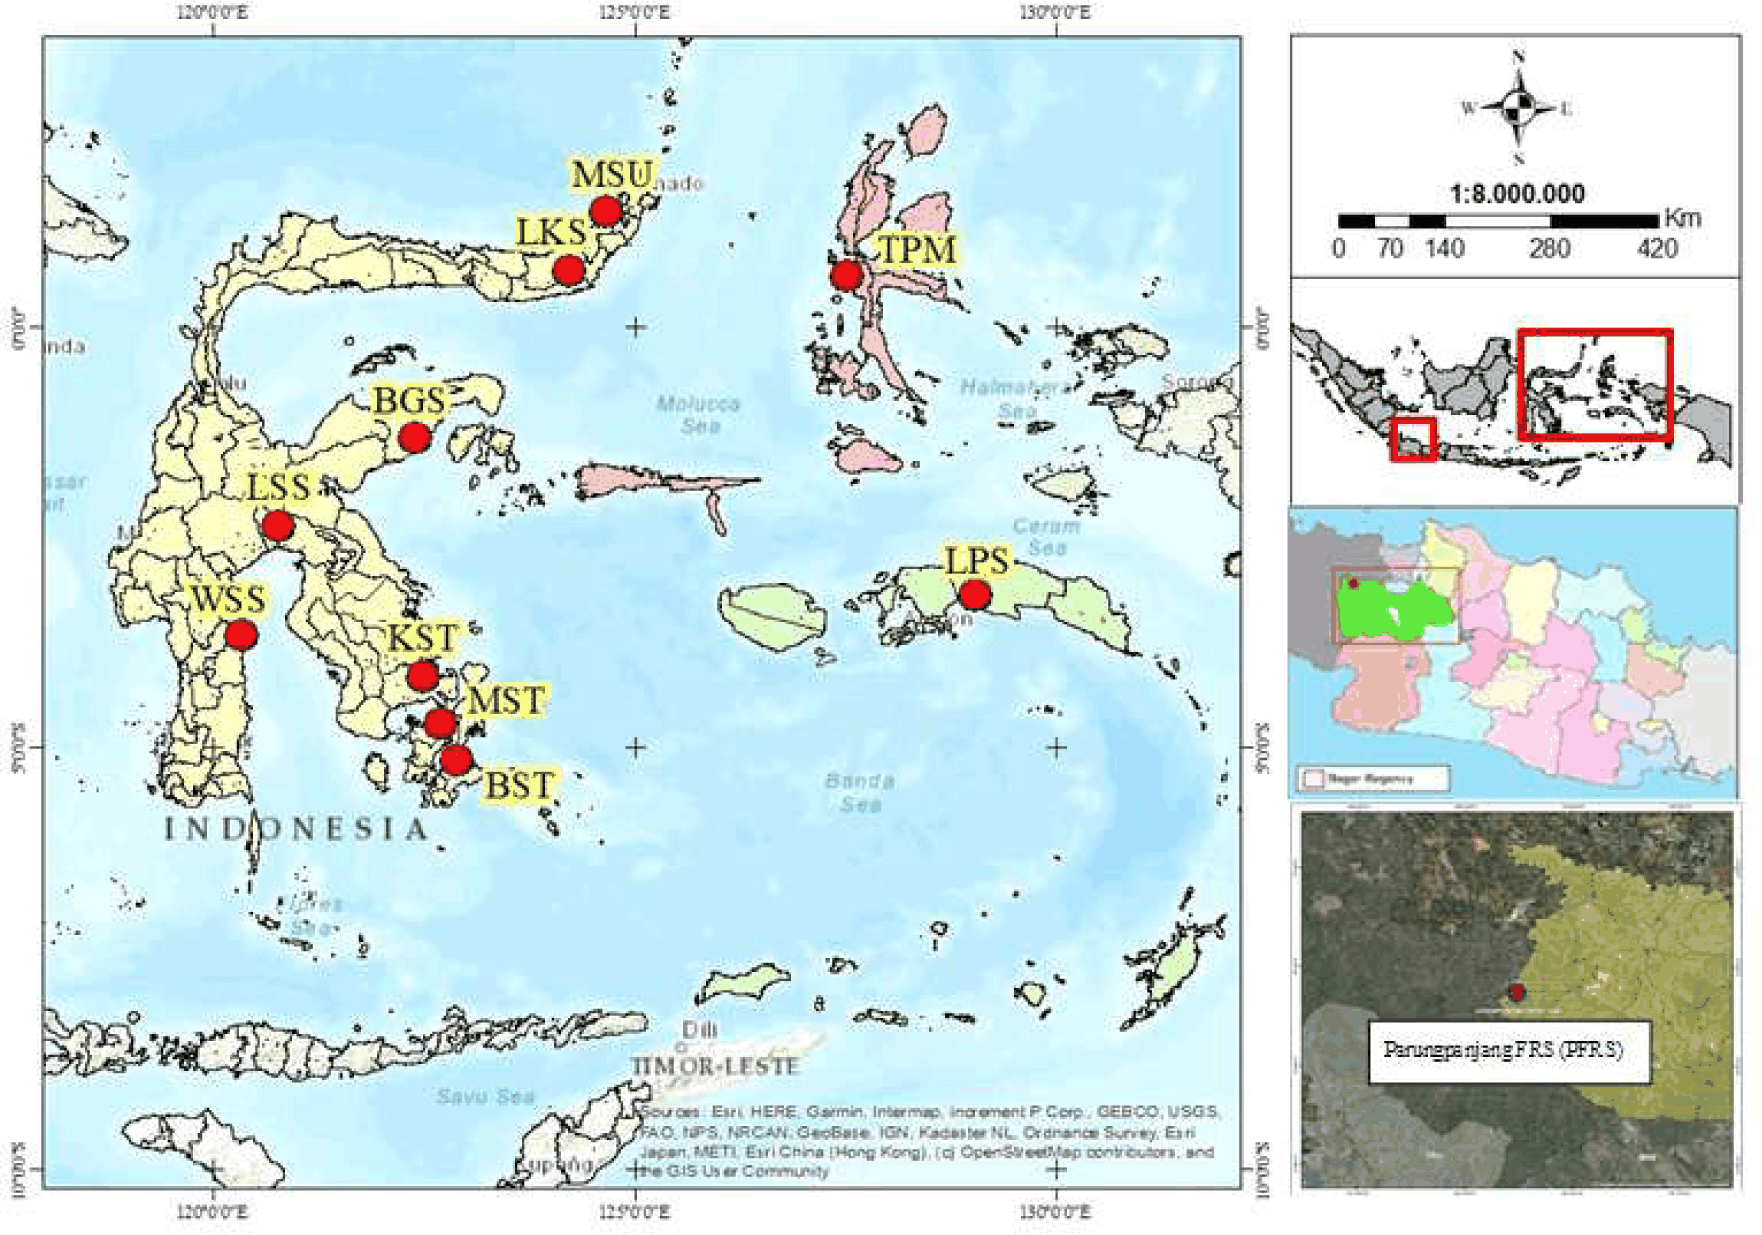
The N. macrophylla progeny tests were conducted at the Parungpanjang Forest Research Station in Bogor, West Java, Indonesia (06°23’09.226” S, 106°31’23.138” E), with an altitude of 52 m asl. The land cover of this location was previously classified as open, relatively flat, and overgrown with bushes dominated by Imperata cylindrica, Melastoma malabatricum, Acacia spp., and Schima wallichi coppices. The soil in this area is classified as marginal with relatively low nutrient content (C-organic 1.97%, N-total 0.22%, P 10.88 ppm, Ca 4.98 cmol(+) kg–1, Mg 3.47 cmol(+) kg–1, K 0.12 cmol(+) kg–1, cation exchange capacity 34.08 cmol(+) kg–1, base saturation 25.59%), soil pH 4.8, and soil texture dominated by clay (68.39%). The soil was a composite of sand (19.63%) and silt (11.98%).
Seedling preparation was carried out at the nursery of Nagrak Research Station, Bogor (06°6’74’’ S, 106°51’27’’ E, altitude 254 m asl). Seeds resulting from exploration were sown in germination boxes containing a mixture of sand, compost, and husk charcoal (5:3:1, v/v; Sudrajat et al., 2016). Normal seedlings that had grown a pair of leaves were transplanted into polybags measuring 10 cm × 15 cm and filled with a mixed medium of soil, compost, and rice husks (3:2:1 by volume). The seedlings were grown for 3 m under a shading net at 60% intensity and then moved to an open area for hardening for 1 m. Seedlings ready for planting were transported to the planting site while maintaining their family identities. The progeny test planting used a completely randomized block design with six blocks, each containing 72 families from 10 populations. Each family consists of four-row tree plots with a planting distance of 4 m × 4 m. At planting, 4 kg of basic fertilizer (manure compost) was added to each planting hole. Weed control was carried out every 6 m until the tree stand was 5 y old.
Growth and wood quality measurements were conducted on 6-y-old stands. The percentage tree survival was calculated by dividing the number of living trees by the number of seedlings planted in each block, as per the research design. Tree height measurements (in meters) were carried out for all individual trees using a Haga altimeter, and stem diameter measurements were carried out 1.30 m above ground level (diameter at breast height, in centimeters) using a diameter measuring tape. The tree volume (m3) was calculated using the following formula (Saputra et al., 2019):
where V is tree volume (m3), D is stem diameter at breast height (cm), T is tree height (m), and f is a form factor.
The wood qualities measured were pilodyn penetration, moisture content (MC), wood density, and specific gravity (SG). Pilodyn penetration was measured using Pilodyn (strength = 6 J, pin diameter = 2.5 mm) by measuring pin penetration at three points on the tree trunk horizontally at a distance of 120°, which was then averaged at a height of 1.30 above the ground surface (Anna et al., 2020; Chaerani et al., 2019).
Wood quality was assessed based on sample cores taken using an increment borer (Haglöf three -Thread Increment Borers; https://www.forestry-suppliers.com/p/63261/hagl%C3%B6f-8-replacement-bit-3-thread-0169-43mm). Small wood core samples with a diameter of 4.3 mm were taken to a depth approaching the pith at a tree height of 1.3 m from the ground surface to determine the wood MC, density, and SG (Anna et al., 2020;Sudrajat et al., 2021). The samples were then wrapped in plastic and aluminum foil and analyzed at the Forest Products Technology Laboratory of the Faculty of Forestry and Environment, IPB University. Fresh wood samples 2 cm in length (outer growth layers obtained from the core sample) were weighed using a digital balance to obtain the initial weight of the wood (Cown, 1982). The volume of the wood sample was measured using Archimedes’ principle, and the sample was then dried in an oven at 103 ± 2°C for 24 h. The dried samples were weighed to determine the dry weight. The physical properties tested were MC, wood density (ρ), and SG (ASTM, 2005; Kien et al., 2009). In general, the MC of wood is inversely proportional to wood density and SG (Hadi et al., 2022). The higher the MC of the wood, the lower the wood density and SG.
where FSW = fresh wood sample weight (g), WV = wood volume (cm3), ODW = oven-dry weight (g), ρ water = 1 g/cm3.
The data normality test was conducted using the Kolmogorov–Smirnov test (Hanusz and Tarasińska, 2015). The growth and wood quality data of N. macrophylla progeny test showed an abnormal distribution for tree height (D = 0.052473, p < 0.0100), diameter at breast height (D = 0.038166, p < 0.0100), tree volume (D = 0.111286, p < 0.0100), pilodyn penetration (D = 0.069043, p < 0.0100), MC (D = 0.102879, p < 0.0100), wood density (D = 0.067639, p < 0.0100), and SG (D = 0.118279, p < 0.0100). The normality of the data was improved through data transformation using the SQRT(x) function because the data distribution exhibited moderate positive skewness (Hatem et al., 2022).
Trait distributions were tested using the Kolmogorov–Smirnov test and positively-skewed traits were square-root transformed prior to analysis. The variance components were estimated using a mixed model (Johnson et al., 2001):
where: Yijk = observation of the phenotype of the individual tree, μ = general average value; Bi = random effect of the ith block; Fj = random effect of jth family; BFij = interaction effect between the ith block and the jth family; Eijk = error (random effect of the kth individual of the jth family in the ith block); i = 1, …, r (r = number of blocks); j = 1, …., f (f = number of families), k = 1, …., f (f = number of trees per family).
Analysis of variance was conducted to determine the effects of family and block factors on the growth and wood quality of N. macrophylla using the GLM procedure in SAS for Windows, version 9.0 (SAS Institute, Cary, NC, USA). The value of the family variance (σ2f), the block variance (σ2r), as well as the error variance (σ2e) components were obtained from the results of the PROC VARCOMP analysis using SAS for Windows version 9.0. Family (h2f) and individual heritability (h2i) were calculated based on variance components (Falconer and Mackay, 1996), which were calculated using Equations (6) and (7):
where σ2f, σ2fr, σ2e, n, r were the variance components of family, block-family interaction, error, number of trees per plot, and number of blocks, respectively. According to Robinson et al. (1951), heritability is categorized as low (0–0.3), moderate (0.3–0.6), and high (> 0.6).
The additive genetic variance coefficient (CVG) was calculated based on family variance using Equation (8) (Cornelius, 1994):
where X̅ = average of each parameter and σ2f = variance of family.
Phenotypic (Rp(xy)) and genetic (Rf(xy)) correlation were calculated from the variance components and their covariance (Falconer and Mackay, 1996), and were substituted into the standard formulae for the product-moment correlation coefficient:
where: x and y = compared parameters, σ2p(x) and σ2f(x) = phenotypic and genetic variance components for character x, σ2p(y) and σ2f(y)= phenotypic and genetic variance components for character y, COVP(xy) dan COVf(x,y) = phenotypic and genetic covariance components between characters x and y. To obtain the magnitude of the covariance components of two characters, x and y, Equations (11) and (12) were used (O’Neill et al., 2001):
where: = variance component for characters x and = variance component for character x, = variance component for character y.
The genetic gain (GG, %) was predicted using Equation (13) (Diao et al., 2016; Falconer and Mackay, 1996):
where: i = intensity of individual selection within the family and family selection referring to Zobel and Talbert (1984) using 25% selected individuals (selection intensity of 75%) within family and intensity for family selection of 10%, 20%, 30%, 40%, 50%, and 60%; h2 = heritability; σp = phenotypic variance; x̅ = average of each parameter. The realized gain consisted of four categories: low if GG = 0%–3.30%, medium if GG = 3.31%–6.60%, high if GG = 6.61%–10.00%, and very high if GG > 10% (Singh and Chaudhary, 1987).
The selection simulation was conducted with a 25% selection rate for individual trees within a family using a four-line tree plot planting design with the goal of retaining one best individual per family in each block. The family selection simulations used selection intensities of 10% (64 families selected), 20% (58 families selected), 30% (50 families selected), 40% (43 families selected), 50% (36 families selected), and 60% (29 families selected). The optimal strategy was chosen based on relatively high growth increases while maintaining wood quality.
3. RESULTS and DISCUSSION
The progeny test of N. macrophylla in this study showed that tree survival at 6 y of age was not influenced by family (p = 0.655). Family 65 from Layeni, Seram Island, had the lowest tree survival rate (30%). In contrast, the family with the highest tree survival rate was family 72, which was also from Layeni on Seram Island (75%). The growth and wood quality of the progeny were quite diverse. The coefficient of variation was dominated by growth traits obtained from tree volume (39.67%), followed by stem diameter (16.16%), and tree height (12.32%). The lowest coefficients of variation were observed for pilodyn penetration (3.91%) and wood density (6.44%; Table 2).
Analysis of variance based on a linear model indicated that the family had an effect on several key traits, including tree height (p = 0.0003), stem diameter (p = 0.0339), tree volume (p = 0.0241), wood MC (p = 0.0055), and wood density (p = 0.0477). Family effects were not significant for pilodyn penetration (p = 0.2649) or wood SG (p = 0.0765).
The interaction between block and family influenced the growth and wood quality parameters, except for wood density (p = 0.0560) and wood SG (p = 0.1199), which were unaffected by the interaction between block and family (Table 3). In this study, although the trial blocks were uniformly set up by selecting flat, uniform test locations, in practice, the soil and environmental characteristics (tree density) differed slightly between the planting blocks (Anna et al., 2020; Chaerani et al., 2019). This condition caused blocks and their interactions with families to affect growth parameters and wood quality. Differences in blocks affect nutrient availability and plant physiological processes, which, in turn, influence wood growth and quality (wood density and SG).
Family differences affected tree height, stem diameter, tree volume, wood MC, and wood density, but did not affect pilodyn penetration or wood-SG (Table 3). Family effects on growth and wood quality traits have been reported in Picea jezoensis (Tanabe et al., 2014), Neolamarckia cadamba (Anna et al., 2020; Chaerani et al., 2019; Que et al., 2021), Swietenia macrophylla (Sudrajat et al., 2021), Ficus variegata (Haryjanto et al., 2024), and Cupressus sempervirens (Özbey et al., 2024). These influences demonstrate the contributions of genetic and environmental factors and their interactions to wood growth and quality (Fadwati et al., 2023; Özbey et al., 2024). Wood has different cell compositions; therefore, its characteristics vary among tree species, and even within the same species (Park et al., 2024).
The variance component analysis of growth and wood quality traits in the N. macrophylla progeny test at 6 y of age indicated that the contribution of family to total variation was relatively low, from 0.50% for tree height to 2.97% for wood-SG. The interaction between the block and family accounted for a substantially higher proportion of variation in several traits, with the highest variance; tree height (17.70%), wood MC (15.10%), and stem diameter (14.13%). The lowest interaction effects were observed for wood SG (2.97%) and wood density (6.67%; Table 4).
The contribution of family to total variation was lower than that of the block variation, interaction of block and family, and the error component. This has been observed in previous studies on N. cadamba (Sudrajat et al., 2016) and F. variegata (Haryjanto et al., 2024). Environmental heterogeneity and genotype × environment (G × E) interactions contribute substantially to phenotypic variation, as demonstrated in Pinus sylvestris, where environmental factors account for up to 31% of the variation in stem diameter and 20% of the variation in tree height (Chmura et al., 2021).
As an endemic tree with a relatively narrow natural distribution, N. macrophylla is estimated to have lower genetic diversity than its widely-distributed congener, N. cadamba. Naturally, N. macrophylla is found only in Sulawesi and Maluku (Cahyono et al., 2015; Shi et al., 2020). Several studies on the genetic variation in N. macrophylla using molecular markers have shown that this species exhibits low to moderate population-level genetic diversity. According to Larekeng et al. (2018), N. macrophylla shows moderate genetic variation, whereas Arif et al. (2019) reported relatively low genetic variation. Long-standing cultivation in certain regions, particularly Sulawesi, may have facilitated gene flow between provenances (Halawane et al., 2011), potentially increasing intrafamilial variation.
Low genetic diversity appears to have affected the differences in growth, height, and diameter of N.macrophylla, which were greater between families than between populations. Soltis and Soltis (1991) also reported lower diversity among populations of endemic species than among populations of widely-distributed species. Lowe et al. (2018) supported this claim by stating that species with a wide natural distribution generally have a higher diversity than species with a limited distribution. Widely-distributed species can maintain a larger effective population size, thereby reducing the influence of genetic drift on genetic diversity (Sudrajat, 2016; White et al., 2007). Despite its limited distribution, N. macrophylla presented a relatively high family level variation in growth traits. The CVG were classified as high to moderate for wood MC (33.74%), stem diameter (32.96%), tree height (14.01%), pilodyn penetration (8.46%), and tree volume (6.59%; Milligan et al., 2003).
Family heritability was greater than individual heritability (Table 4). Family heritability was 0.06 (tree height) to 0.41 (wood SG), whereas individual heritability was 0.02 (tree height and wood MC) to 0.13 (wood SG). The highest coefficient of genetic variation was observed for wood MC (33.74%), followed by stem diameter (32.96%), and tree height (14.01%).
Family heritability estimates (h²f) were 0.06 (height) to 0.41 (SG), whereas individual heritabilities (h²i) were low (0.02–0.13). Because several variance components were small relative to the residual variance, this study reported 95% confidence intervals for each heritability [for example, h²f (height) = 0.06], indicating limited precision for the early age selection of some traits. The CVG were high for MC and DBH, but the combination of low h²i and substantial block × family interactions suggests caution when implementing individual selection at 6 y of age (Cornelius, 1994; Robinson et al., 1951). The lowest CVG were observed for wood density (1.87%) and SG (3.52%; Table 4).
Heritability estimates indicated that family heritability was consistently higher than individual heritability across all measured traits. Family heritability was 0.06 for tree height to 0.41 for wood SG; individual heritability values were lower, from 0.02 for tree height and wood MC to 0.13 for wood SG. Heritability is categorized as low (0–0.3), moderate (0.3–0.6), or high (> 0.6; Fernandes et al., 2022; Robinson et al., 1951), so in the current study, the heritability value was categorized as low to moderate. The highest CVG was observed for wood MC (33.74%), followed by stem diameter (32.96%) and tree height (14.01%), whereas wood density (1.87%) and SG (3.52%) had the lowest CVG (Table 4).
Family heritability was higher than individual heritability. Several studies in other species reported similar findings, where family values were higher than individual heritability values, such as in Araucaria angustifolia (Sebbenn et al., 2003), Pinus brutia (Gülcü and Çelik, 2009), N. cadamba (Anna et al., 2020; Chaerani et al., 2019), Bursaphelenchus xylophilus (Menéndez-Gutiérrez et al., 2021), and F. variegata (Haryjanto et al., 2024). In the current study, family heritability was 0.06–0.41, whereas individual heritability was 0.02–0.13. High heritability values indicate that the additive genetic influence is relatively high for a trait or character and vice versa (Santos et al., 2021; Zhang et al., 2024). High heritability values indicate that selective breeding is promising for obtaining greater genetic gains (Haryjanto et al., 2024).
Phenotypic correlation analysis indicated strong positive associations between growth traits. The tree height was highly correlated with stem diameter (0.830) and tree volume (0.871). Stem diameter was also strongly correlated with tree volume (0.940), indicating a close relationship between these parameters. Genetic correlation analysis indicated similar patterns: tree height was positively correlated with stem diameter (0.502) and tree volume (0.563), whereas stem diameter was strongly correlated with tree volume (0.582). Generally, the growth traits were negatively correlated with wood density and SG (Table 5).
Tree height showed a relatively strong negative genetic correlation with wood density (–0.461) and a moderate negative genetic correlation with SG (–0.233). All growth trait correlations with wood density and SG were negative, suggesting an inverse association between growth rate and wood compactness. The effects of growth rate on various wood properties have been intensively studied across several tree species (Fujimoto et al., 2024). However, these results have not been consistent across species, individuals, or wood properties (Fujimoto and Koga, 2010; Kimura and Fujimoto, 2014). In these studies, growth was generally negatively correlated with wood properties (e.g., density and SG). The same finding was also reported by Anna et al. (2020) and Chaerani et al. (2019) for N. cadamba and Sudrajat et al. (2021) in S. macrophylla. Fast-growing trees usually have more earlywood and less latewood than do slow-growing trees (Anna et al., 2020; Mäkinen et al., 2002; Wang et al., 2002). This composition results in low moduli of rupture and elasticity and density (Anna et al., 2020; Clark et al., 2006). Pilodyn penetration demonstrated strong genetic correlations with several traits, including stem diameter (0.464), tree volume (0.647), and wood MC (0.595), as well as a negative correlation with wood density (–0.507). The resulting pilodyn value is based on the depth to which the pilodyn needle penetrates the wood layer, with a greater depth indicating a lower wood density (Anna et al., 2020; Chen et al., 2015; Cown, 1982). In the present study, pilodyn penetration values were negatively correlated with wood quality (wood density and SG) and positively correlated with tree diameter (faster-growing trees were likely to have deeper pilodyn penetration and lower wood quality) and MC. Fast-growing individuals (large diameter) generally contain more earlywood with a higher MC (Mäkinen et al., 2002; Wang et al., 2002), making them more easily penetrated by pilodyn needles. These results highlight the genetic relationships between growth and wood quality traits in N. macrophylla progeny at 6 y of age (Table 5).
Correlations between characters or traits can indicate which characters are the most important or most strongly correlated with others. They can therefore be used as the main characters in the selection. In the present study, phenotypic and genetic correlations among the growth traits (tree height, stem diameter, and volume) of N. macrophylla trees showed a positive (strong) correlation. Strong correlations between growth parameters (height and stem diameter) have also been reported for the same species by Dharmawati et al. (2024). This indicates that growth traits are controlled by the same genes (pleiotropic genes) or inherited simultaneously (genetic linkage), as reported by Longui et al. (2024), who found positive genetic correlations between height and wood density in Balfourodendron riedelianum.
The positive correlation between growth traits and the negative correlation between growth and wood quality traits have been widely reported in tree species, such as Enterolobium contortisiliquum (Sant’ana et al., 2013), Acacia mangium (Nurhasybi and Sudrajat, 2019), Dipteryx alata (Santos et al., 2021), and F. variegata (Haryjanto et al., 2024). The wood quality trait that was most genetically-related to growth traits was pilodyn penetration. Pilodyn penetration shows a strong genetic correlation with wood MC and density, making it a useful indicator for selecting wood quality traits.
Different correlation patterns were observed among the tree growth traits, with growth traits being genetically negatively correlated with wood density and SG. This leads to selection based on wood density, resulting in a negative increase in tree volume (Hong et al., 2014). Therefore, Missanjo and Matsumura (2017) recommended selecting a multi-trait index that included growth characteristics and wood quality. Anatomical studies have shown that N. cadamba trees with larger stem diameters tend to have lower proportions of fiber parenchyma and thinner cell walls (Pertiwi et al., 2018), although this does not always translate into inferior wood properties (Pertiwi et al., 2018). Hence, it is possible to obtain better wood properties from trees with larger diameters. Pang et al. (2015) reported that wood formation (xylogenesis and lignin biosynthesis) in N. cadamba was controlled by several key genes, enabling genetic improvement of wood quality through targeted breeding (focusing on plant-trait prioritization).
Based on the genetic correlation estimates presented in Table 5, stem diameter and pilodyn penetration were selected to simulate genetic gain. Stem diameter is strongly genetically correlated with other growth parameters, such as tree height and volume. Stem diameter is also correlated with wood properties, such as pilodyn penetration and MC. The relatively easy and highly accurate measurement makes stem diameter readily applicable as a selection parameter in the field. Similarly, pilodyn penetration was strongly genetically correlated with wood density and MC. Pilodyn penetration is a practical, fast, and nondestructive method because it does not require laboratory testing (Chen et al., 2015; Cown, 1982), making selection based on wood quality more efficient.
Two selection stages were simulated, i.e., individual within-family and family selection. Using the individual within-family selection approach (selection intensity of 75%), the predicted genetic gains were 6.23% for stem diameter and 1.26% for pilodyn penetration. A family selection intensity of 40% (retaining the top 43 families) yielded optimal genetic gains for growth and wood traits, with the genetic gain for stem diameter categorized as very high (14.51%) and low for pilodyn penetration (3.59%). This low pilodyn penetration indicated that wood density and SG did not decrease substantially due to the selection for stem diameter (a growth trait). At a 40% selection intensity, the genetic increase in pilodyn penetration was low; therefore, the decrease in wood density and SG due to this selection would be less substantial. In other words, growth increased without substantially reducing wood quality (Table 6). These results suggest that family based selection offers greater potential for improving the growth and wood-quality traits of N. macrophylla at this stage of evaluation.
The selection criteria were more effective when several parameters (stem diameter, tree height, and pilodyn penetration) were used for multi-trait selection (combining more than one key trait, such as stem diameter and pilodyn penetration). Based on the heritability values, family selection is expected to provide greater genetic gains than individual selection within a family. Selection simulations were based on heritability values and selection intensity in individuals within a family using an intensity of 75% with one best individual per family per block. Family selection with an intensity of 40% (43 selected families) provided optimal results, particularly for stem diameter (growth trait) and pilodyn penetration (wood quality trait).
Selection strategies must balance improvement (genetic advantage) with genetic conservation (effective population size; de Araujo et al., 2021). A number of unrelated individuals (families) from 30–50 families will be sufficient to carry out a breeding program in several generations for one trait, as long as the breeding objectives do not change (Johnson et al., 2001). The requirements for certified seed sources in Indonesia stipulate that a minimum of 25 families should be maintained after thinning (BSN, 2019), with the effective population size calculated to ensure that genetic drift and inbreeding rates are less than 2% (ITTO, 2020).
4. CONCLUSIONS
The results of this 6-y progeny test of N. macrophylla indicated that the contribution of family variation to total phenotypic variance was relatively low compared to the effects of block, block × family interaction, and residual error. The family heritability estimates were consistently higher than the individual heritability estimates, suggesting that selection at the family level offered greater potential for genetic improvement than selection within families. This supports the use of family-based selection strategies in early breeding cycles. Selection based solely on wood quality traits, such as density and SG, was associated with negative genetic gains in growth traits, highlighting the trade-off between productivity and wood properties. Therefore, a multi-trait selection approach is recommended to balance growth performance and wood quality. Based on genetic correlation analysis, stem diameter and pilodyn penetration were identified as key traits for selection given their strong associations with both growth and wood density. A family selection intensity of 40% (retaining the top 43 families) yielded optimal genetic gains for growth and wood traits, with the genetic gain for stem diameter categorized as very high (14.51%) or low for pilodyn penetration (3.59%). This low pilodyn penetration indicated that wood density and SG did not decrease substantially due to selection for stem diameter (a growth trait). At a 40% selection intensity, the genetic increase in pilodyn penetration was low; therefore, the decrease in wood density and SG due to this selection would be less substantial; i.e., growth would increase without reducing wood quality considerably. The proposed selection strategy, which retained one superior individual per four-tree plot and selected the top 43 families, demonstrated promising genetic gains while maintaining sufficient genetic diversity. This approach effectively balances genetic superiority with the conservation of an effective population size, aligning with both breeding objectives and long-term sustainability goals.