


1. INTRODUCTION
With increasing global interest in resource sustainability, the industrial application of wood, a renewable and eco-friendly material, is expanding. Specifically, wood fiber, sourced from various species, is a key building block for materials including paper, fiberboard, bioplastics, and other high-value materials (Andianto et al., 2024; Gao et al., 2017; Ju and Roh, 2019, 2020; Khanjanzadeh and Park, 2020; Lee and Kim, 2020). Medium-Density Fiberboard (MDF), a representative product manufactured from wood fibers, has been the subject of numerous studies (Wibowo et al., 2021; Zyryanov et al., 2024). Its industrial importance is highlighted by its substantial production levels; for instance, > 1.2 million m3 was produced in South Korea in 2024 (Kim et al., 2025).
The initial moisture content (MC) of green wood fiber is significantly higher than its equilibrium MC (EMC; Kartikawati et al., 2024; Kurniasari et al., 2025). If fibers are used in products without pretreatment, the evaporation of moisture can lead to defects during the product’s service life (Magalhães et al., 2021). Therefore, a drying process is essential before wood fibers can be incorporated into products.
However, the drying process accounts for a large portion of the total energy consumption in wood fiber processing, representing a significant operational cost (Chen et al., 2017; Lee et al., 2024; Sumardi et al., 2024). Consequently, identifying the optimal drying conditions to enhance energy efficiency has become a critical research objective (Amer et al., 2019; Fritzell et al., 2009; Melander and Rasmuson, 2010; Pang, 2000).
Although some studies have focused on the final properties of dried fibers, a detailed analysis of how the MC and energy efficiency change over short time periods during the drying process is required. Therefore, this study aims to contribute to the establishment of more eco-friendly drying strategies by analyzing the changes in MC over time and energy efficiency when drying wood fiber using a fluidized bed dryer, which is designed to operate on a mechanism similar to that used in industrial settings.
2. MATERIALS and METHODS
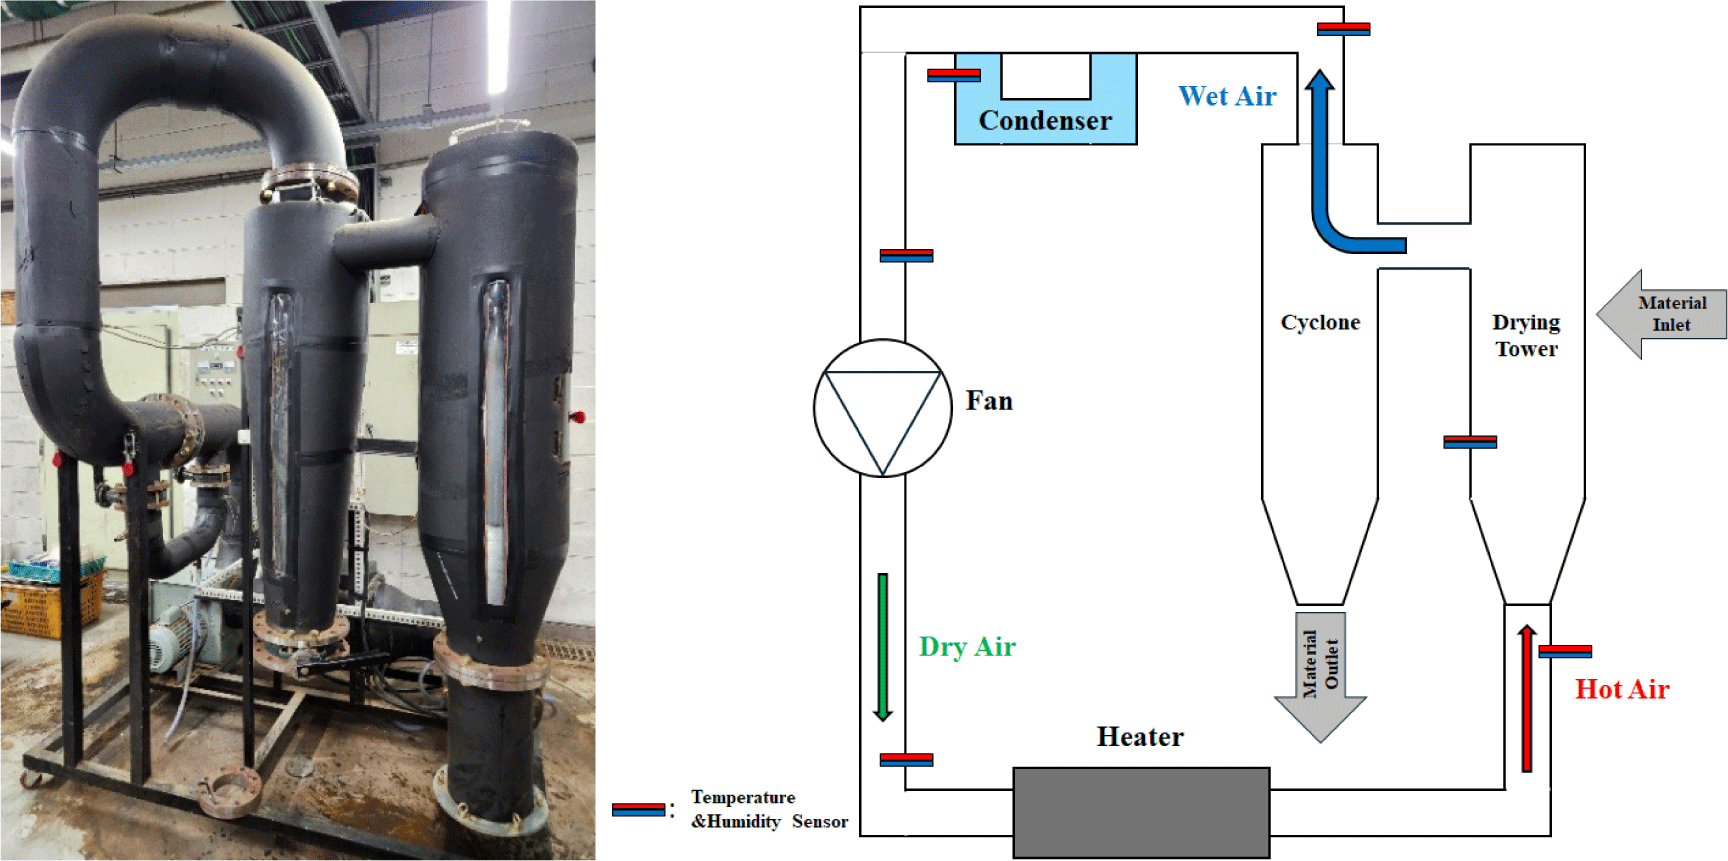
A lab-scale fluidized bed dryer (Fig. 1) was used for all the drying experiments. The system included a heating unit to supply hot air, a vertical drying tower where fluidized drying occurred, a cyclone separator to retrieve dried fibers from the airstream, and a fan to control the airflow (Park et al., 2016). The temperature and relative humidity (RH) of the inlet air were controlled and monitored throughout the process. The air velocity in the drying tower was approximately 10 m/s.
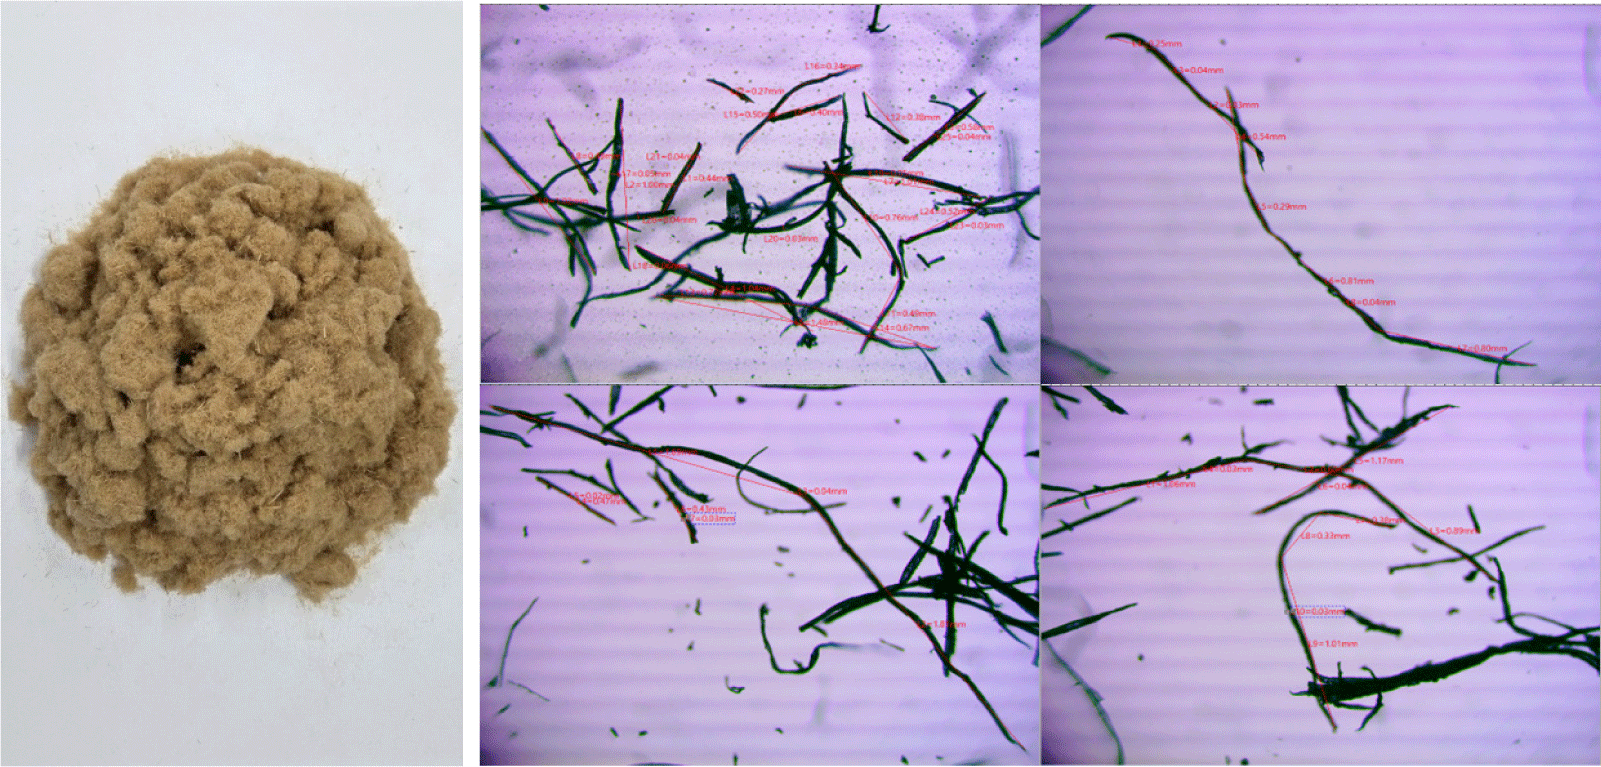
The wood fiber used in this study, intended for MDF manufacturing, was provided by UNID btplus (Seoul, Korea). The wood species used to manufacture the fiberboards were mixed. Coniferous species such as pitch pine (Pinus rigida) and Korean pine (Pinus koraiensis) accounted for > 50% of the total mix, whereas broadleaf mixed wood such as oak accounted for approximately one-third, with other lumber byproducts making up the remainder. The morphological and physical properties of the fibers were measured and investigated before the experiments. An epifluorescence microscope (Model wm0015000a, Bimeince) coupled with a digital camera (Model MU1003, AmScope, Irvine, CA, USA) was used to measure morphological properties. Table 1 presents the results of the study. Samples were collected from various locations and images were captured using a microscope (Fig. 2). The lengths and widths of the specimens were measured using image capture software for the digital camera.
| Attributes | Length (mm) | Radius (mm) |
|---|---|---|
| Average | 1.368 | 0.020 |
| SD | 0.740 | 0.013 |
For each experiment, 50 g of wood fibers were prepared. The fibers were first completely dried in a convection oven at 103 ± 2°C until a constant weight was achieved. Subsequently, the oven-dried fibers were uniformly wetted to a target initial MC of 150% using a spray and mixed evenly. This was accomplished by spraying a predetermined amount of distilled water while continuously mixing the fibers with rotating blades to ensure homogeneous moisture distribution. During moisture reabsorption, the environment around the fiber was under ambient temperature and atmospheric pressure, with an air temperature and RH of approximately 20°C and 50%, respectively. The wetted fibers were sealed and stored for 24 h to ensure moisture absorption throughout the material.
The drying experiments were conducted at 80°C, 90°C, 100°C, 120°C, and 150°C and for 30, 60, 90, 120, 150, and 180 s.
The thermal efficiency of the drying process was calculated as the ratio of the theoretical energy required for drying to the actual electrical energy consumed by the dryer system, as shown in Equation (1).
Where: Eactual = actual energy consumed; Etheoretical = energy required theoretically.
Eactual was directly measured using a watthour meter installed on the dryer. Etheoretical, which includes the energy required to heat the wood fiber, heat the residual moisture, and evaporate the removed water, was calculated based on the formulae in Table 2 (Jung et al., 2008).
To establish a theoretical baseline for the drying process, the drying behavior of a single isolated wood fiber was modeled using a custom-built simulation program based on the Delphi programming language and the finite difference method (Fig. 3). The key input parameters for the simulation included the average fiber dimensions (length and radius) measured previously, psychrometric conditions of the drying air (dry-bulb temperature and RH), air velocity (10 m/s), and specific gravity of the wood (0.5). The specific gravity value (0.5) is typical for these wood species and results from the combination of the cell wall substance (specific gravity ~1.5) and air-filled lumens. The simulation calculated the transient changes in MC and temperature within the fiber. The simulation program was validated only for drying temperatures ≤ 100°C. Equation (2) was used in the simulation as follows:
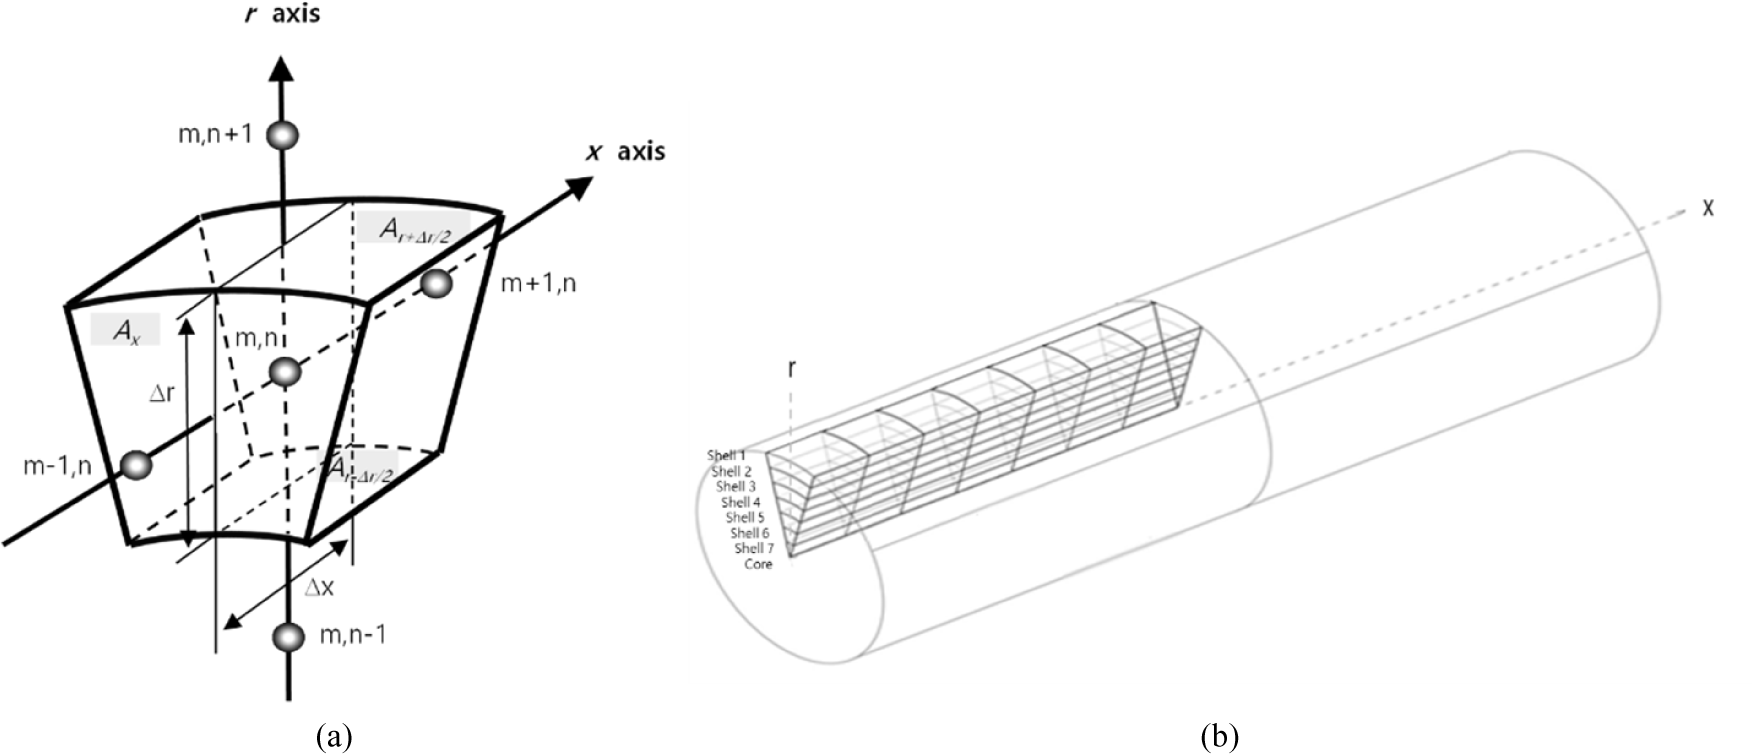
Where: Dx and Dr = diffusion coefficients in the x and r directions, respectively (m2/s); x, r = distance in the x and r directions of flow (m); Ax, Ar+△/2, Ar–△/2 = cross-sectional area perpendicular to the flow direction (m2); C = moisture concentration (kg/m3); τ = time (s); m, n = number representing locations in each direction; p = number representing pth time; p + 1 = (p + 1)th time.
The recovery rate was defined as the ratio of the mass of the fiber retrieved from the cyclone to the initial mass of the fiber input. For each experimental condition, an initial fiber mass of 50 g was used. The recovery rate was calculated using Equation (3).
Where: mrecovered = the mass of the fiber recovered from the cyclone (g); minitial = the initial mass of the fiber input (g).
3. RESULTS and DISCUSSION
The experimental drying process is characterized by two distinct phases (Fig. 4). The first was a rapid drying phase within the first 30 s, during which loosely bound surface water evaporated quickly. Subsequently, the process entered a slower plateau-like phase. As expected, higher drying temperatures led to a lower final MC owing to the increased driving force for moisture evaporation.
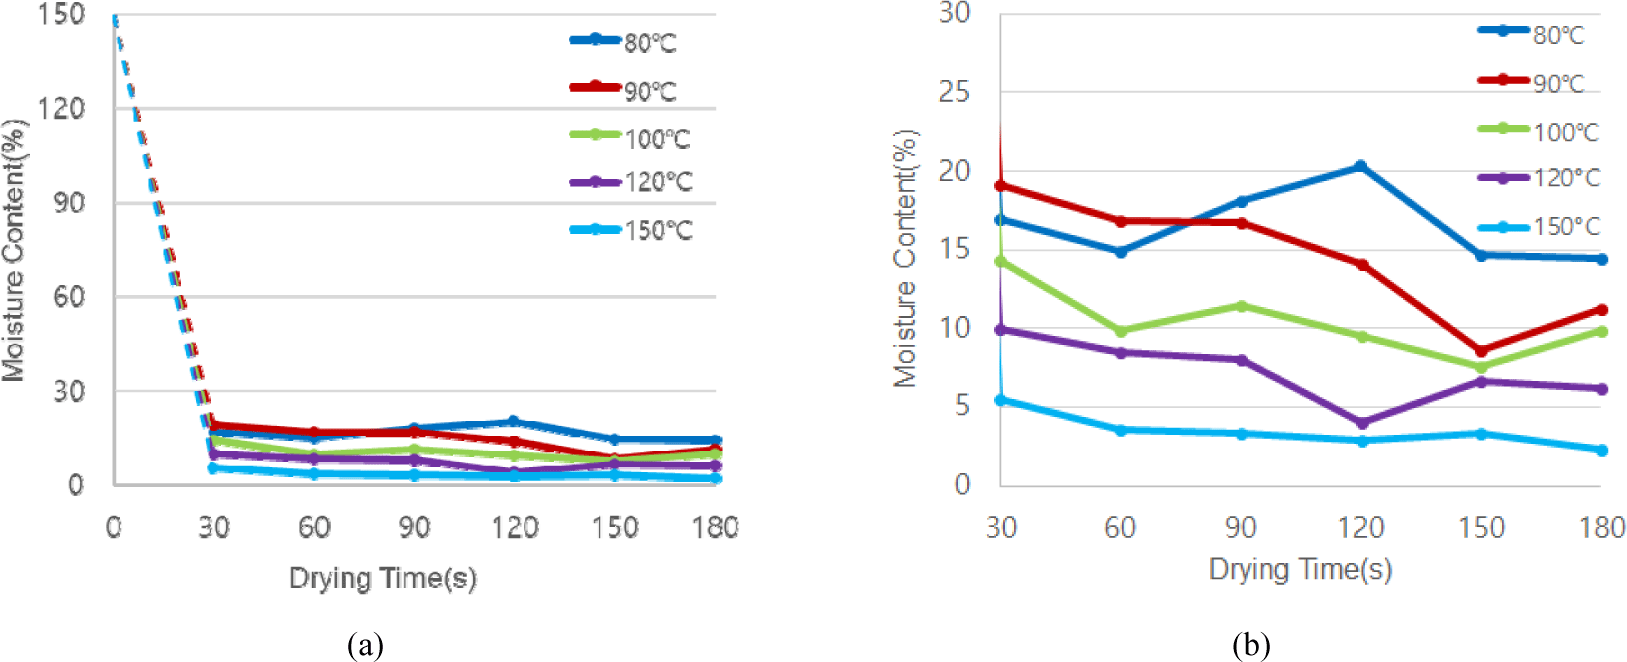
Notably, the MC did not steadily decrease over the 180-s period but fluctuated after the initial drop. This behavior is likely attributable to the non-theoretical fluidization of the wood fibers. As drying progresses, lighter, drier fibers are entrained in the airflow and collected in the cyclone, whereas heavier, wetter clumps may remain in the drying tower or circulate non-uniformly. Thus, the collected sample at each time point represents a snapshot of the portion of material that exited the system and not necessarily the average state of all materials inside. This causes variability in the later stages of drying. To achieve the target MC for industrial applications (e.g., < 10%), higher temperatures or improved management of the internal humidity and material flow are necessary.
The energy efficiency of the drying process exhibited a strong and consistent inverse relationship with drying time [Fig. 5(a)]. Fig. 5(b) shows the actual energy consumptions. The energy efficiency decreased as the drying time increased. This trend directly reflects the drying curve. Because most of the water removal occurs in the initial phase, any energy consumed beyond this point contributes negligibly to drying and is largely wasted, thereby reducing the overall efficiency.
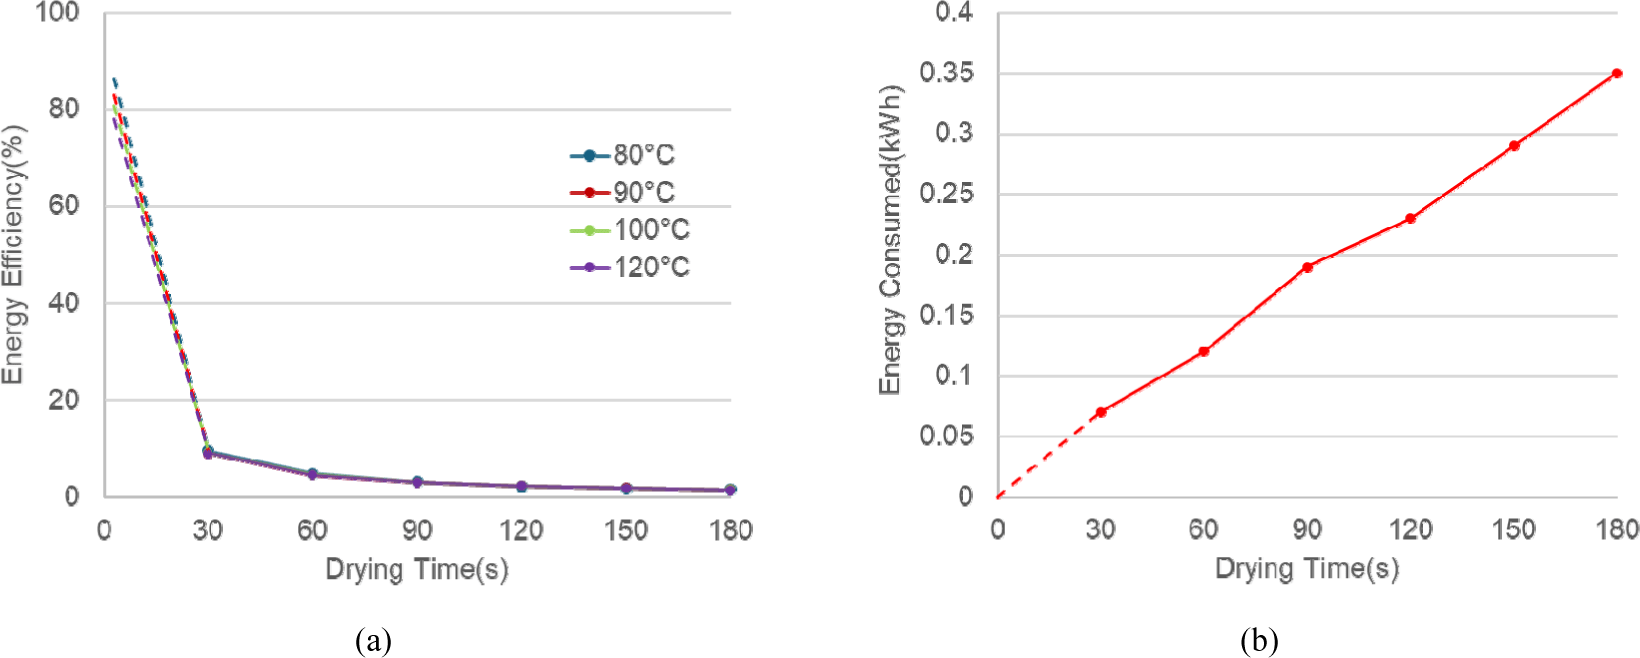
The drying temperature had a minimal impact on the energy efficiency trend in this experiment, with all the temperature curves following a nearly identical path. This finding suggests that for this process, optimizing (i.e., minimizing) the drying time is more critical than the drying temperature for improving the energy efficiency. The low efficiency values (< 10%) are characteristic of laboratory-scale experimental setups, where a significant fraction of energy is lost to the environment and used to heat the apparatus, a factor that is less pronounced in larger, continuous industrial dryers.
To establish a theoretical baseline for drying, the behavior of individual wood fibers was modeled.
The temperature inside the dryer was set arbitrarily and the humidity was not artificially controlled. The temperature and humidity at each location within the dryer were monitored in real time using six temperature and humidity sensors inside the dryer. The sensors were located near the heat source, dryer, cyclone, condenser, and in front of and behind the blower.
When the dryer was operated without any material, the temperature sensors demonstrated that the dryer temperature remained constant. The humidity ranged from a low RH of approximately 2% near the heat source to a high RH of approximately 40% near the condenser after the cyclone.
With materials, the dryer temperature remained constant. However, the humidity varied slightly depending on factors such as the initial MC of the materials.
For the simulation, the set temperature and high humidity within the dryer system were used as the parameters. Because the fibers initially had a high MC, their outer surfaces were exposed to saturated vapor pressure (100% RH) from the released water vapor, leading to drying. However, following complete removal of free water, drying occurred at a lower RH. Because measuring the actual RH on the fiber surface is difficult, a RH of 40% generated by the moisture released from the fibers was applied based on this assumption.
The simulation results are shown in Fig. 6(a–f). Each parameter in the legend denotes a specific physical region in the cylindrical model: shells 1 and 2 refer to the outer surface of the cylindrical single fiber exposed to ambient air and the layer immediately beneath the outer surface, respectively. Higher shell numbers indicate deeper layers, and mc_core refers to the inner center of the cylindrical fiber.
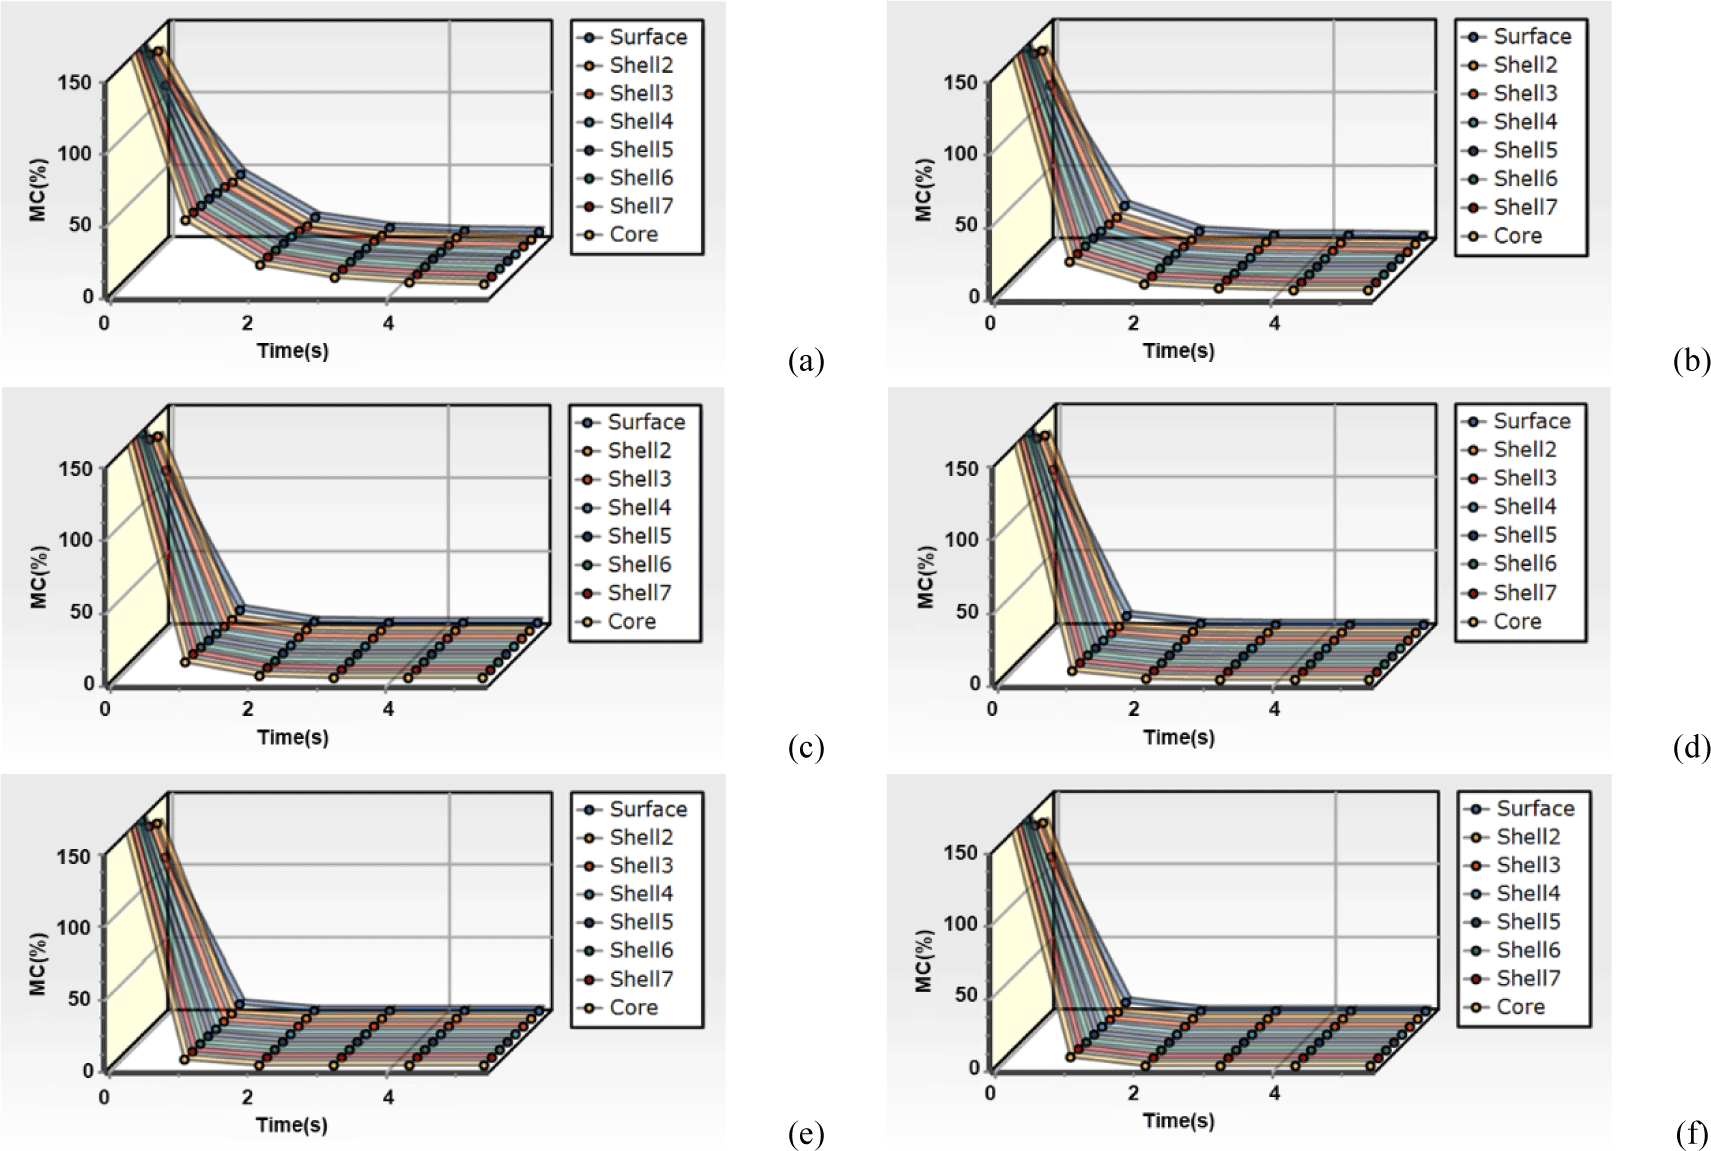
The simulation predicts extremely rapid drying. Under all simulated conditions (20°C, 40°C, 60°C, 80°C, 90°C, and 100°C at 40% RH), a single fiber with an initial MC of 150% was projected to reach its EMC within a few seconds. This rapid moisture removal is attributed to the high air velocity and large surface-area-to-volume ratio of individual fibers, which enable efficient heat and mass transfer when fully exposed to the drying medium. This result suggests that under optimal conditions, the residual time required for drying the wood fibers is minimal.
Actual measurement of the fiber drying phenomena and speed is difficult. Fig. 4 shows the average MC change across the fiber after it passes from the dryer to the cyclone, and not the MC change in the individual fibers. We simulated MC changes in individual fibers, which are challenging to measure directly.
The simulations indicated that drying proceeded approximately 10 times faster than the measured average MC. Such simulations are valuable for identifying the limits of drying speed and efficiency.
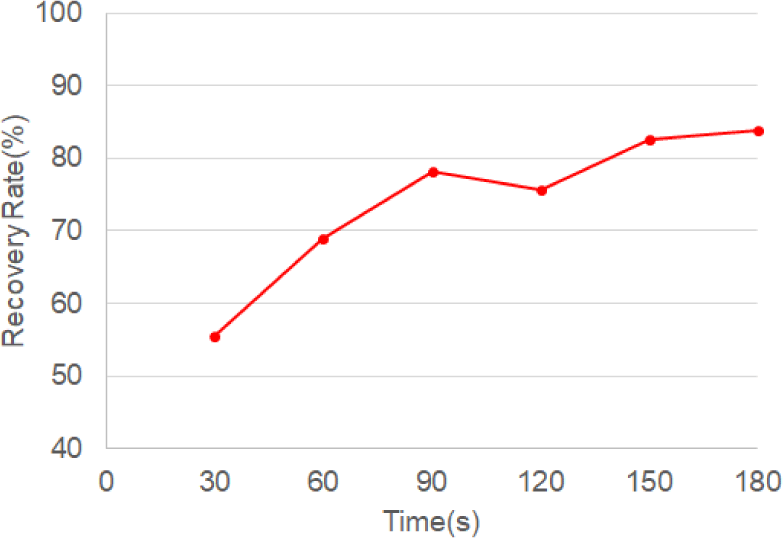
The incomplete recovery of the material from the cyclone is a critical factor influencing the experimental results. As shown in Fig. 7, the material recovery rate is significantly low, particularly at shorter drying times (approximately 55% at 30 s), and gradually increases with time to a maximum of approximately 85%. This indicates that a substantial portion of the wood fiber, between 15%–30%, remained within the drying tower.
Visual inspection confirmed that these residual materials were larger and heavier clumps of fibers too heavy to be fully fluidized and carried to the cyclone (Fig. 8).
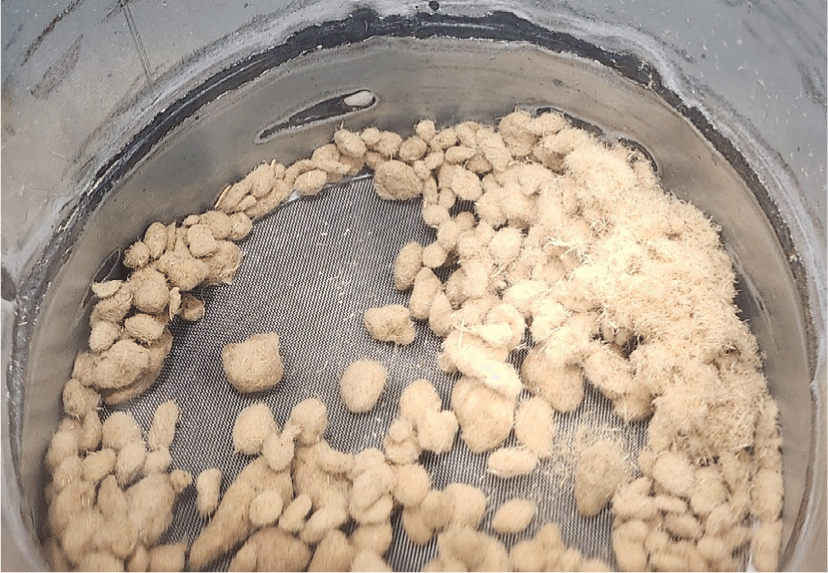
This phenomenon introduces systematic bias, in that the MC was measured only on the successfully recovered, and therefore, likely drier and lighter, fraction of the sample. The actual average MC of the sample in the dryer was likely higher than the measured values. This low and variable recovery rate introduces experimental error, accounting for fluctuation in MC at later stages and deviations from the ideal drying behavior predicted by the simulation. Future studies should enhance fluidization dynamics to minimize clumping and ensure more representative sample collection.
4. CONCLUSIONS
In this study, the changes in MC and energy efficiency during the drying of wood fibers in a fluidized bed dryer were investigated. The following conclusions were drawn.
Minimizing the drying time was the most critical factor for improving the energy efficiency of the process. Achieving the target MC for industrial applications requires drying at higher temperatures or thorough management of the material flow and ventilation to overcome practical limitations. However, fiber clumping has been identified as a major source of experimental error.
This study can be utilized to establish more sustainable and economical industrial drying plans for producing wood fiber-based products. These findings emphasize that future efforts should focus on optimizing the temperature and mechanical design of dryers to ensure uniform fluidization and minimize clumping. Thus, the significant gap between theoretical efficiency and practical performance can be reduced.