1. INTRODUCTION
Korean red pines (Pinus densiflora) have deep roots and can grow in dry soil through symbiotic relationship with mycorrhizal fungi (Bae et al., 2012). However, over the last two decades, the Korean red pines are facing increased threats by unsuitable weather, mainly warm and/or hot winter or summer in Korea (Kim et al., 2017) and their numbers have decreased significantly. For example, Kim et al. (2020) evaluated that about 9.5% of the Korean red pine forests in Sogwang-ri, where is famous for the Korean red pine in Korea, would die due to frequent unsuitable weather. Since 2014, it has been verified that dead red pines in the form of cluster were found. According to a report published by the National Institute of Forest Science (2009), the number of dead Korean red pines reached 97 million in the southeastern region (Gyeongsangnam-do) of Korea. Most stands of dead Korean red pine are located at high elevations or on ridges with high solar radiation and some of them have been succeeded by a subtype of Mongolian oak (Quercus mongolica) (Kim et al., 2017).
In general, tree growth is highly correlated with topographic and soil conditions, as well as climate such as temperature and precipitation (Schweingruber, 1988). The annual climatic variation plays an important role in determining the annual tree-ring widths (Fritts, 1976). Although, several researchers have studied the effect of climate on annual-ring growth of Korean red pine at some representative forests in Korea, such as at Mt. Songni-san (Park and Yadav, 1998), Worak-san (Seo et al., 2000), Seorak-san (Park and Seo, 2000; Park et al., 2001; Seo and Park, 2002), and Baekdudaegan area (Lee et al., 2008; Park et al., 2010), no systematic investigation for the Korean red pine in Sogwang-ri has been done to-date.
To monitor the mortality of Korean red pine in Korea, the National Geographic Information Institute of Korea conducted aerial photography bi-annually of the forest area of the country (Kim et al., 2017, 2020). In these studies, the death of the trees was determined based on the visual features such as leaf browning, defoliation, and chlorosis of the branch and stem. However, such approach lacks precision as it is different from the death year determined accurately from the annual-ring growth by cambial activity (Seo et al., 2007).
The present study aimed to date the death year of Korean red pines (P. densiflora) in Sogwang-ri, one of the largest habitats of pine in Korea, using dendrochronological methods, and investigate the effects of climatic factors on the death and/or growth decline of the pine trees. We believe that the results obtained from this study can serve as fundamental data which would act as a guide in the conservation of Korean red pines in the study area.
2. MATERIALS and METHODS
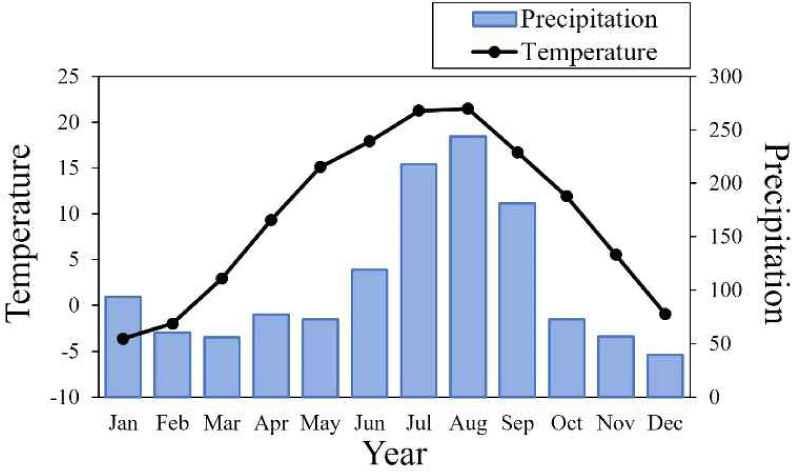
Three Korean red pine stands were selected in Sogwang-ri, Uljin-gun, Gyeongsangbuk-do, i.e. two of them in Jungmi-gol (Jungmi-gol A and B) and the other one in Neonam-gol (Fig. 1), where death occurred as colony. The elevations were between 650 and 800 meters above the sea level. The annual mean temperature for the last 39 years (1982–2020) was 9.6°C, and annual precipitation was 1,291 mm by the estimated data based on mountain meteorological observation (Fig. 2; Min et al., 2022). The warmest and coldest months were August (21.2°C) and January (–4.0°C), while the highest and lowest precipitation were in August (243 mm) and December (41 mm), respectively.
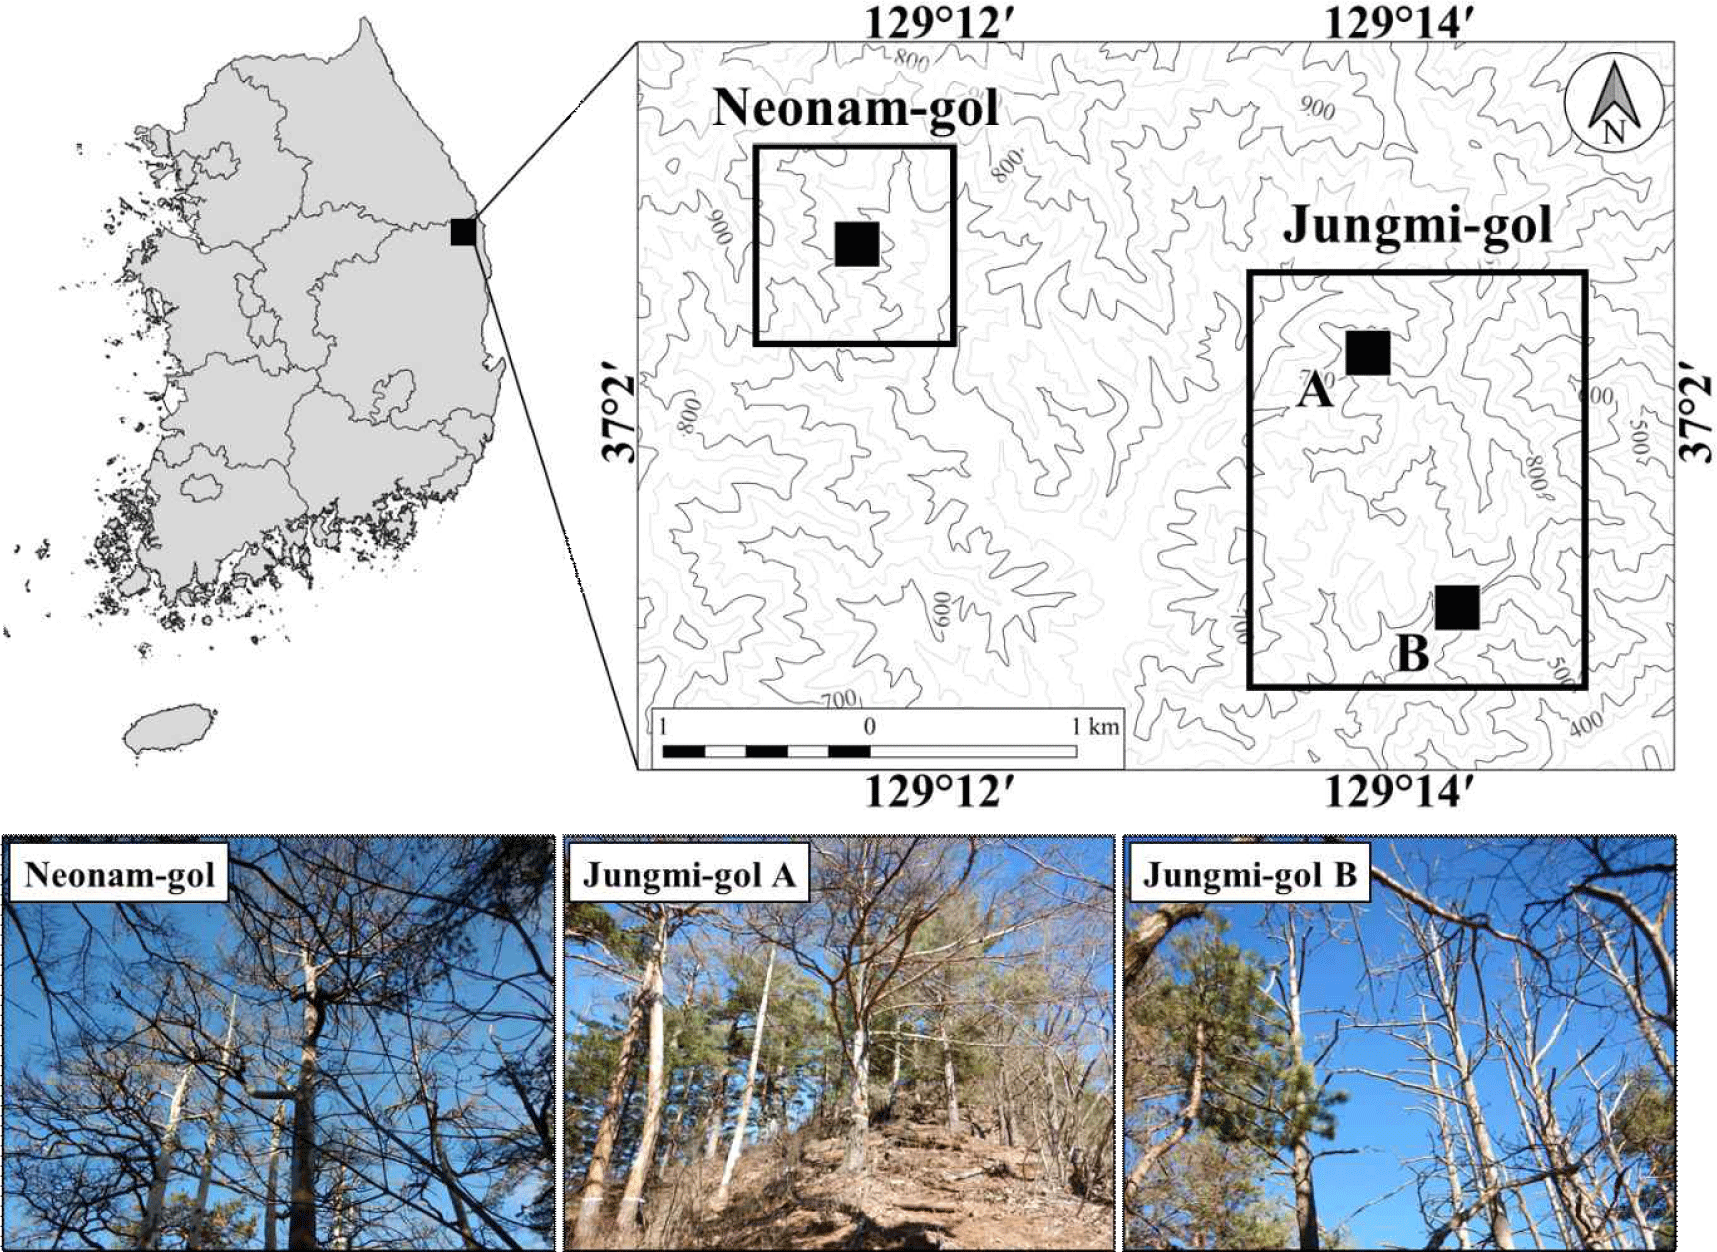
Tree-ring samples were extracted from 24 living and 27 dead red pines from the study sites (Fig. 1). Out of the 24 living trees, 11 were selected from Jungmi-gol and 13 from Neonam-gol to develop master chronology of the respective sites to date the death years of the dead trees at Jungmi-gol A and B, and Neonam-gol, respectively. The increment cores were extracted from the stems at breast height using an increment borer with Ø 5.15 mm for living trees and Ø 10.00 mm for dead trees. Since the stems of the dead trees were partially decayed, their increment cores were extracted using increment borer with Ø 10.00 mm for ring-width measurement.
The collected increment cores were mounted on wooden stick with their cells vertically aligned, and their cross-planes were sanded using a belt sander. The sanding was done with sandpaper in the sequence #80, #120, #360, and up to #600, so that the tree-ring boundaries become clearly visible. The tree-ring widths were measured using the WinDENDRO (Regent, Quebec, Canada) to the nearest 0.01 mm.
Cross-dating was done to date the exact year of each tree ring to build the site chronologies and date the year of death of the dead trees based on synchronization between the individual ring-width time series from the dead ones and the corresponding site chronologies. To verify the success of cross-dating, the t-value from Equation (1) and G value (%) from Equation (2) were run in the TSAP-Win program (Rinntech, Heidelberg, Germany). The t-value was calculated based on the correlation coefficients between the individual time series and the number of overlapped years, while the G value was calculated as percentage of the synchronized pattern between the time series compared in the overlapping years (Baillie and Pilcher, 1973; Eckstein and Bauch, 1969; Wigley et al., 1984). In general, if t- and G values are ≥ 3.5 and 65%, respectively, when tree-ring time series are overlapped 100 years or more, the cross-dating is considered successful (Kim and Park, 2005).
Where Si is the i-th annual-ring width of a sample tree, S is the mean annual-ring width of a sample tree, Ri is the i-th annual-ring width of the reference tree, R is the mean annual-ring width of a reference tree and n is the number of overlapped years.
If, (xi+1 – xi) > 0, Gix = +1/2, (yi+1 – yi) > 0, Giy = +1/2,
(xi+1 – x) = 0, Gix = 0, (yi+1 – yi) = 0, Giy = 0,
(xi+1 – x) < 0, Gix = –1/2, (yi+1 – yi) < 0, Giy = –1/2,
Where G(x,y) is the G value and xi and yi are the measured ring-width values for the i-th year.
The death year was determined from the youngest tree ring dated through cross-dating between the individual ring-width time series of dead trees and the corresponding site chronology, whereas the season was determined by the development condition of the last formed wood cell in the outmost tree ring. The earlywood formation in Korean red pine occurs from spring to early summer and the latewood from late summer to autumn (Lee, 1997; Park et al., 2015). Therefore, if the outmost tree ring has only earlywood, the death season was inferred as between spring and summer, if it has incomplete latewood, between summer and autumn, and if the latewood formation is complete, the death season was between the autumn of the current year and spring of the following year (Fig. 3).

The effects of strong natural events, such as mechanical injury, destruction of the foliage, land movement, thinning, or typhoons on the tree growth can be evaluated from abrupt growth reduction (Schweingruber, 1988). The abrupt growth reduction is actually a marked decrease in the tree-ring width for three consecutive years or more and categorized into three classes depending upon the extent of such decrease. Ring width reduced by 40%–55% is class I, 56%–70% is class II, and more than 70% is class III.
Standardization is the process to remove biological trends such as aging and/or stand dynamics from the measured ring-width time series according to the Equation (3).
It: relative ring-width index at t year, Wt: measured ring width at t year, Yt: predicted ring width at t year.
In the present study, double detrending method was applied to ring-width time series from the living trees in Jungmi-gol and Neonam-gol using the ARSTAN program (Cook and Holmes, 1984) to establish the site index chronologies. In this method, a negative exponential curve was applied in the first step to remove the growth trend determined by ageing; in the second step, a smoothing spline (50% response period: 60 years) was applied to remove the trend by stand dynamics (Blasing et al., 1983; Cook and Peter, 1981). After standardization, autocorrelation was removed to create a residual index chronology.
To investigate the influence of climatic parameters, viz. monthly mean temperature, total precipitation, and drought stress index (DSI), on the experimental trees, correlation analyses were done using the DendroClim 2002 for the last 39 years between 1982–2020 (Biondi and Waikul, 2004). In this analysis, the adjusted monthly mean temperature and total precipitation were used which were calculated using the model of inverse distance weighted interpolation (Min et al., 2022). The model calculates the values considering the distance between the site and meteorological stations, and the site elevation and slope. DSI was calculated using the Equation (4) (Cho et al., 2020). The weighted values (α and β) were set to 1, and the HI and SPI were the average values calculated using the growing degree days and monthly precipitation, respectively, over the previous 3 months (n).
HI (heat index): deviations among growing degree days per month, SPI (standardized precipitation index): deviations among monthly precipitation, α, β: weighted values contributing the deviations of temperature and precipitation, n: the number of previous months used to calculate HI and SPI.
3. RESULTS and DISCUSSION
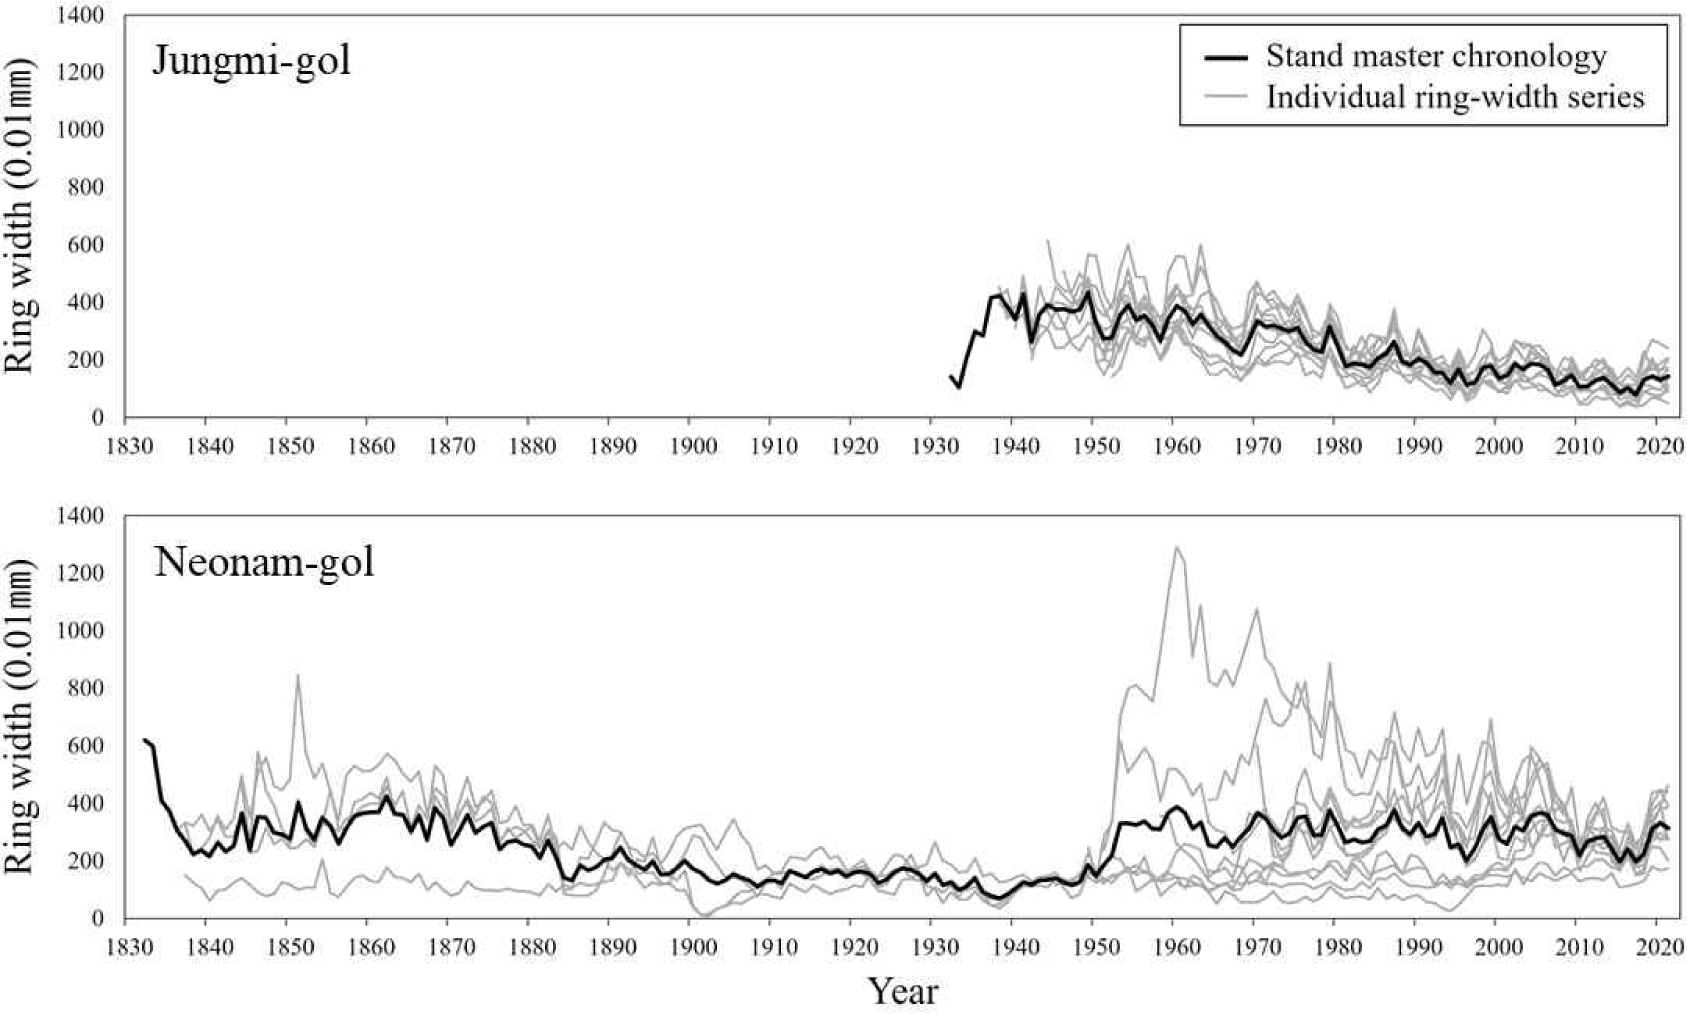
All the ring-width time series from the living trees at Jungmi-gol were successfully cross-dated. However, 2 out of 13 time series at Neonam-gol could not be cross-dated well with the others. Therefore, the stand chronology of Jungmi-gol was established using all the ring-width time series (SJMPDL-M), whereas the stand chronology of Neonam-gol was set using 11 ring-width time series (SNNPDL-M; Fig. 4). To verify the confidence of the cross-dating, synchronization test with t-value and G value were applied. According to the t-value and G value between the individual time series and corresponding site chronologies at Jungmi-gol, the mean (range from the lowest to the highest values) t-value and G value were 19.3 (10.5–31.3) and 78.2 (72.0–88.0) and at Neonam-gol 6.4 (1.0–9.6) and 78.0% (70.0–85.0), respectively (Table 1).
| Site (ID) | Jungmi-gol | |||||||||||
|---|---|---|---|---|---|---|---|---|---|---|---|---|
| 01 | 02 | 03 | 04 | 05 | 06 | 07 | 08 | 09 | 10 | 11 | Mean | |
| t-value | 14.0 | 10.5 | 11.5 | 21.5 | 22.9 | 14.6 | 24.7 | 18.2 | 14.3 | 28.8 | 31.3 | 19.3 |
| G value | 79 | 77 | 76 | 76 | 81 | 82 | 72 | 85 | 86 | 87 | 88 | 81 |
| Site (ID) | Neonam-gol | |||||||||||
|---|---|---|---|---|---|---|---|---|---|---|---|---|
| 01 | 02 | 03 | 04 | 05 | 06 | 07 | 09 | 10 | 11 | 13 | Mean | |
| t-value | 7.6 | 4.2 | 7.3 | 7.3 | 8.6 | 1.0 | 9.6 | 7.6 | 4.4 | 7.2 | 5.8 | 6.4 |
| G value | 80 | 76 | 71 | 85 | 77 | 70 | 84 | 75 | 79 | 85 | 76 | 78 |
Stand chronology was established using the individual time series of trees at the same stand, which were cross-dated well. Usually, t-value with 3.5 and G value with 65% between the time series are used as the threshold to determine the success of cross-dating statistically, when the length of time series is longer than ~100 years (Kim and Park, 2005). According to the statistical results, except one time series at Neonam-gol which showed low t-value of 1.0, all the other showed values higher than the threshold (Table 1). Although the ring-width time series showed such low t-value, the G value was enough high as 70% and displayed well synchronization with the chronology of Neonam-gol. Therefore, it was verified that only well synchronized ring-width time series with each other were used to establish the stand chronology.
Except 3 dead trees which intensively decayed, the death years were successfully dated (Table 2). The dead trees sampled at Jungmi-gol A and Neonam-gol were dead in 2020 and 2019, respectively, and those at Jungmi-gol B between 2012 and 2013. The first death of the Korean red pine occurred at Jungmi-gol B located at the highest elevation among the study sites, followed by the pines at Neonam-gol located at the second highest altitude. The death at Jungmi-gol A located at the lowest height among the sites occurred in the most recent year. Considering the death season, most of the deaths occurred between spring and early summer as 41.6% (10 trees), then between late summer and autumn or late autumn and spring in the next year as 29.2% (7 trees) each.
The death among the study sites occurred sequentially at Jungmi-gol B (798–804 m a.s.l.), Neonam-gol (774–788 m a.s.l.), and Jungmi-gol A (677–686 m a.s.l.) (Table 2) following in the order from the highest to the lowest elevation. This result is akin to that of the previous studies done in Sogwang-ri area which reported that the vitality of the Korean red pine there is going weaker from low to high elevations (Kim et al., 2017, 2020). The pine trees at high elevations are more sensitive to temperature than the ones at low elevations (Shi et al., 2012; Yu et al., 2013), because the role of temperature in the cambial activity to produce wood cells increases with elevation (Rossi et al., 2007). So, the temperature warming observed in recent decades affects the growth of the pine trees more negatively. Furthermore, Jungmi-gol B has more moisture stress due to its westward location and rocky soil condition. These play as principal triggers causing the death of more pine trees at higher elevations.
Regarding the death season of the trees, the main season was from spring to the early summer with 41.6% death and the death for the growing season reached up to 70.8%. According to a past study of the pine trees of Sogwang-ri (Park et al., 2015), the pine trees started radial growth in April and ceased in October. So, it can be concluded that the role of climate in the growing season is more important for tree growth than in the dormant season.
The abrupt growth reduction was observed in 14 out of 24 dead tree samples (58.3%) and 5 out of 22 living tree samples (22.8%; Fig. 5). Moreover, the length of the reduction years and intensity was longer and stronger for the dead trees than those for the living ones. Therefore, it can be presumed that the dead trees were under more stress than the living ones during the same growing years. Although there was relatively high intensity of abrupt growth reduction in the 1880s and 1930s at Neonam-gol, only 3 out of 9 trees (33.3%) showed such pattern.
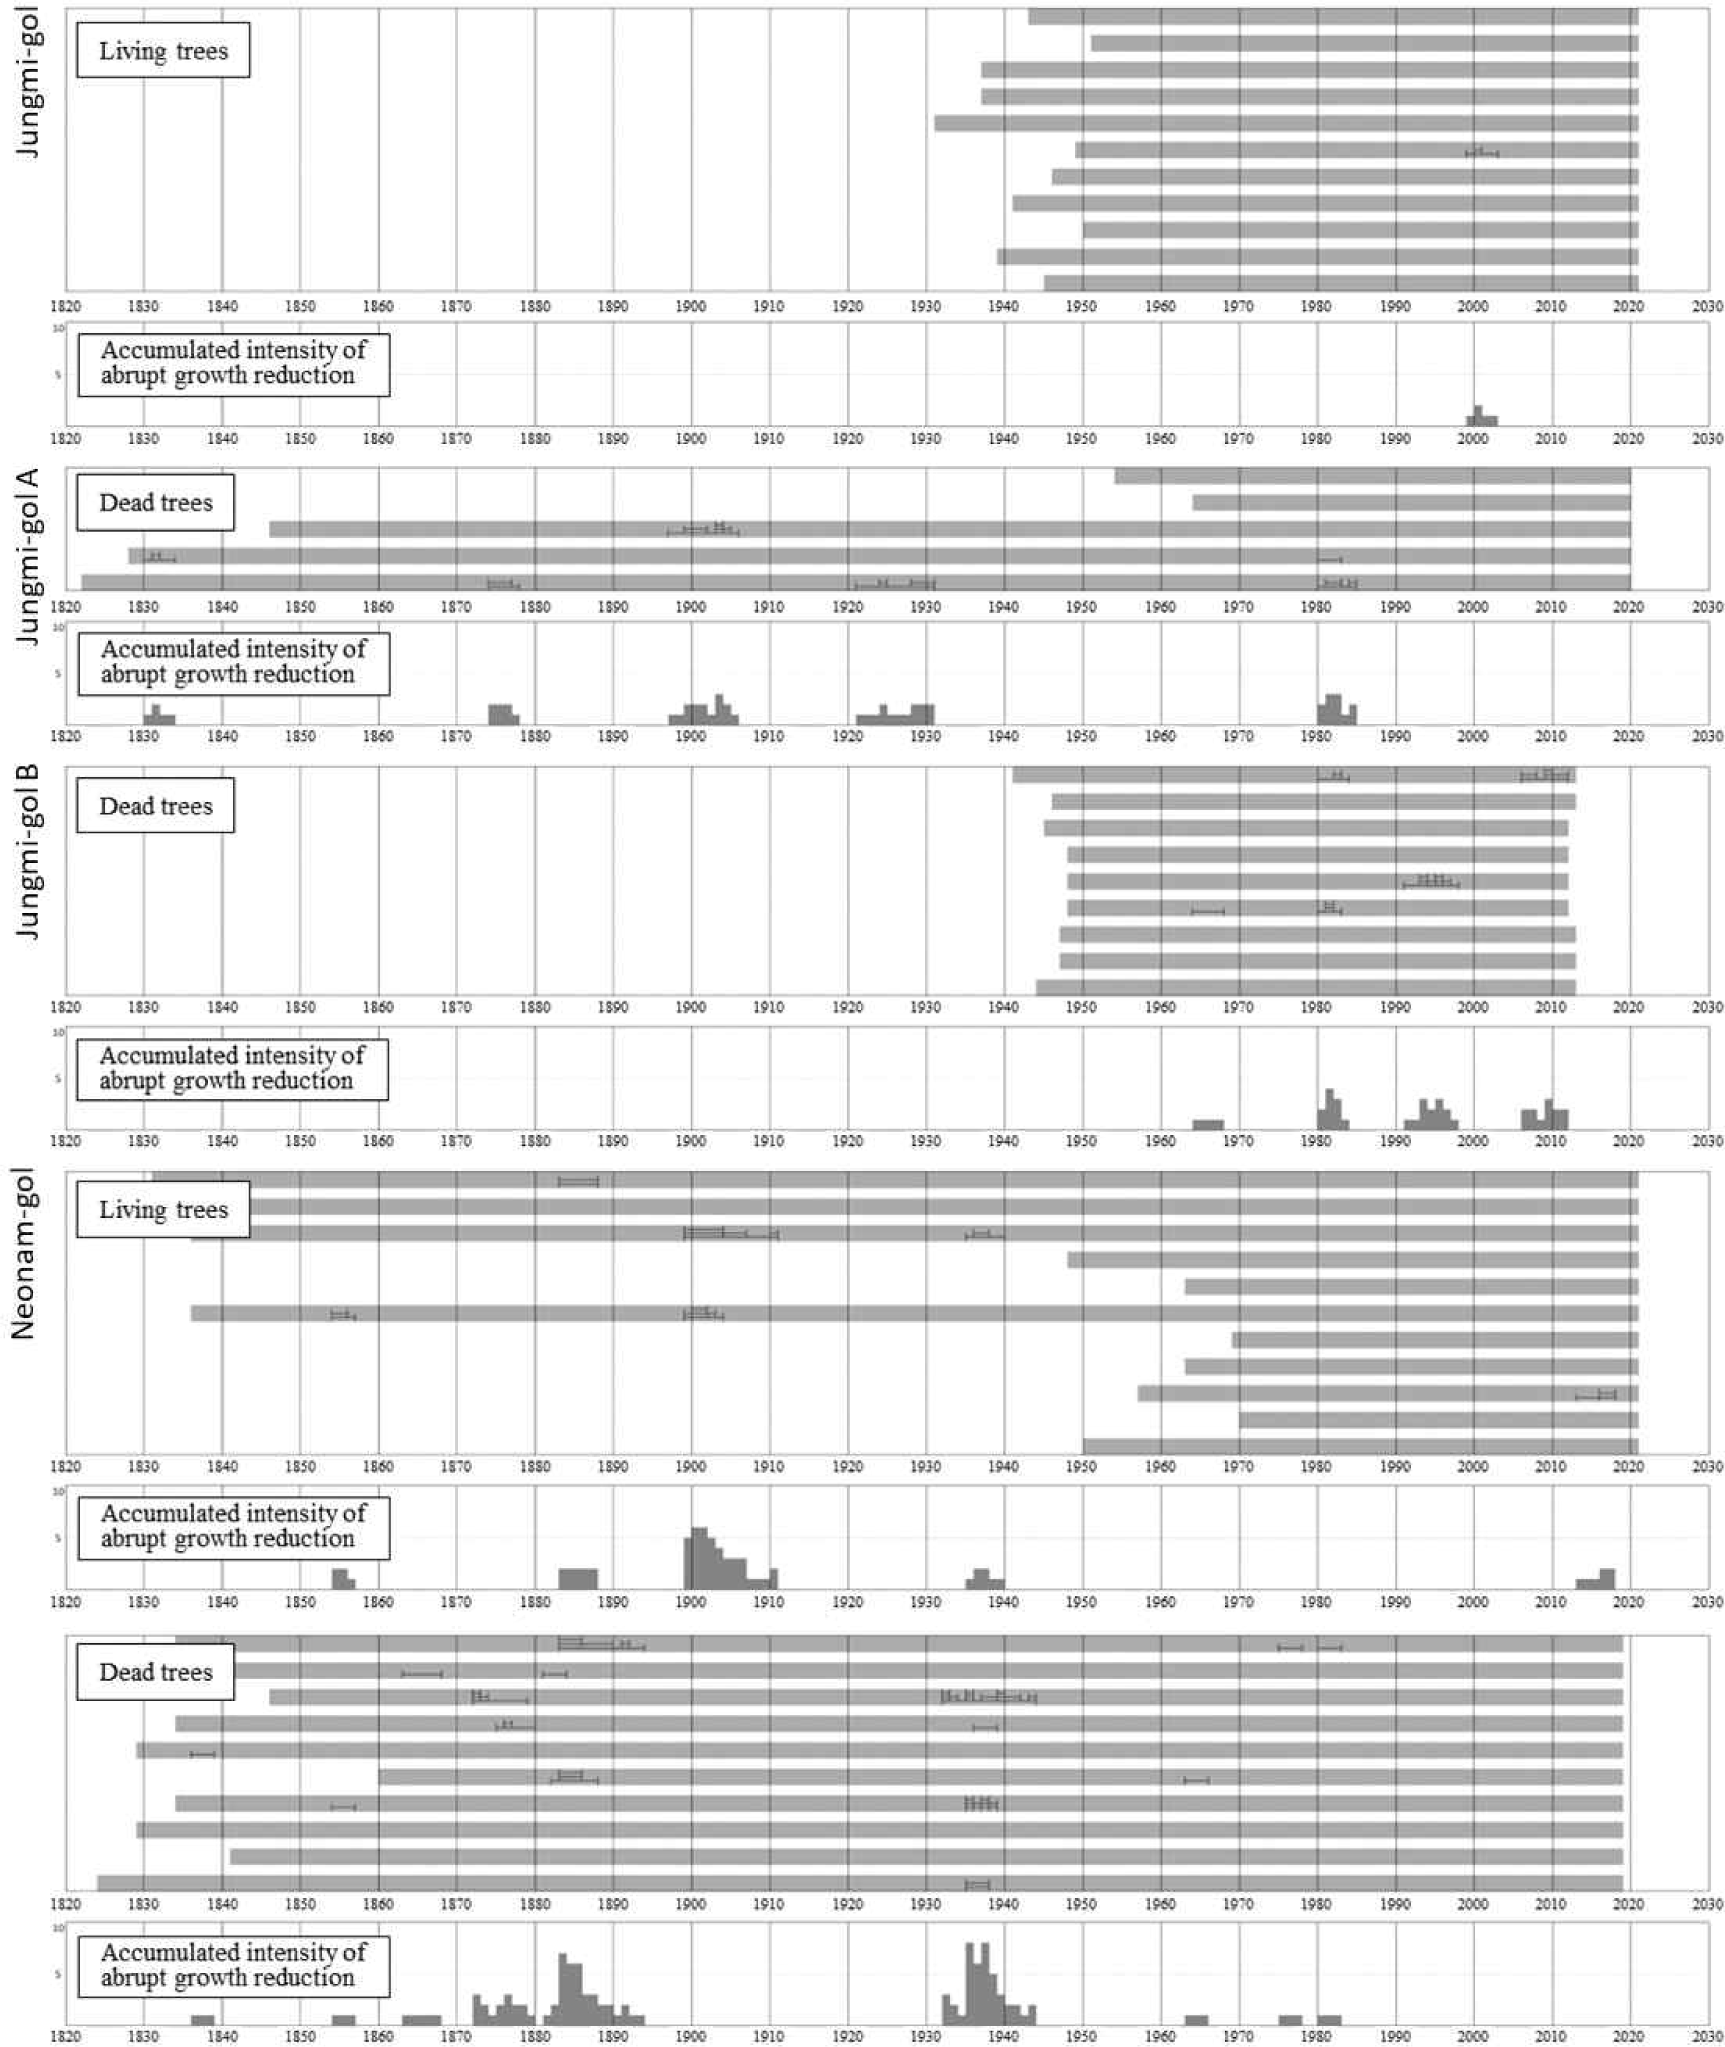
The abrupt growth reduction for longer than 3 years can be due to natural stress, such as mechanical injury, destruction of the foliage, land sliding, or any kinds of abnormal stress (Schweingruber, 1988, 1996). When such stress is strong enough to stunt the tree growth in a forest, the growth decreases dramatically and does not recover for several years. In our present study, only a few trees showed abrupt growth reduction in irregular intervals and different periods within the study sites (Fig. 5). It is possibly because the stress factor did not play a strong role as much as the trees could not withstand the stress. The tree growth not only depends on climate, but in a small area due to different microsite conditions (Seo, 1999), it also relies on environmental factors, such as soil or topographical condition (Park et al., 2010). To evaluate the influencing factor more precisely, stress related to moisture, insects, wildfires, or competition with neighbor trees should be considered as stress factors, referring to the past research on their role in the decline of tree growth (Ahn and Yun, 2020; Eilmann et al., 2009; Han et al., 2012; Kashian et al., 2005; Kueppers et al., 2017).
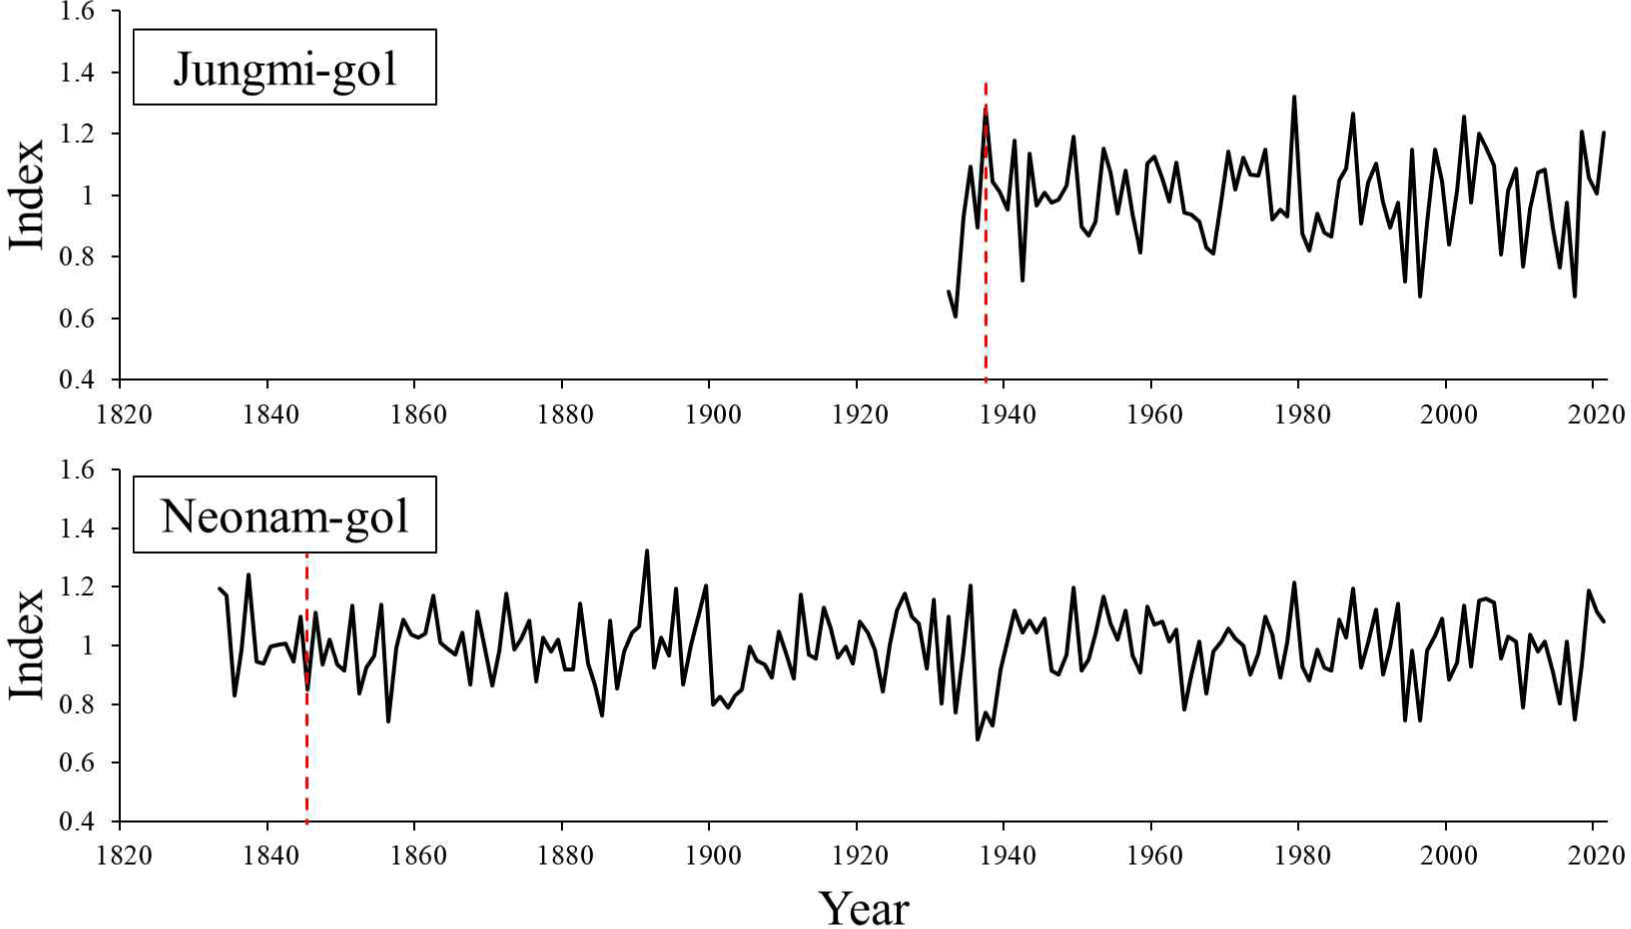
88- and 188-year long index chronologies for Jungmi-gol and Neonam-gol were constructed using the successful cross-dated ring-width time series in the living trees (Fig. 6). The expressed population signal (EPS) of Jungmi-gol and Neonam-gol were higher than 0.85 from the years of 1938 and 1845, respectively. Overall, the pine trees at Jungmi-gol showed positive correlations with precipitation, but negative with temperature and DSI. Unlike Jungmi-gol, the trees at Neonam-gol had meaningful positive correlation with temperature and DSI (Fig. 7).

To evaluate the index chronology for determining the quality how well the chronology represents the common growth signal of an infinite population, the threshold of 0.85 is used as criterion (Wigley et al., 1984). Since the EPS values in both sites exceeded 0.85 in 1938 and 1845, respectively, the comparative analysis with climatic factors between 1981 and 2020 was deemed appropriate.
Overall, DSI between July and September was investigated as a significant parameter (p < 0.05) by correlation analysis. It means, the ring-width growth has been increased when DSI decreased from July to September. Although DSI was verified as a climatic factor potentially affecting the growth decline or mortality of the pine trees in the study sites, the data for the last 40 years (1981–2020) did not show any meaningful trend (results not shown). Therefore, the climatic factors may not be the primary drivers of the growth decline or mortality therein
4. CONCLUSIONS
The death of Korean red pines at 3 study sites were not the same as 2012–2013 at Jungmi-gol B, 2019 at Neonam-gol, and 2020 at Jungmi-gol A. The death occurred earlier at higher elevations among the sites. The DSI played negative role on the tree growth during the growth season. However, there was no meaningful trend of DSI for the last 40 years (1981–2020). So, to improve our understanding about the influences of other factors on the death and/or growth decline, the role of soil characteristics, forest fire or insects need to be further considered.


