1. INTRODUCTION
Wooden constructions tend to have better tolerance for earthquakes compared to other construction types. Numerous nailed joints and outer finishing materials, additional unstructured elements such as OSB, wooden constructions have more flexibility that can either absorb or release sudden lateral load energy in earthquakes. Moreover, wood as a material has a much stronger specific strength compared to steel or concrete, which enables weight lightening of the building, having strong resistance against lateral load (KBC, A, 2009). It can be predicted that the demand of wooden structures with superior earthquake-resistant properties would rise, coupled with the current domestic situation, but there is hardly any research that quantitatively evaluates the safety of wooden structure that are directly related to consumers.
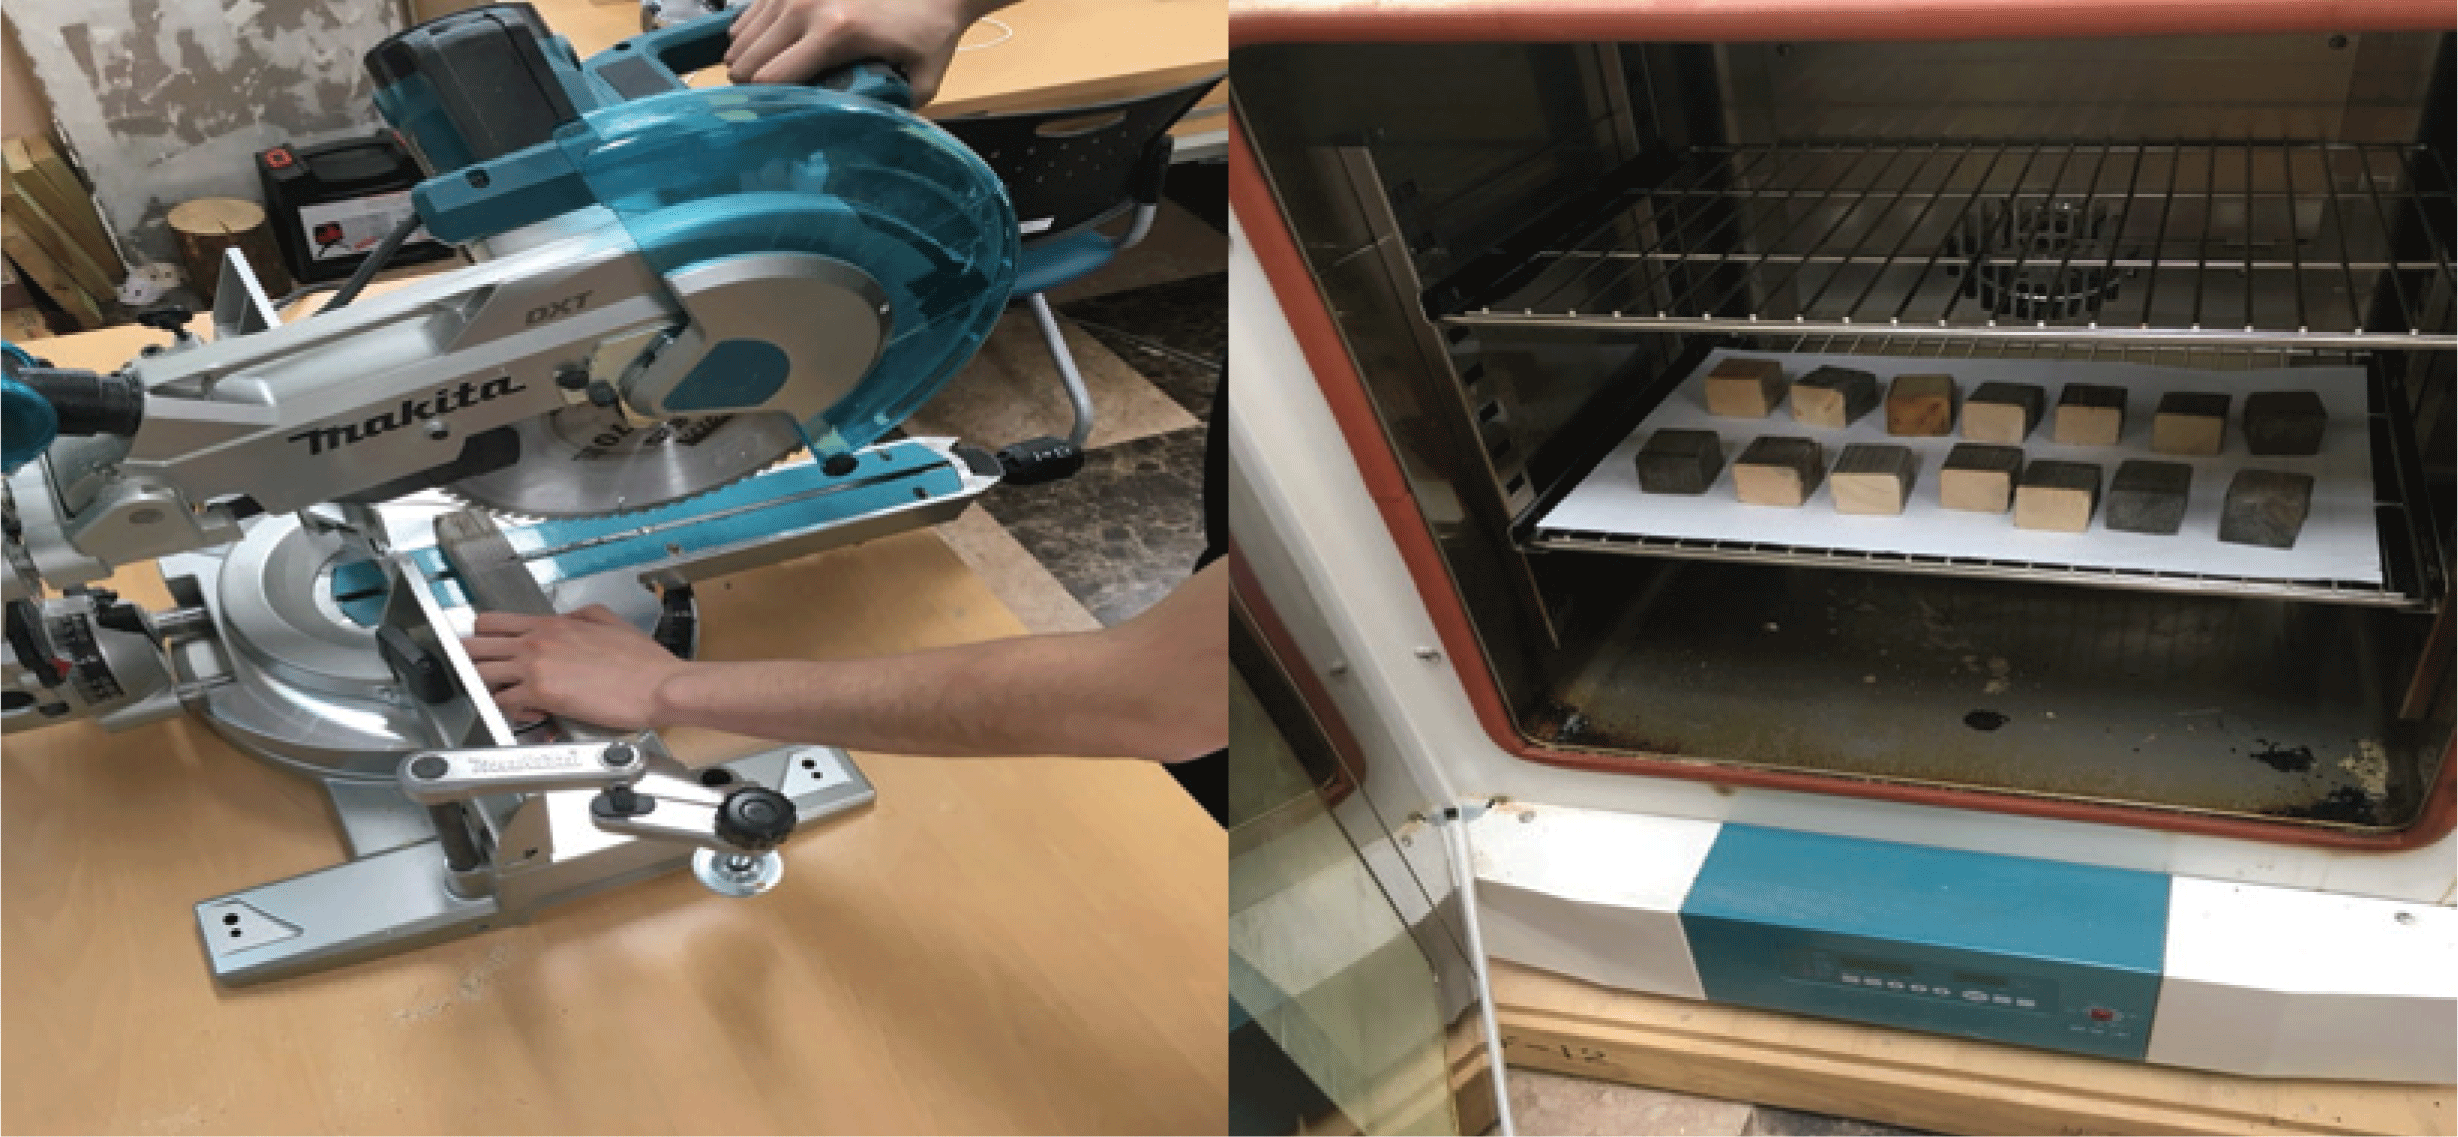
This study aims to build a database through an outdoor exposure test to explore the mechanical properties of wood exposed to open air. Data obtained from this study will be utilized not only in the quantitative evaluation of the safety of wooden structures but will also serve in manuals dealing with maintenance and repair. Fig. 1.
2. MATERIALS and METHODS
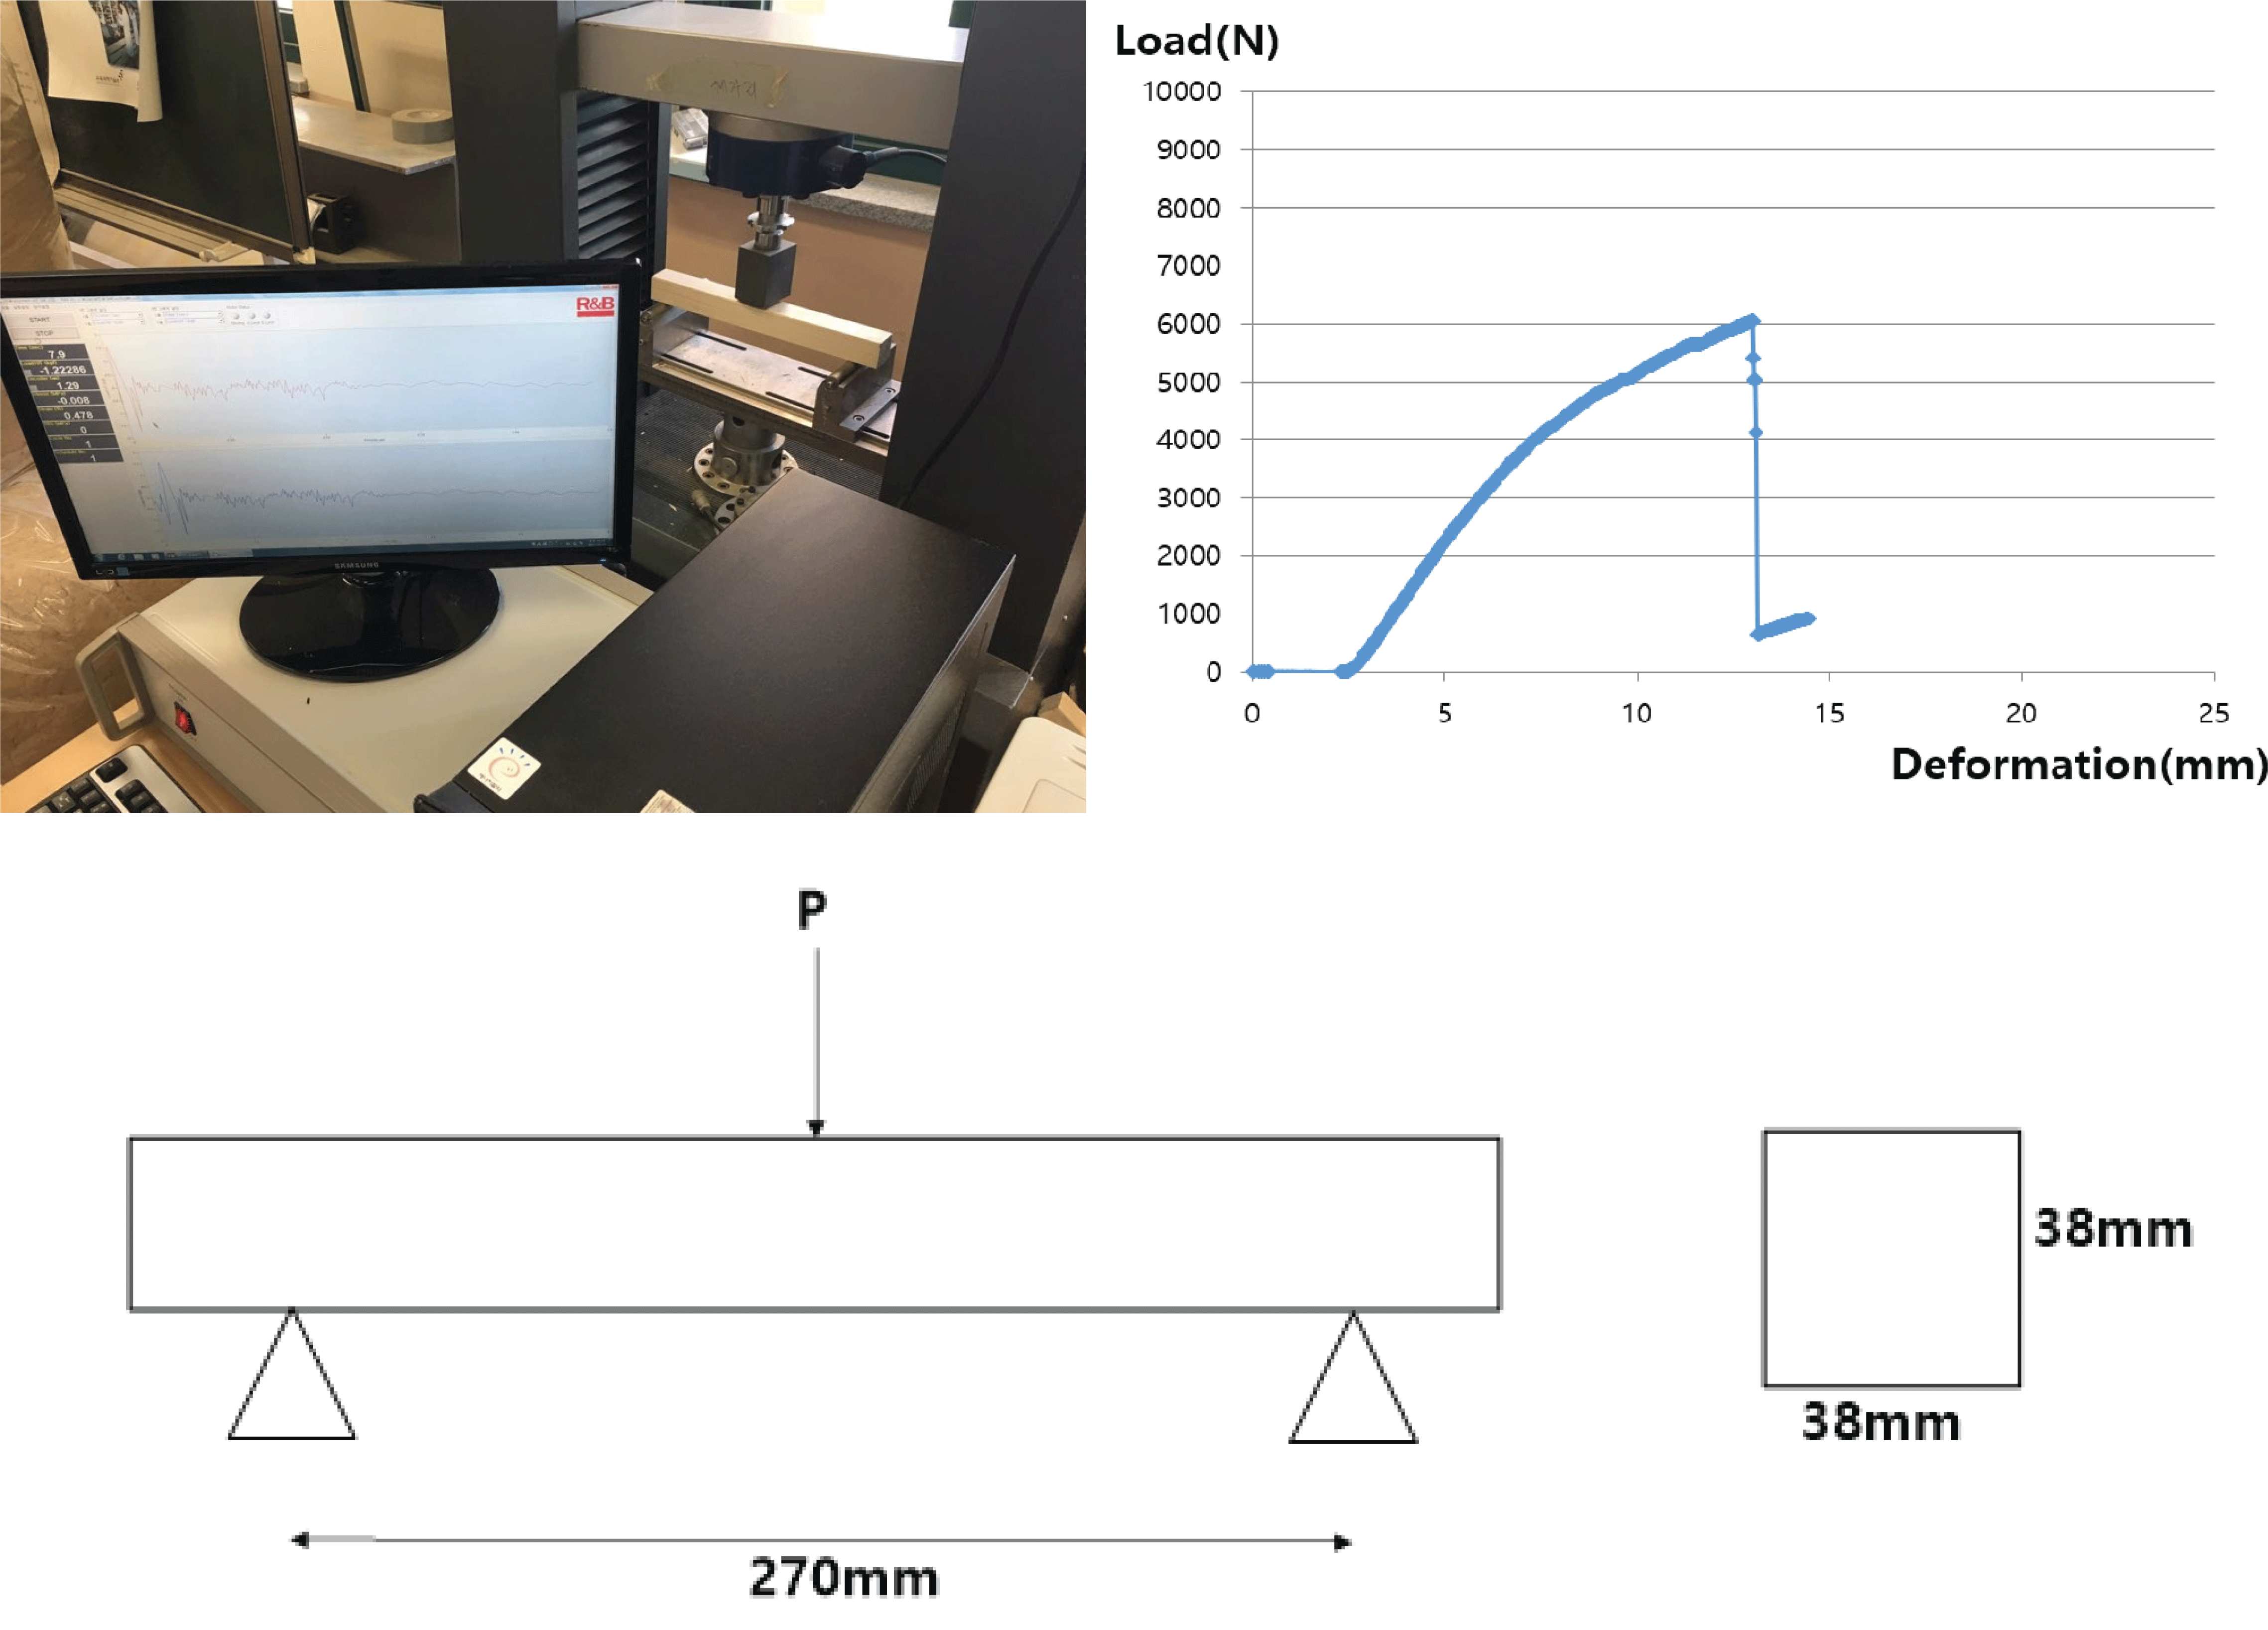
An SPF (Spruce-Pine-Fir) that was kiln dried under 12% moisture content. The size of the test piece was 38×38×300(mm). Due to limited literature and previous studies on the mechanical properties of outdoor exposed wood, small test pieces instead of actual size , in order to obtain data (Kim et al., 2011; Kim and Matsumura, 2013). The total number of test pieces in the study was 140, of which 20 were control groups and 120 were outdoor exposed for one year (10 pieces for each month) (Park et al., 2018). The physical properties of the specimen were measured monthly before and after the test (Kim and Kim, 2019). The moisture content and density of the specimen were evaluated by cutting and drying two ends after the test (Han et al., 2016). Fig. 2.
The outdoor exposure test was conducted on the rooftop of the Chonbuk National University, College of Human Ecology, located in Jeonju City, Northern Jeolla Province. The test took place in the rooftop in order to maximize sunlight exposure on test pieces. The testing bench was made in accordance with the Weathering Testing Guidebook (McGreer, 2003), and was tilted at -5 degrees from level, in order to maximize reception of solar radiation through reflection and direct light at the testing (rooftop) environment with waterproof flooring. On-site temperature and humidity was measured daily at 2:00PM, and was recorded alongside data on the Korean National Weather Service web-site. In order to ensure all sides of the test pieces was evenly exposed to sunlight, all sides were turned over regularly (Kim and Kim, 2019; ASTM G7/G7M-13, 2013; ASTM G 90, 2005).
The bending test was carried out in three points, universal testing machine (10T) was used with the loading rate of 10mm/min (KS F 2150, 2014; Jung et al., 2016; Sim and Kim, 2017). The span set to 270 mm. After the test, the failure figure of each test specimen was taken photographs, which were compared and contrasted with the eye to observe failure type (Kim, 2012). Failure modes were categorized into 6 types. The load-deformation curve was used for comparative analysis, exploring the mechanical performance depending on outdoor exposure time and moisture content change.
3. RESULTS and DISCUSSION
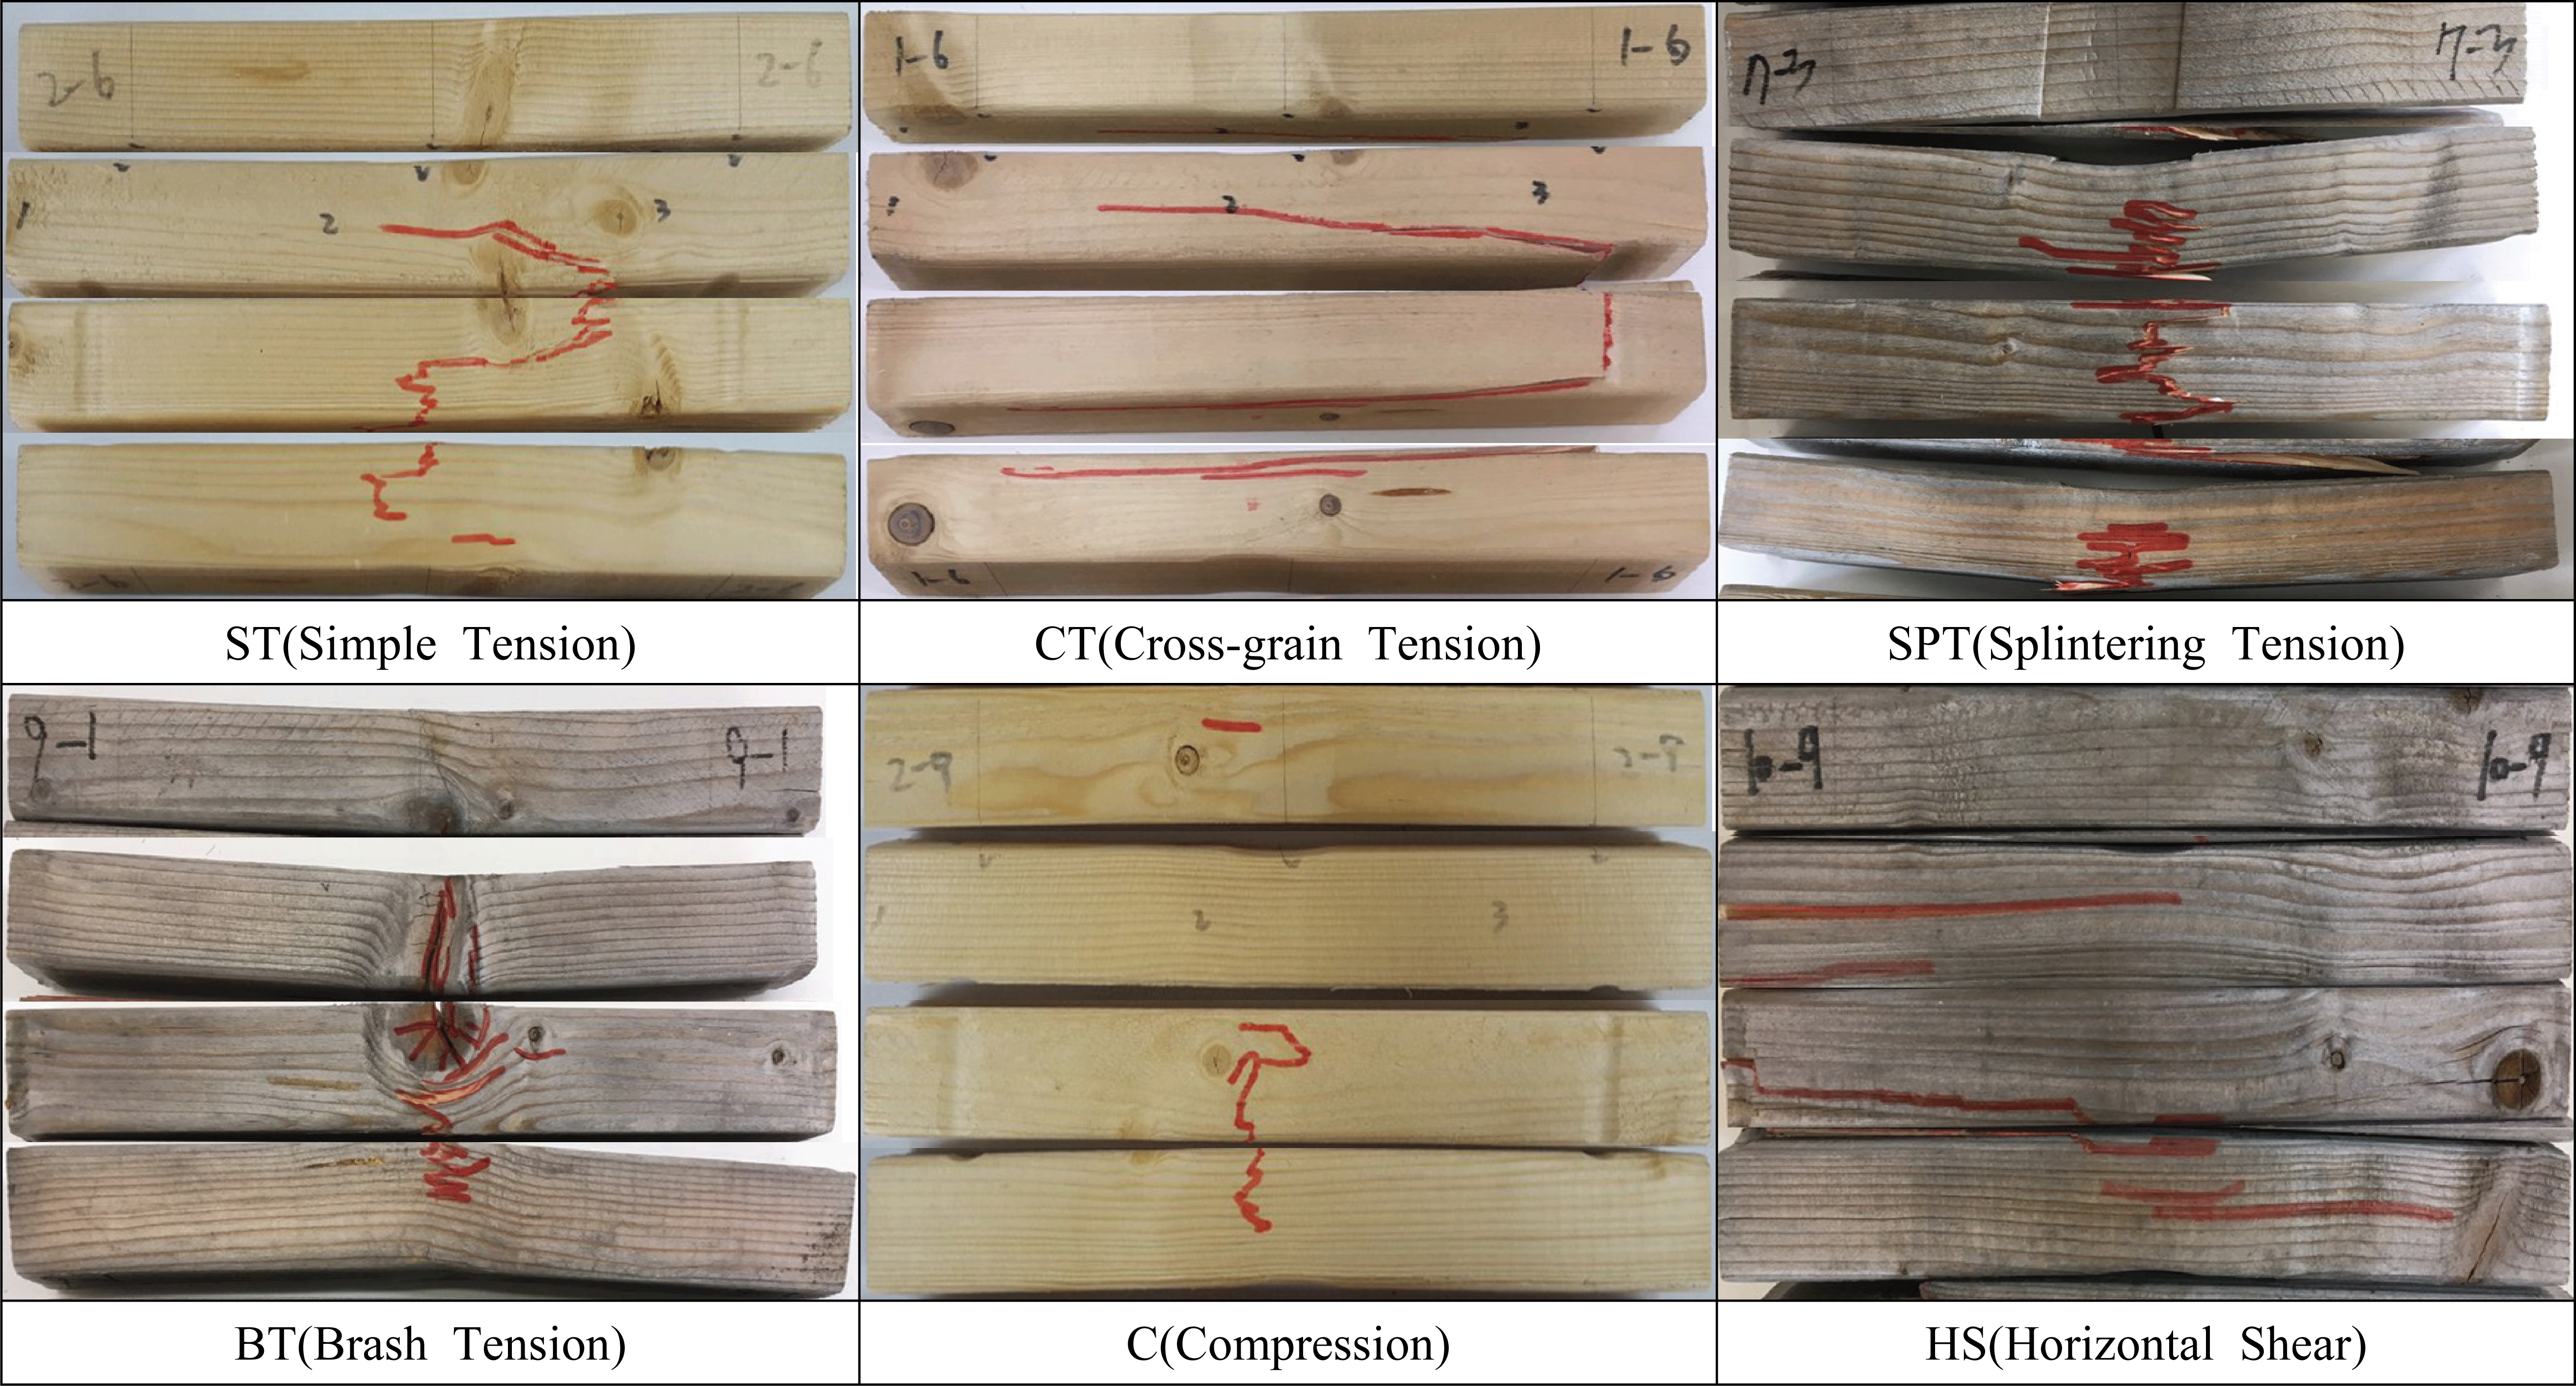
Fig. 3 shows the failure modes categorized according to reference. According to reference, simple tension (ST) is not a common type in bending failure, but is a failure mode occasionally observed in high-density wood. Cross-grain tension (CT) is a typical failure form when the pressure put and the direction of the grain intersects. Splintering tension (SPT) is a collapse tensile failure that occurs mostly in wood with low moisture content, and Brash tension (BT) is a failure form that occurs in abnormal molecular structure wood that is easily broken. Compression (C) is a form that is typically found in zero-defect, low-density wood, and the Horizontal Shear (HS) is a type of failure that occurs in tree species that show drastic growth change. These are the six types categorized by the study (Jozsef, B. et al., 1982).
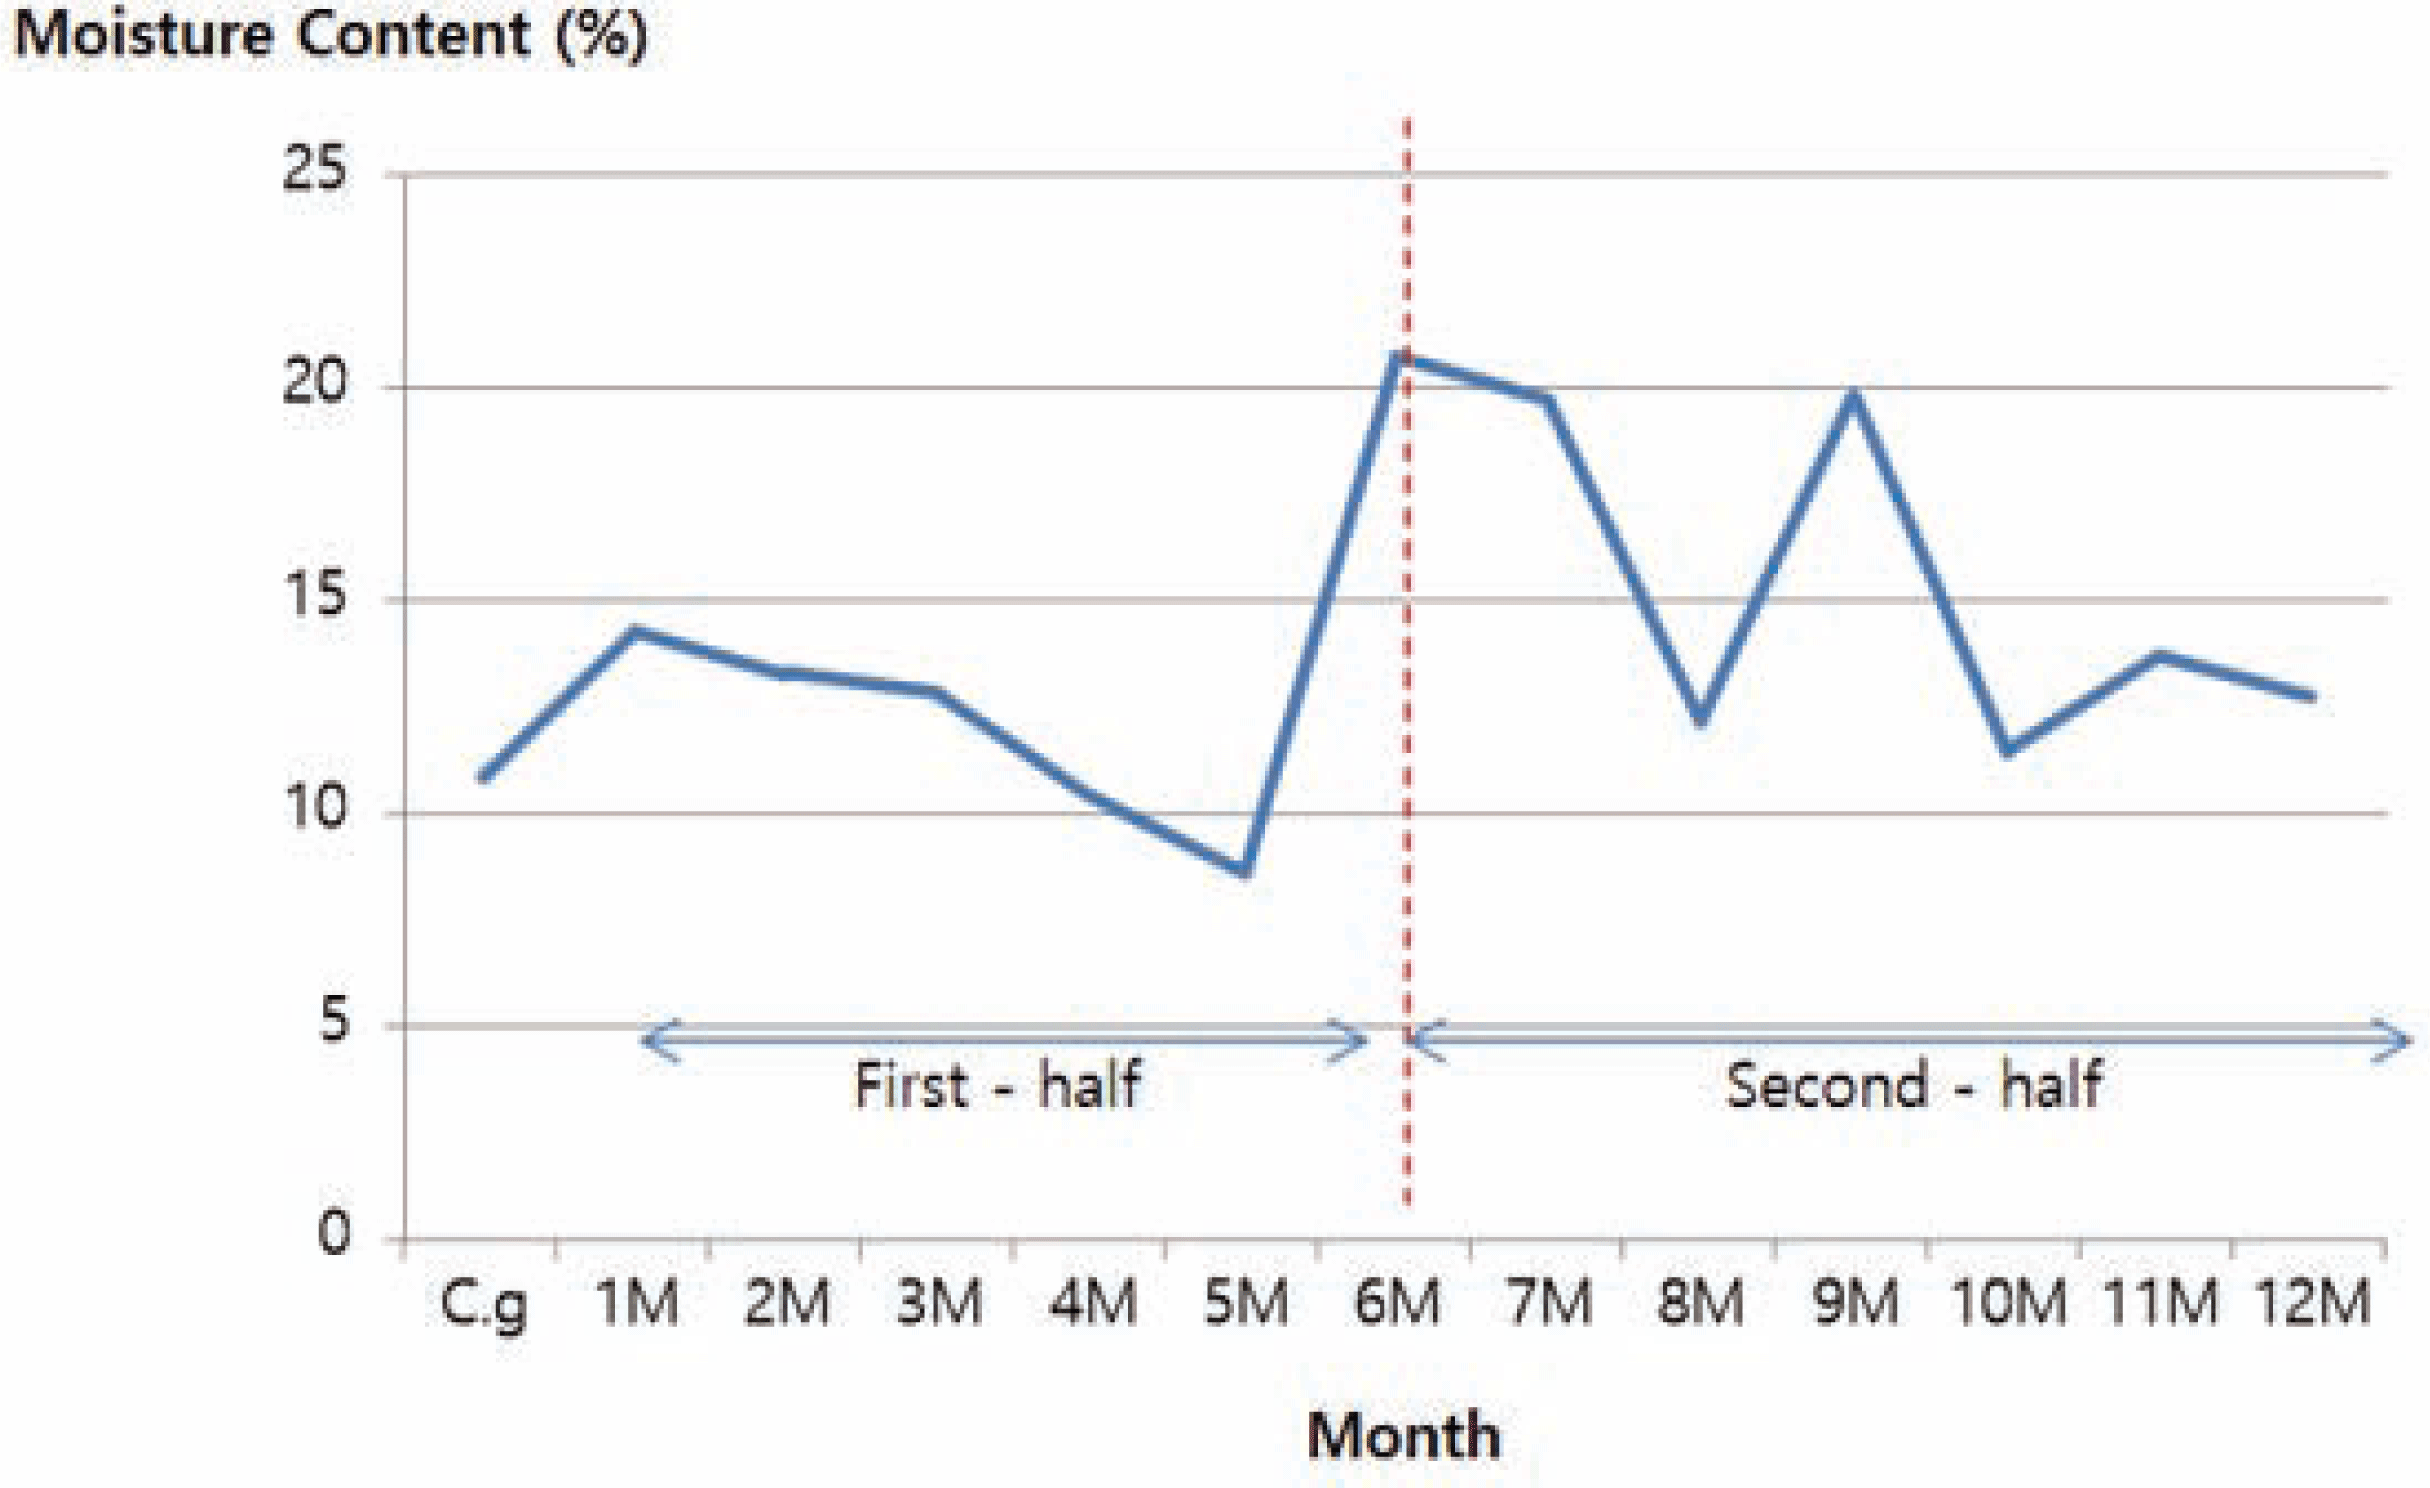
Fig. 3 categorizes failure modes of all test specimens with visual inspection. For test specimen that display two failure modes, the predominant mode was recorded. As shown in Table 1, the BT type was less considered in analysis as it is a failure mode mostly observed in abnormal molecular structures such as knots. Table 2 shows the moisture content and density of monthly test pieces and their control group. The average of the total density is 0.42(±0.019)g/cm3, which remained fairly consistent across all test pieces, and moisture contents showed similar or higher values than the control group except for May test specimen. May is a transitioning month between spring and summer in Korea with the largest daily range in the entire year, causing moisture content to shrink drastically compared to the control group.
In terms of failure mode, simple failures with little influence from outside factors such as ST, C, and HS types mainly occurred during January and April, when monthly moisture content showed little difference. However, the trend changed starting from May, the month with the test group’s smallest moisture content of the year. Failure modes in the second half were predominantly complex failure SPT, failures that include the moisture content factor, rather than simple failure. The reason is thought to be the drastic change in moisture content from May to December, compared to previous months, thus having a critical influence on failure (Park and Kim, 2014; Yata S, 2001, Yu et al., 2016). The line graph of moisture content in Fig. 4 shows a clear change in moisture content in the first and second halves.
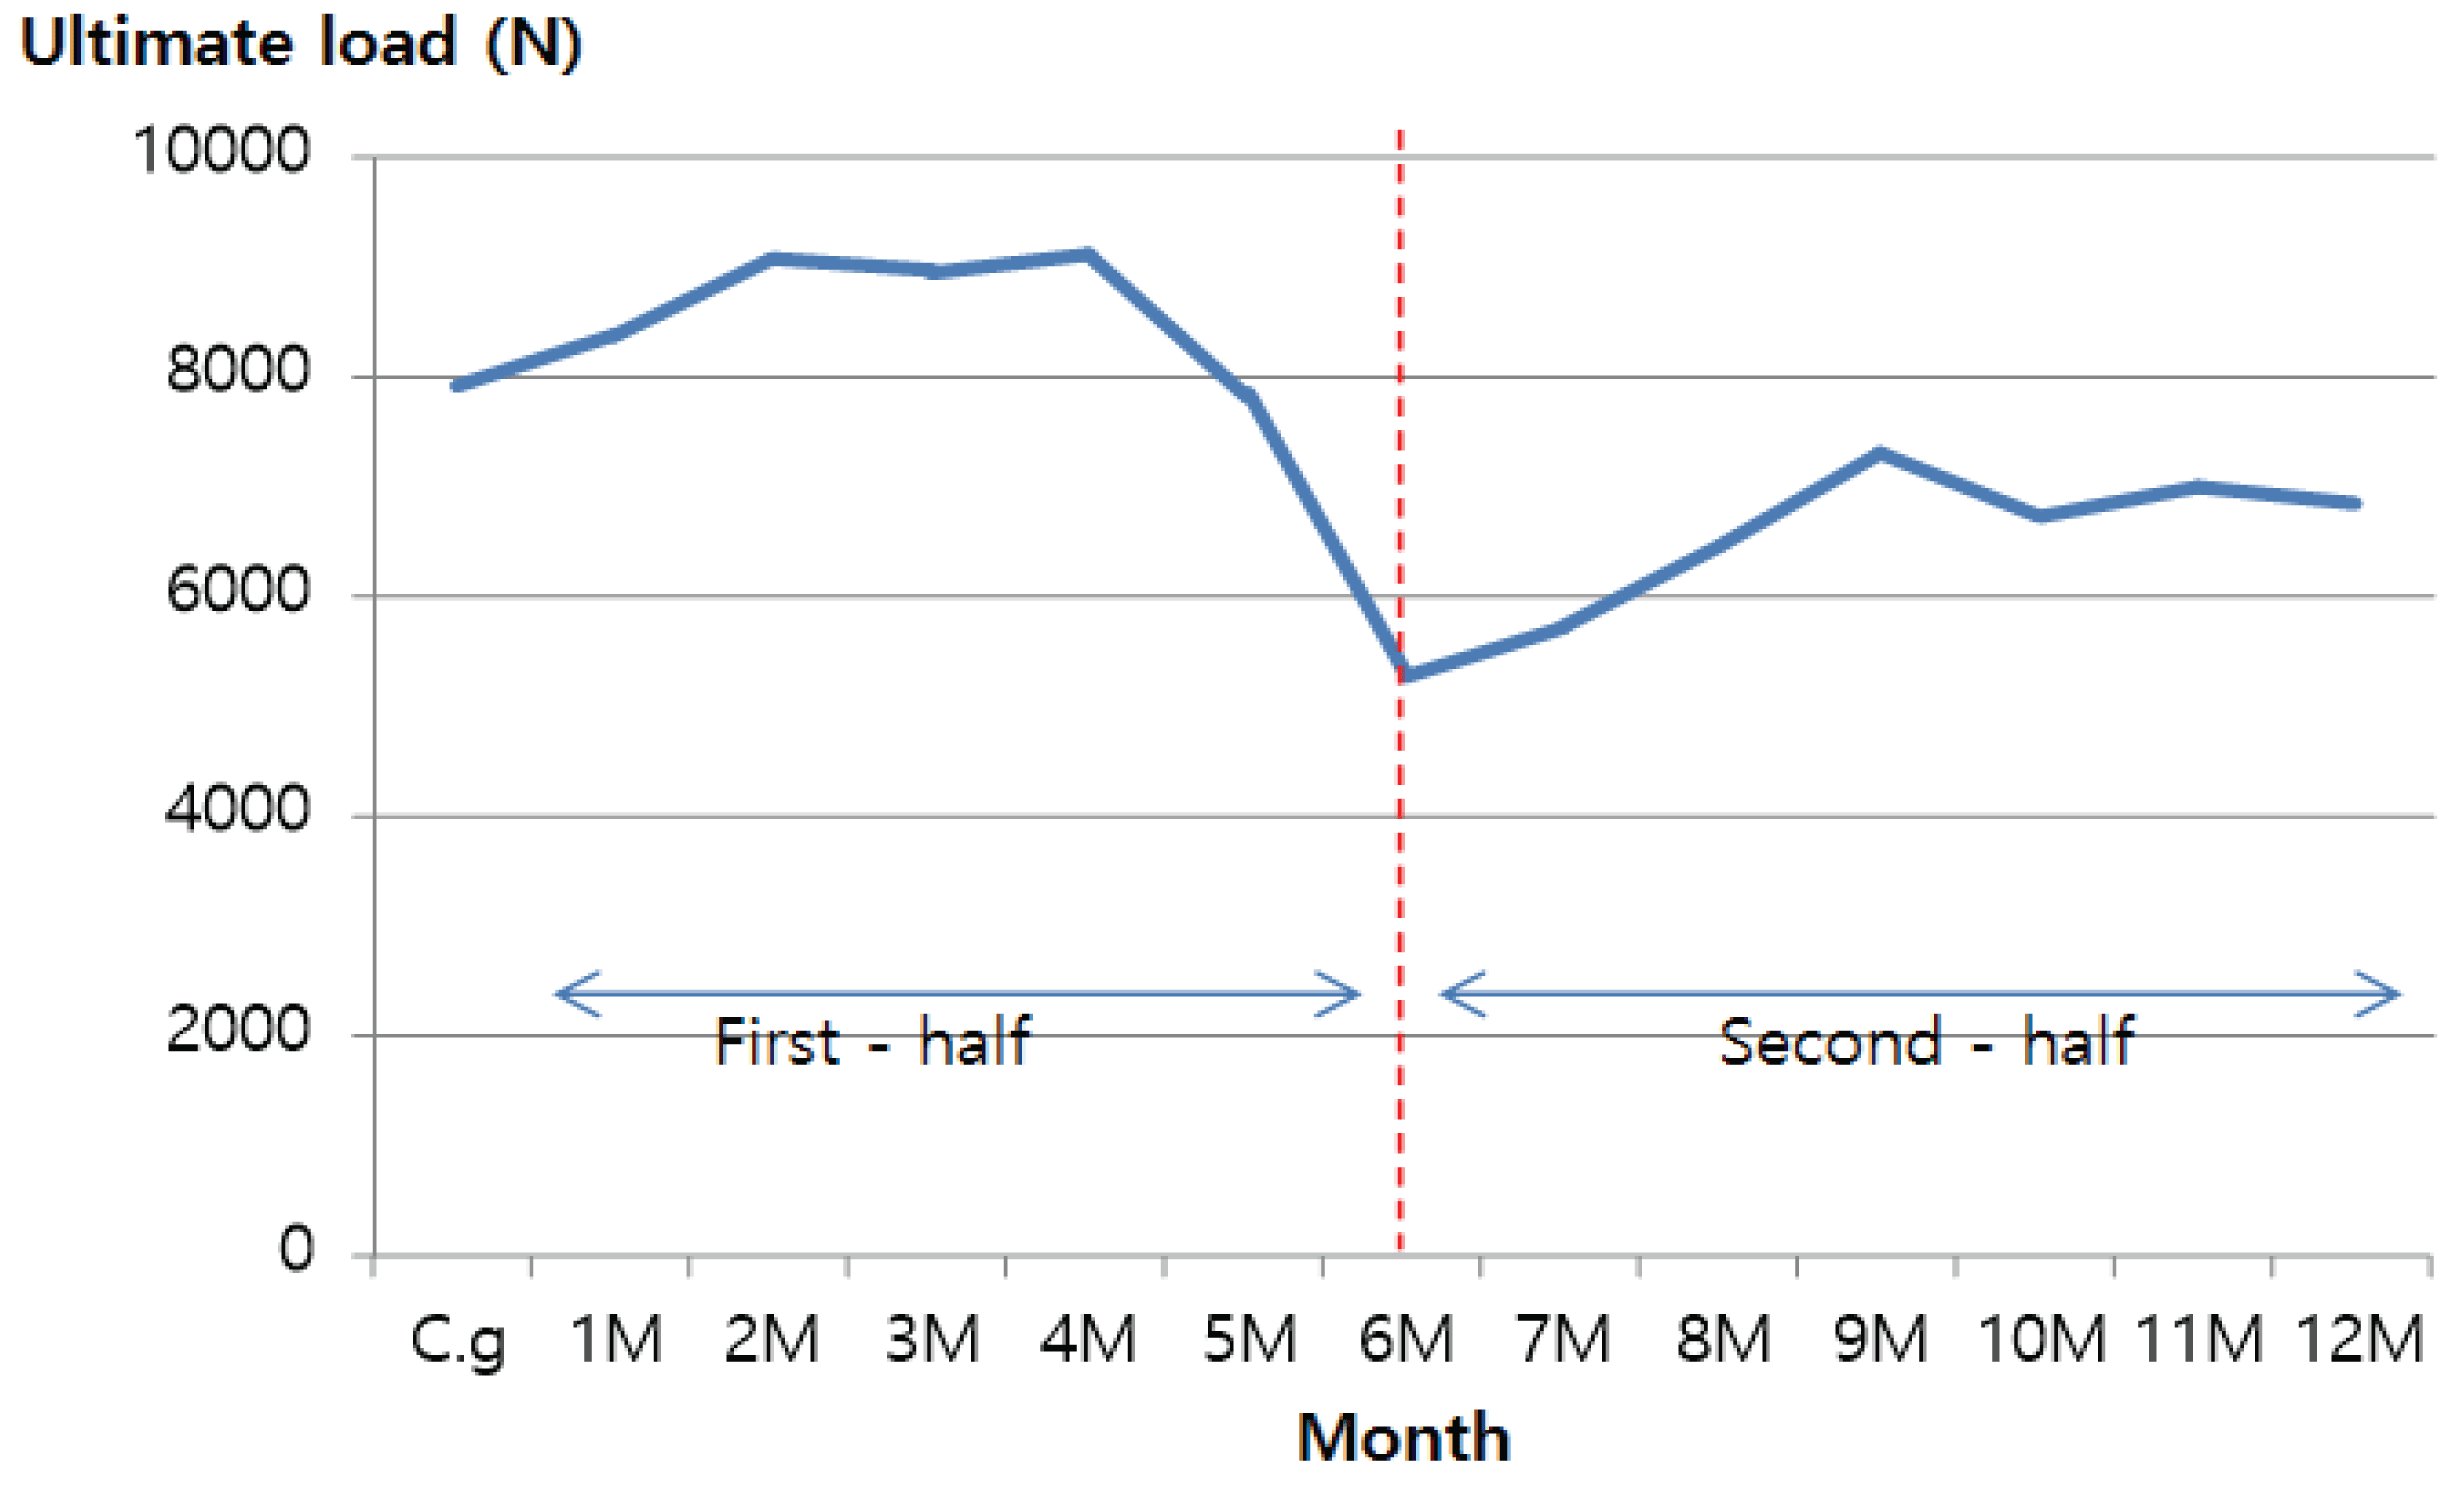
The ultimate loads of monthly outdoor-exposed test pieces were averaged through a three-point bending load test. In order to reduce variation when measuring the average, the highest and lowest values were excluded from ultimate loads measured from 10 test specimen. As shown in Fig. 5, the lowest load value was observed in June when the moisture content was the highest of all 12 months at 20.72(±2.04)%, as load is affected by moisture content. The average yearly load showed a general decrease starting from June. What should be noted is the difference between ultimate loads of test groups with similar moisture content in both first and second halves of the test. Whereas the moisture content difference of test groups 2 month and 11 month, 3 month and 8 month is dismissible at 0.5%, the load plummeted from the first half of 2 and 3 months to the second half of 8 and 11 months by over 2000N. This is thought to be due to the breakup of a covalent bond (hemicellulose, lignin) that gives mechanical load to wood, as lignin is continuously decomposed by ultraviolet rays and washed away by rainfall, ultimately affecting load. Table 3.
As there were a total of 13 test groups (control + 12 months), an analysis of variance was conducted in order to compare more than two groups in order to verify the significance of ultimate loads of each group (Kim and Park, 2015a; Kim and Park, 2015b). Table 4.
Results of the analysis of variance revealed a statistically significant change between ultimate loads of each group, as the F value exceeded its critical value and P value was smaller than 0.05. In other words, this experiment was appropriate, as 13 test group with different outdoor exposure times showed statistically significant difference in ultimate load. This allows us to assume that changes in outer factors due to differences in outdoor exposure time influenced the ultimate load of each test group.
A regression analysis was conducted to explore the correlations among obtained results. The dependent variable was set as the average ultimate load of each test group, and the independent variables were set as outdoor change factors including moisture content, daily range, highest and lowest temperature, rainfall and ultraviolet ray index. As there are more than one independent variable to describe the dependent variable, a multiple regression analysis was employed (Kim and Kim, 2016). Table 5.
A multiple regression analysis of ultimate load and outdoor variables revealed that P values of all independent variables exceeded 0.05, making a statistically accurate analysis of correlation impossible. However, the influence of each independent variable was ascertainable. The P value of moisture content was relatively smaller than the P value of other variables, which led to a simple regression analysis only with the moisture content. Table 6.
Results of the simple regression analysis showed statistically significant F and P values. An estimated equation on the correlational relationship between moisture content and ultimate load is as the following.
y : Ultimate load (N), x : Moisture content (%)
As the constant of the x value that represents moisture content in equation (1) is a negative, we know that ultimate load and moisture content is an inverse proportion. This indicates that the smaller the moisture content, the stronger the load.
As this study was only able to take a year-length outdoor exposure test for statistical analysis, moisture content was the only variable among many outdoor variables that had a correlational relationship with ultimate load. More independent variables are expected to show correlation, however, as we amass more experimental data over additional 2 to 3 years.
4. CONCLUSION
This study explored the mechanical properties of exposed to outdoor wood through an outdoor exposure test for quantitative evaluation of wooden structures. Existing mechanical performance evaluations on wooden buildings were predominantly non-destructive studies, but this study is noteworthy in that it directly destroyed members to acquire data.
This study presents the following conclusions.
The moisture content of all test groups generally showed moisture contents similar to or higher than that of the control group(10.86%), whereas the May test group showed the lowest value of 8.59%, due to the widest daily range.
In the first half of the experiment (January~April) when moisture content changes were relatively small, simple failure forms such as ST, C and HS constituted the majority of all failure forms. However, starting from May, the second half (June~December) produced predominantly complex failure forms such as SPT. This can be attributed to the increased fatigue of test pieces as a result of enduring fluctuations in moisture content that was higher in the second half compared to the first half.
Starting from June with the highest moisture content, the ultimate load average of June (20.72%) decreased by approximately 30% in the second half compared to the first half, which can be attributed to the decomposition of lignin in the wood by ultraviolet rays due to outdoor exposure.
A multiple regression analysis between various outdoor variables and ultimate load revealed that moisture content was the most influential.
The experiment has progressed for only a year, but correlational relationships between other outdoor variables and ultimate loads are expected to change with longer experiment time.


