1. INTRODUCTION
The moisture content of forest fire surface fuel is an important factor that affects the occurrence and intensity of forest fires and the rate of spread. When the moisture content is high, the probability of occurrence of forest fire decreases, whereas when the moisture content is low, the rate of occurrence of the fire is high. Thus moisture in forest fire surface fuel is an important factor affecting not only the occurrence of forest fires, but also their spread and intensity (Kwon, 2009; 2014). Therefore, in the United States and Canada, there were studies on the relationship between the moisture content of forest fire surface fuels and forest fires, and they tried to develop technologies to predict it (Anderson, 1983; 1990). In the United States and Canada, where research data on forest fires has been accumulated for a long time, various types of fuels in forests are classified, and the relationship between changes in moisture and weather has been analyzed and investigated. A forest fire risk forecasting system was developed based on the risk of ignition and spread (Stock, 1987; Van Wagner, 1975).
In Korea, the forest fire risk forecasting system was developed in 2003 and currently being operated by Korea Forest Service which has improved its accuracy through continuous improvement, but the underlying forest fire risk index was calculated by integrated analysis of weather conditions, topography, and empirical data. As a result, unlike the cases in the United States and Canada, it does not properly reflect the characteristics of the change in the moisture content of forest fire surface fuel, which is an important factor in the occurrence and spread of forest fire. In this regard, according to Lee (2007; 2010) and Kwon (2011), the forest fire surface fuels that make up the indicators in the forest include leaves, litter, and ground shrubs etc., and their moisture content determines whether forest fire will spread or extinguish when it occurs. The pine forest fuel (diameter less than 0.64 cm) among the forest fires that make up the indicators is very importantin estimating the spread of forest fire in the early stages, but it is not reflected in the forest fire forecasting system in Korea.
Due to the importance of the moisture content in the forest fire surface fuel, in the United States and Canada, a proxy for these fine forest fire fuel was established, and the proxy was designated as a forest fire fuel moisture stick which measured the change in moisture content of forest surface fire fuel, and this lead to a development of a system to predict the moisture change of fuelin the forest and forecastthe risk of forest fire. For example, the U.S. Forest Service has produced a standard forest fire fuel moisture stick and predicted the risk of forest fire occurrence and spread through the change in moisture content by measuring the change in weight (Theodore, 1965), and Forest fire moisture developed by Campbell Scientific, USA can be said to be an automated equipment using this concept. In Korea, there was a case in which this forest fire fuel moisture stick was used to forecast forest fires in terms of the changes in the weight of the forest fire fuel moisture stick due to the change in moisture content similar to the case of the United States. However, due to the lack of prior studies on the forest fire surface fuel and the lack of interest in automation technology, the forest fire fuel moisture is not used in the forest fire forecasting system in Korea.
However, like in the cases of the United States and Canada, as the change in moisture of the forest fire surface fuel plays an important role in the occurrence and spread of forest fires, it is necessary to introduce these technologies to improve the accuracy of forest fire forecasting systems currently in operation in Korea and to develop additional forest fire related systems. In addition, In case such a technology is introduced, its effect can be doubled only when automated measurement technology is used in parallel. There was no case in Korea in which the application of the technology was difficult because the automated measurement technology was not implemented.
Regarding the automated measurement sensor for predicting the risk of forest fires using the change in the moisture content of forest fire surface fuels, in the United States, measuring equipment using local species has been developed, but according to a study by William (1963), there wasa difference in the moisture content indicated by the resistance value depending on species, and accordingly, there is a possibility that the moisture content of forest fire fuels in domestic forest species may be underestimated or overestimated. Therefore, in order to predict the moisture content of forest fire fuels in domestic forests, it wasnecessary to develop a technology that can automatically measure the moisture content through experiments on domestic species.
In order to develop these technologies, the following three things need to be analyzed. First of all, it wasnecessary to select materials that could reflect the domestic forest fire surface fuelenvironment, and determine a measurement method that can measure the moisture change in the forest surface fire fuel, which can be measured continuously. In addition, it was necessary to know whether there was relationship between the changes in the moisture content in the forest fire surface fuel and the forest fire related index.
This equipment issues could be resolved, if the existing wood moisture content measurement equipment was used. However, since the moisture content of forest fire fuels showed various patterns depending on the region, topography, forest and temperature (Han, 2019; Pang, 2019), samples were needed for each specific region. In addition, long-term measurement and data accumulation were required to predict the risk of forest fires, and since measurements must be made within the forest to accurately measure forest fire fuels. In order to accurately measure moisture contents in forest fire surface fuels, it was necessary to measure it within the forest, but because an access and a power supply were limited, it was necessary to develop independent equipment for this. Therefore, this study was conducted to develop an automated measurement sensor for forest fire surface fuel to predict changes in the moisture content and risk of forest fires, which was indicator of the occurrence and spread risk of forest fires.
2. MATERIALS and METHODS
In this study, the method of measuring the change of the moisture of wood was used instead of oven-drying, extraction, or hygrometric method. Thismethod enables fast results but, not enable to continuous measurement without damaging the test subject. In addition, with the electrical measurement method, there is a resistance type measurement method that measures the moisture content by using the logarithm of the direct current and the specific resistance of wood in a linear relationship with the moisture content of wood, and another measurement method based on the fact that the Dielectric Permittivity of wood or the dielectric loss is in a Linear Relationship with the moisture content. The method of using Dielectric Permittivity has a measurement range of 0 to 30% and Kang Chunwon (2017) estimated Oven-Dry Density of wood using Dielectric Constant Type Moisture Meter, but the method using electric resistance was selected because although the measurement range was 7 to 25%, it was possible to measure the range of risk of forest fire surface fuel and easy access to the electric resistor on site.
For the selection of the materials, using the results in Yeom (2016), a rod shaped pine was selected with a diameter of 1.5 cm and length of 50 cm considering factors such as deformation, damage and stable amount of change in FMC (Fuel Moisture Content) of the measurement material for the fuel moisture measurement sensor.
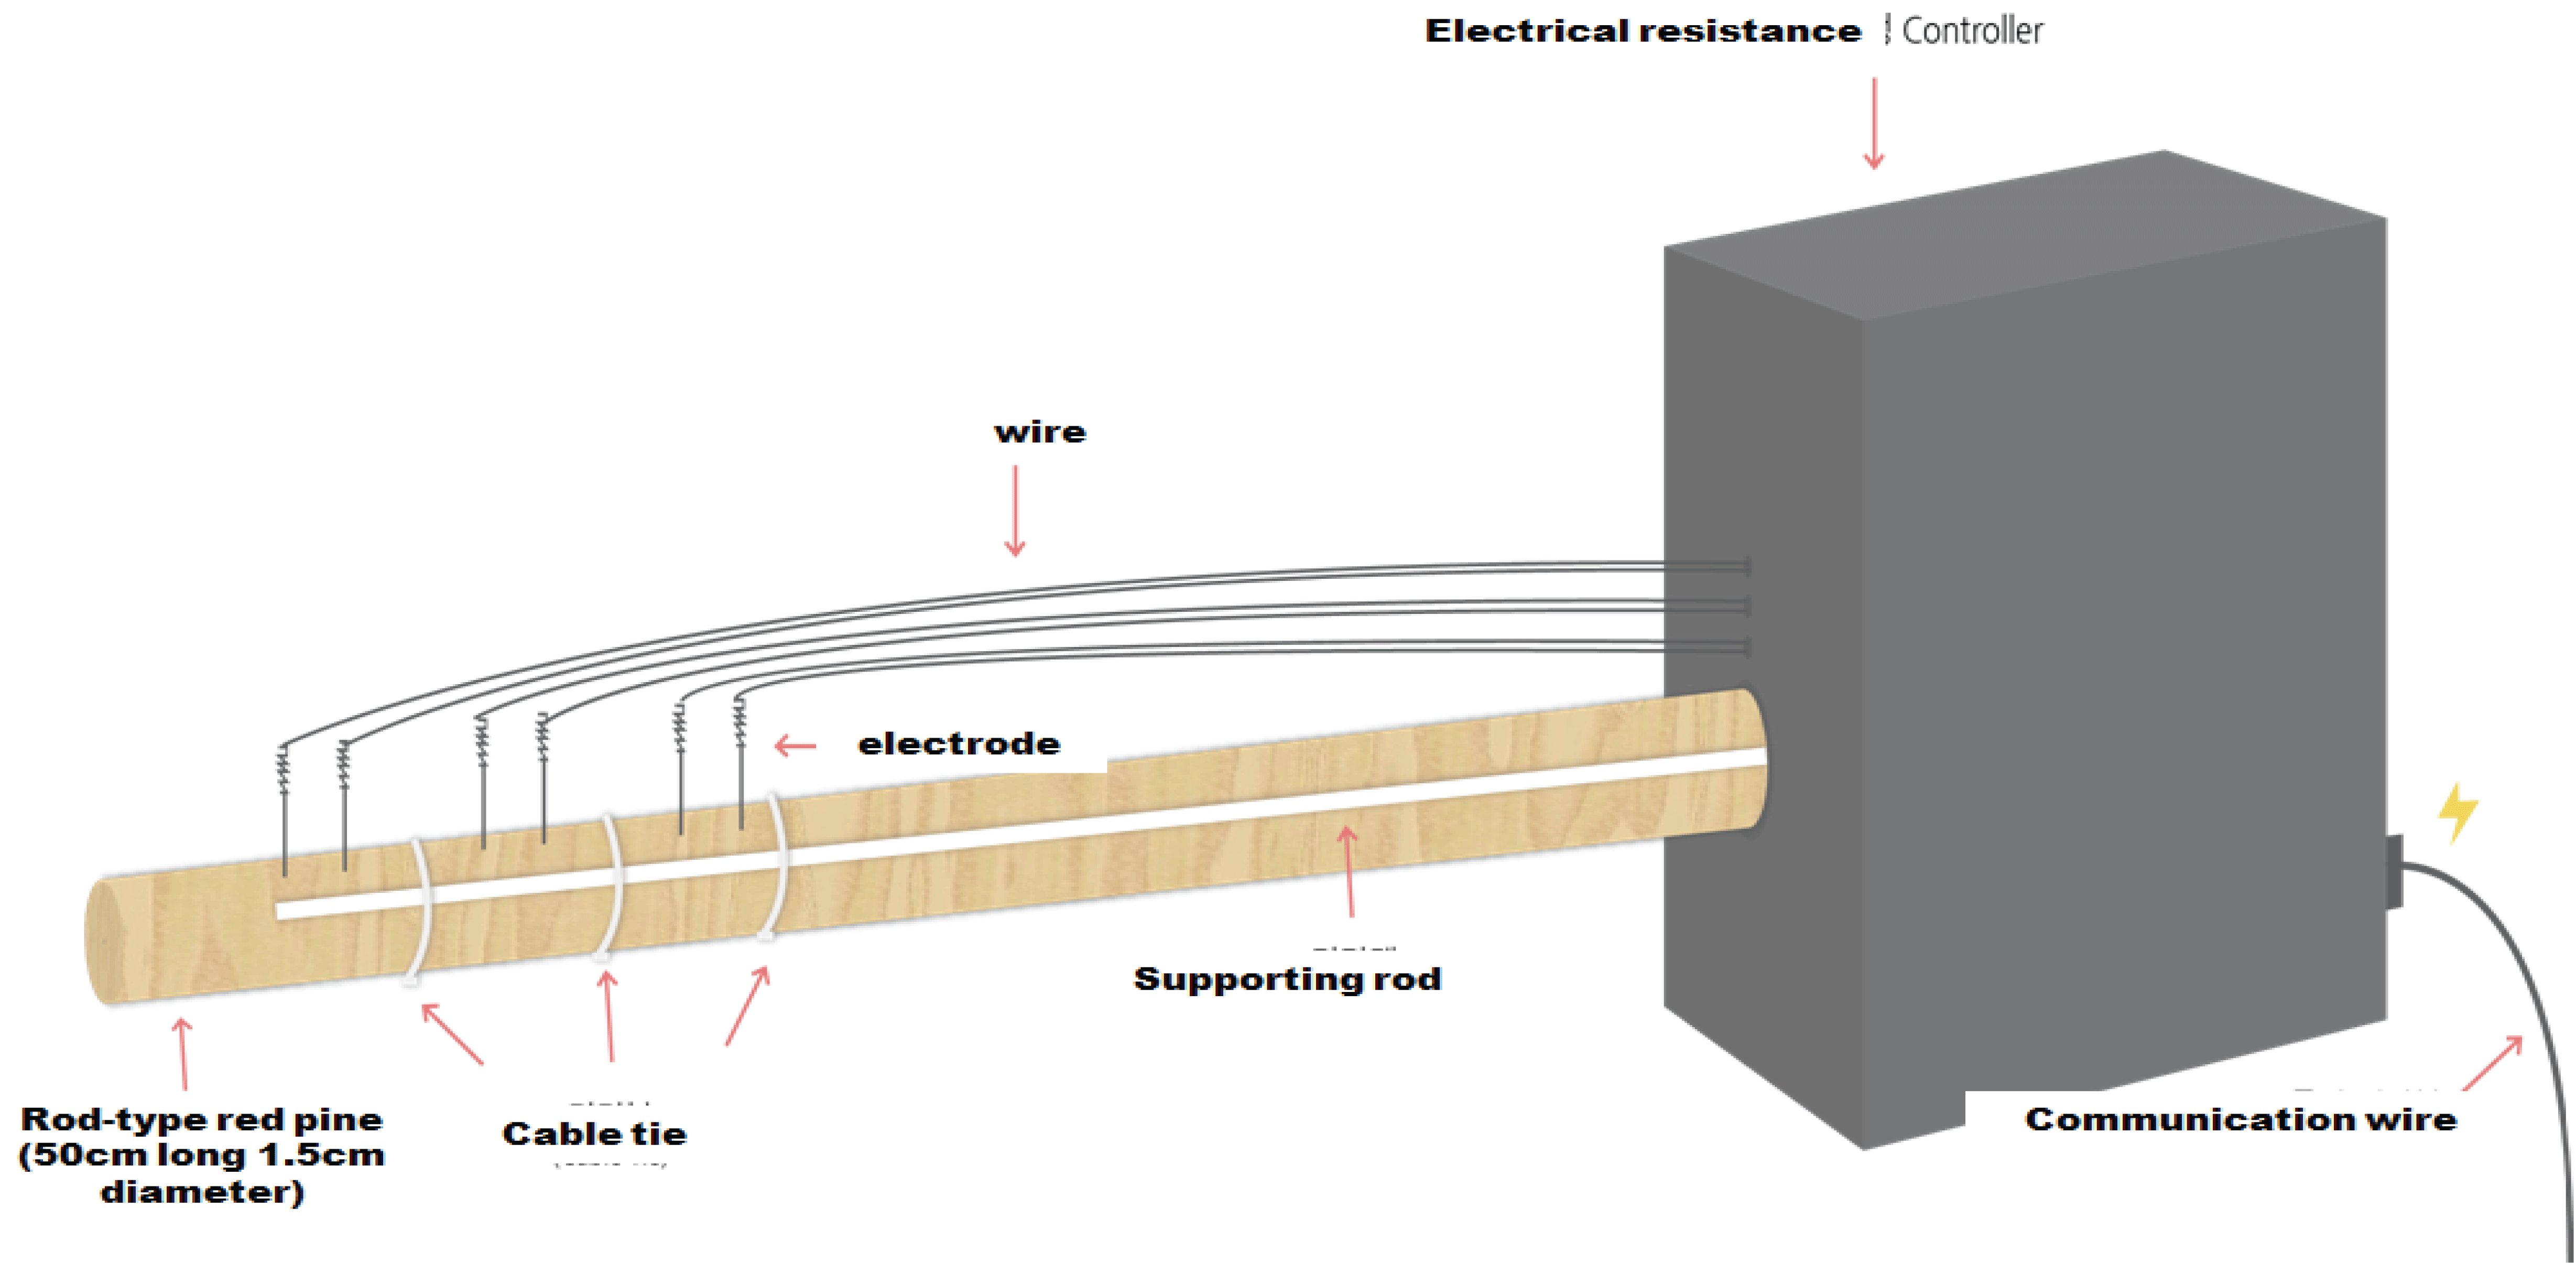
In order to measure the moisture content by electrical resistance, pointed electrodes must be inserted deeply to measure, and in this regard, the selection location and depth of the electrodes were determined by referring to the study of Lee (2005). The electrodes for measuring electric resistance, which was the measurement principle of measurement sensor for forest fire surface fuel moisture, were installed at one end, center, and 1/4 length point, respectively, and the end was installed from a point 2 cm away from the end, taking into account the space for electrode installation. For the electrodes, they were made of steel and coated with chromium in order to protect them from rust as they would be exposed to air and moisture. The resistance of the electrode itself came out to a negligible level, and the both ends were coated with silicone insulation (NABAKEN's silicone insulation coating agent S-830) so that resistance could be measured at the electrode tip (Yeom, 2017). The following Fig. 1 shows the standard of forest fire fuel proxy and the location of electrodes.

For the on-site installation of selected and electrode- equipped measuring materials for measuring the moisture content of forest fire fuels, they were installed in Geombongsan AMOS (Automatic Meteorological Observation System), which was installed and operated by Korea Forest Service, heliport AMOS and Samcheok AWS (Automatic Weather Station) currently operated by Korea Meteorological Administration.
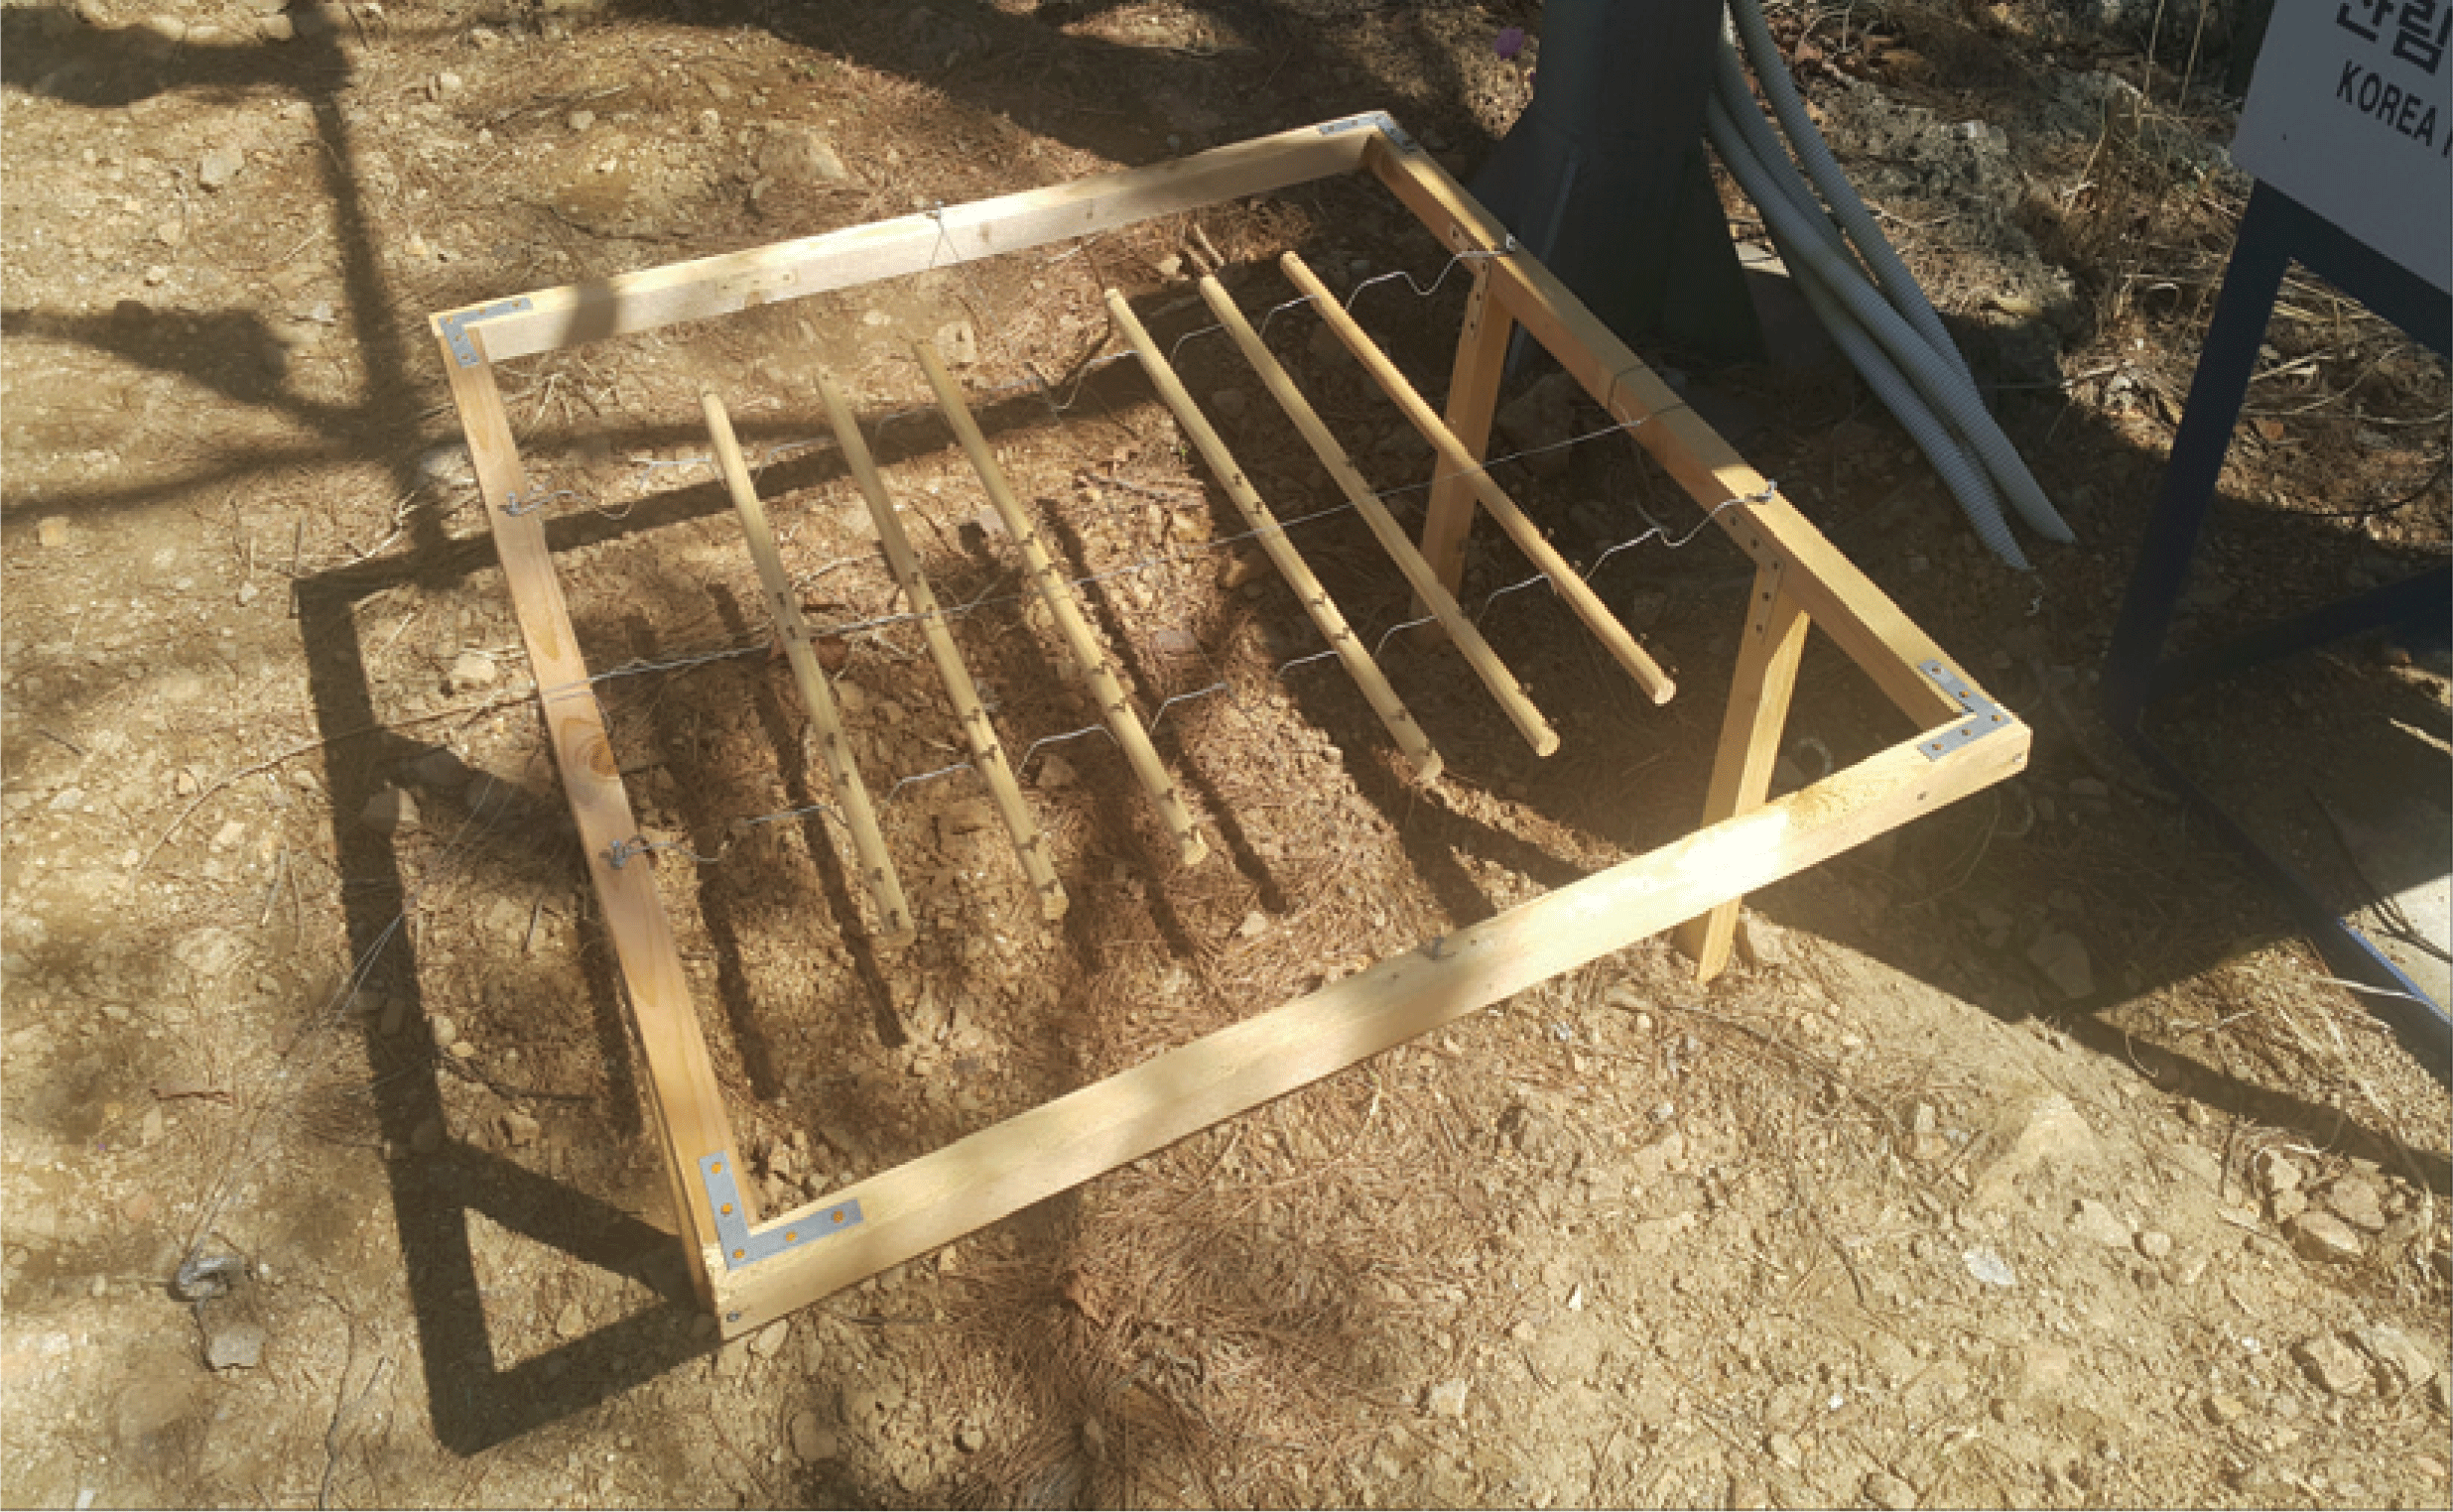
For installation, it was installed 30 cm above the ground so that it would not be affected by the change in the weight and moisture due to foreign substances. The equipment was installed according to Theodore (1965), as shown in Fig. 2.
In this study, it was necessary to establish the relationship between the change in the moisture content and the electrical resistance in forest fire surface fuels. To do that, the change in electrical resistance and weight of forest fire surface fuel was investigated in parallel. Since Stamm (1927) first proposed a method for measuring moisture content using electrical resistance, many researchers have analyzed the relationship between electrical resistance and wood moisture content (Keane, 2015). However, thereare few studies on domestic species, particularly, on moisture content of 17% or less, which have a high risk of forest fire. Thus, this study focused on this particular section to analyze the relationship involving moisture changes in an actual forest.
The measurement period was in spring (April) to monitor the Geombongsan AMOS and heliport AMOS operated by the Korea Forest Service. In fall (September), the measurement was taken at Samcheok 876 AWS which is operated by Korea Meteorological Administration by using high voltage insulation/megameter (Model: SM-8220) with total measurement number of 1,872 times; 3 times a day (3 repetition per 1 measurement) at 1000, 1400 and 1600, respectively. Table 1 is the measurement period and location.
| The period | The Location |
|---|---|
| 2017.4.3 ~ 4.13 | Mt. Geombong AMOS |
| 2017.4.3 ~ 4.28 | Heliport AMOS |
| 2017.9.12 ~ 9.22 | Samcheok University(876) AWS |
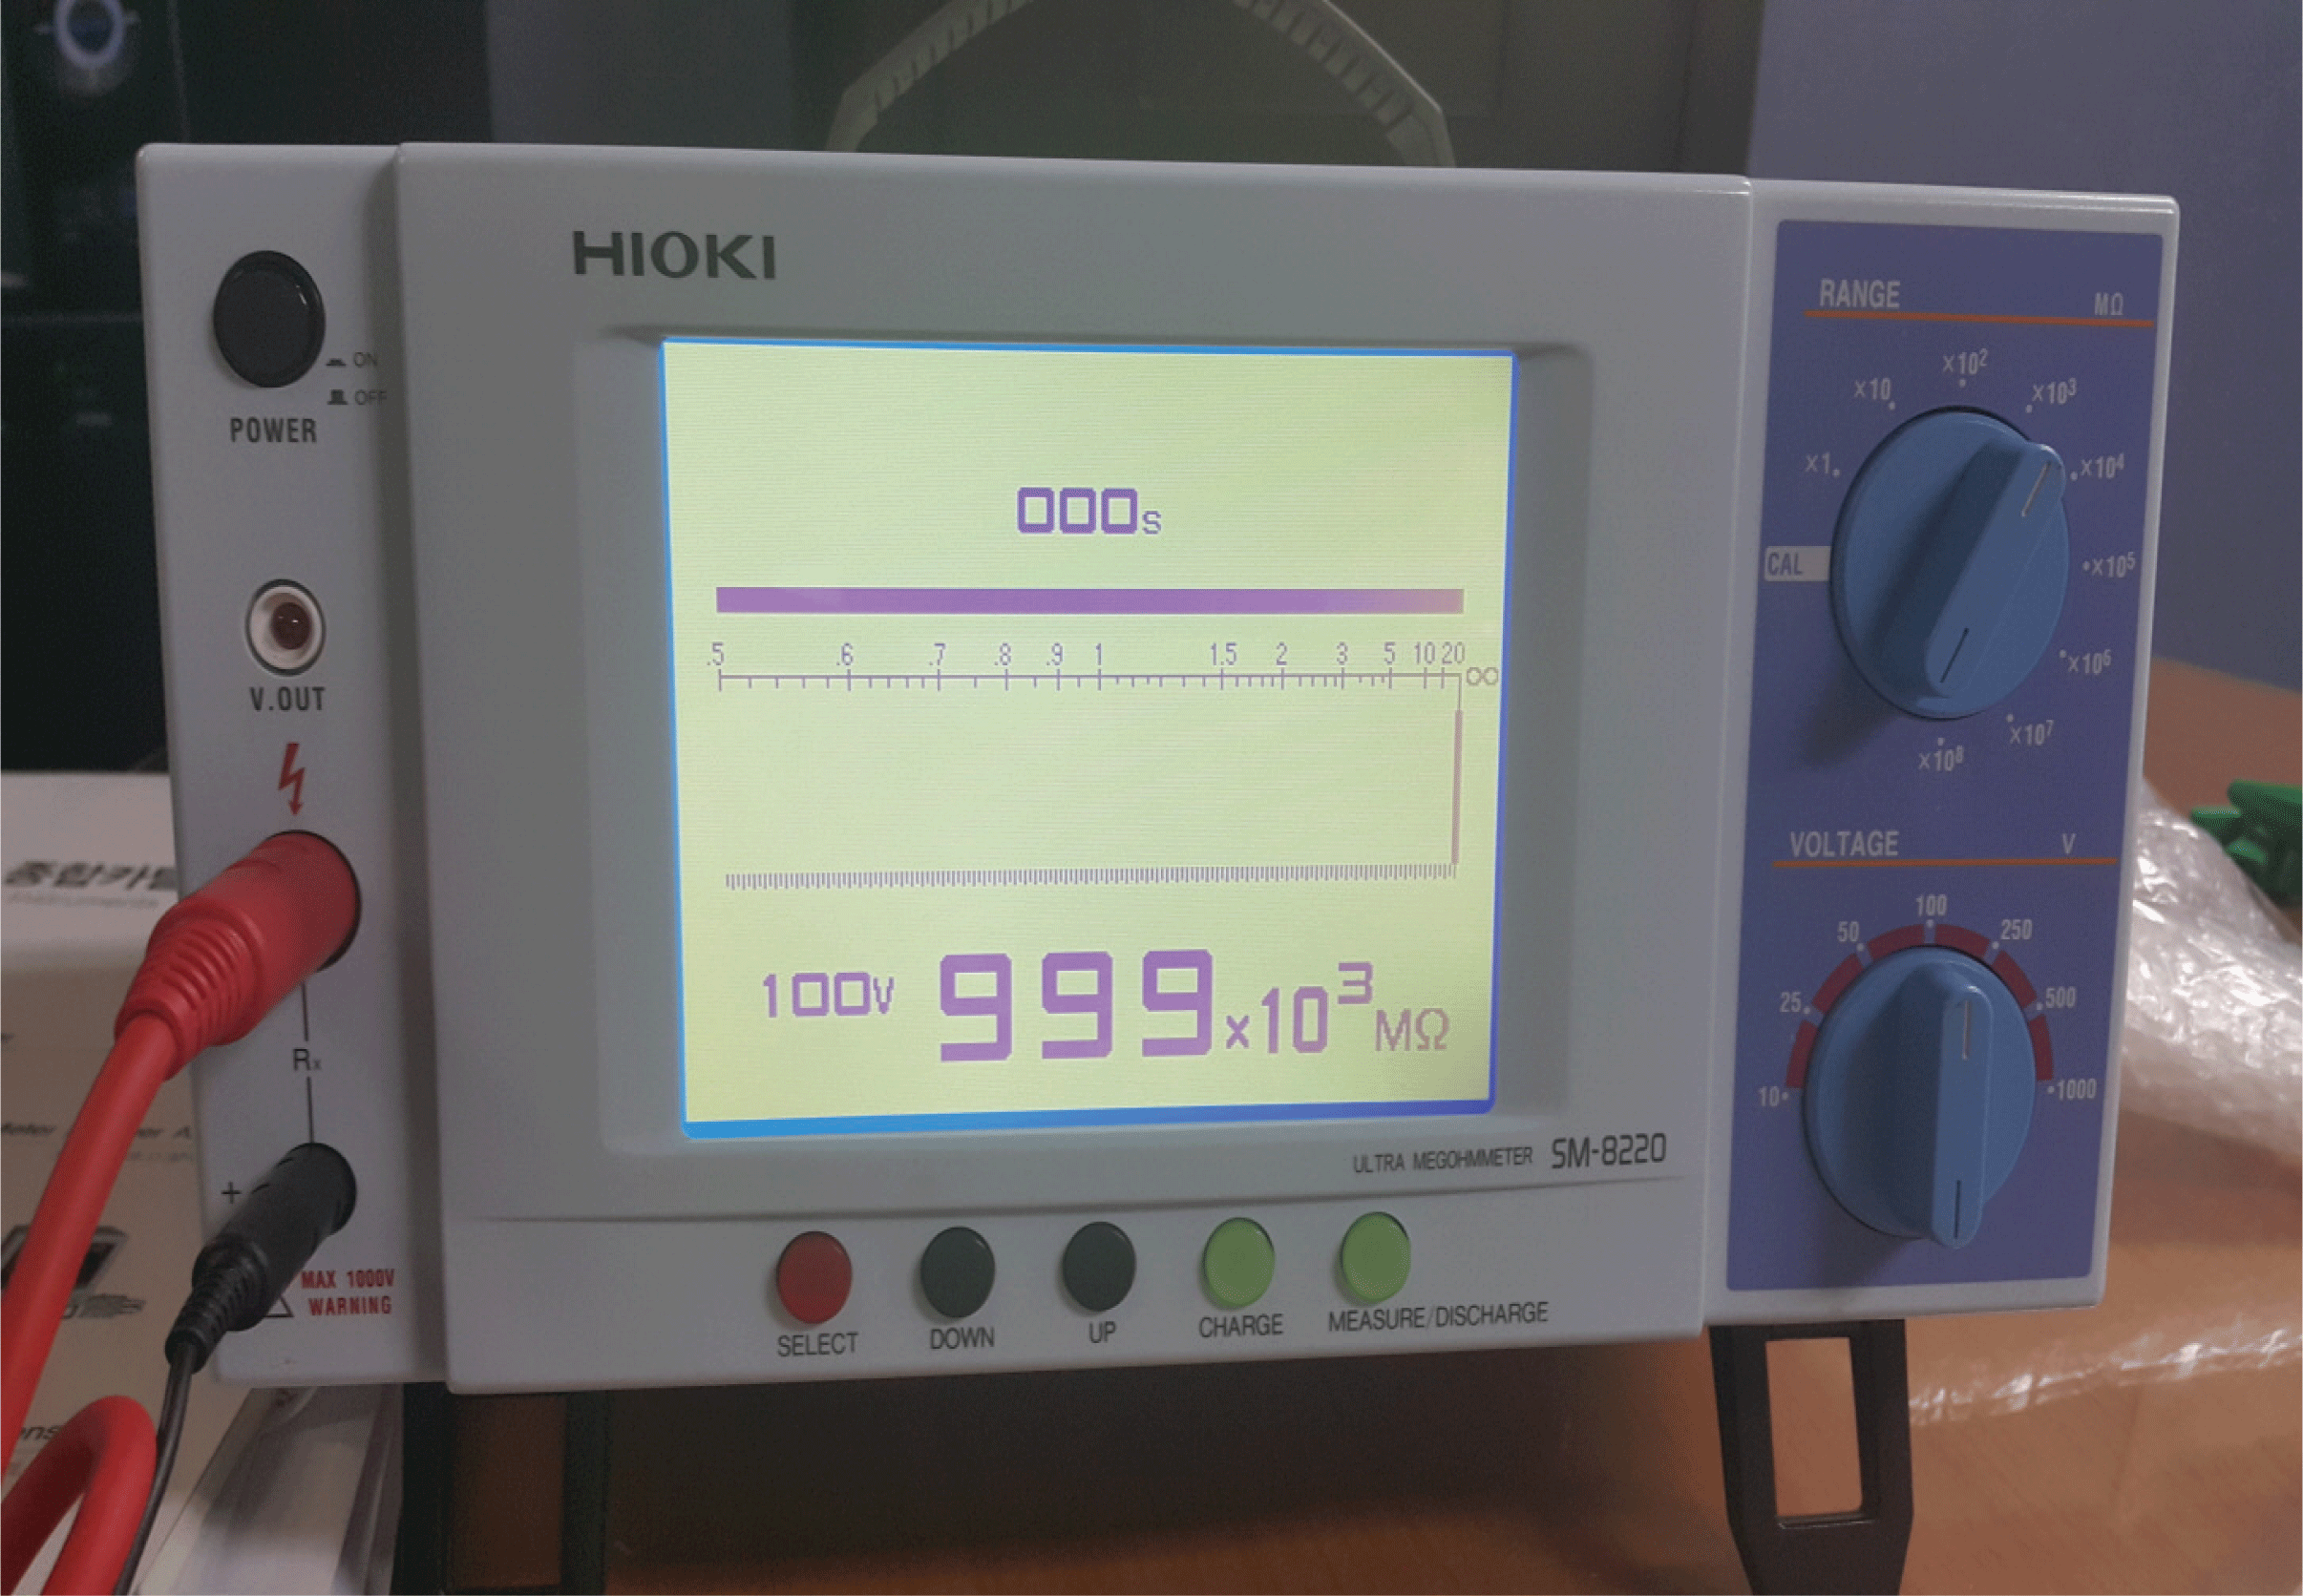
The electrical meter selected in this study was HIOKI's high voltage insulation/megameter (Model: SM-8220). This equipment is capable of measuring from 5×10⁴ ~ 2×10¹⁴Ω which covers the target range of the pine wood rod’s electrical resistance, and measured voltages of 10 V and 25 V were selected. Fig. 3 is a picture of the selected equipment.
To measure the electrical resistance, the reference voltage was measured by selecting voltages of 10 V and 25 V. The reason was that when installed in the AMOS of the weather network in the forest in the future, the AMOS would be powered by solar power, so the minimum voltage was selected in consideration of the environment in which the available power would be limited.
Oven-dry method was used after weighing the weight of the moisture content of the forest fire fuel, and an electronic scale (Model name: JW-1) of ACOM was used for weighing the proxy on-site; the scale can measure between 0-2,000 g with minimum unit of measurement of 0.1 g.
3. RESULTS and DISCUSSION
In order to develop equipmentthat predicts risk of forest fire by measuring the moisture content of forest fire fuel, which is the objective of this study, an analysis was conducted based on the classification of combustibility according to the moisture content of sediments in the forest. Table 2 shows the classification of moisture content and combustibility of sediment in the forest.
| The moisture contents | The combustibility |
|---|---|
| over 25% | incombustibility |
| 19~25% | lowest |
| 14~18% | low |
| 11~13% | middle |
| 8~10% | high |
| 2~7% | highest |
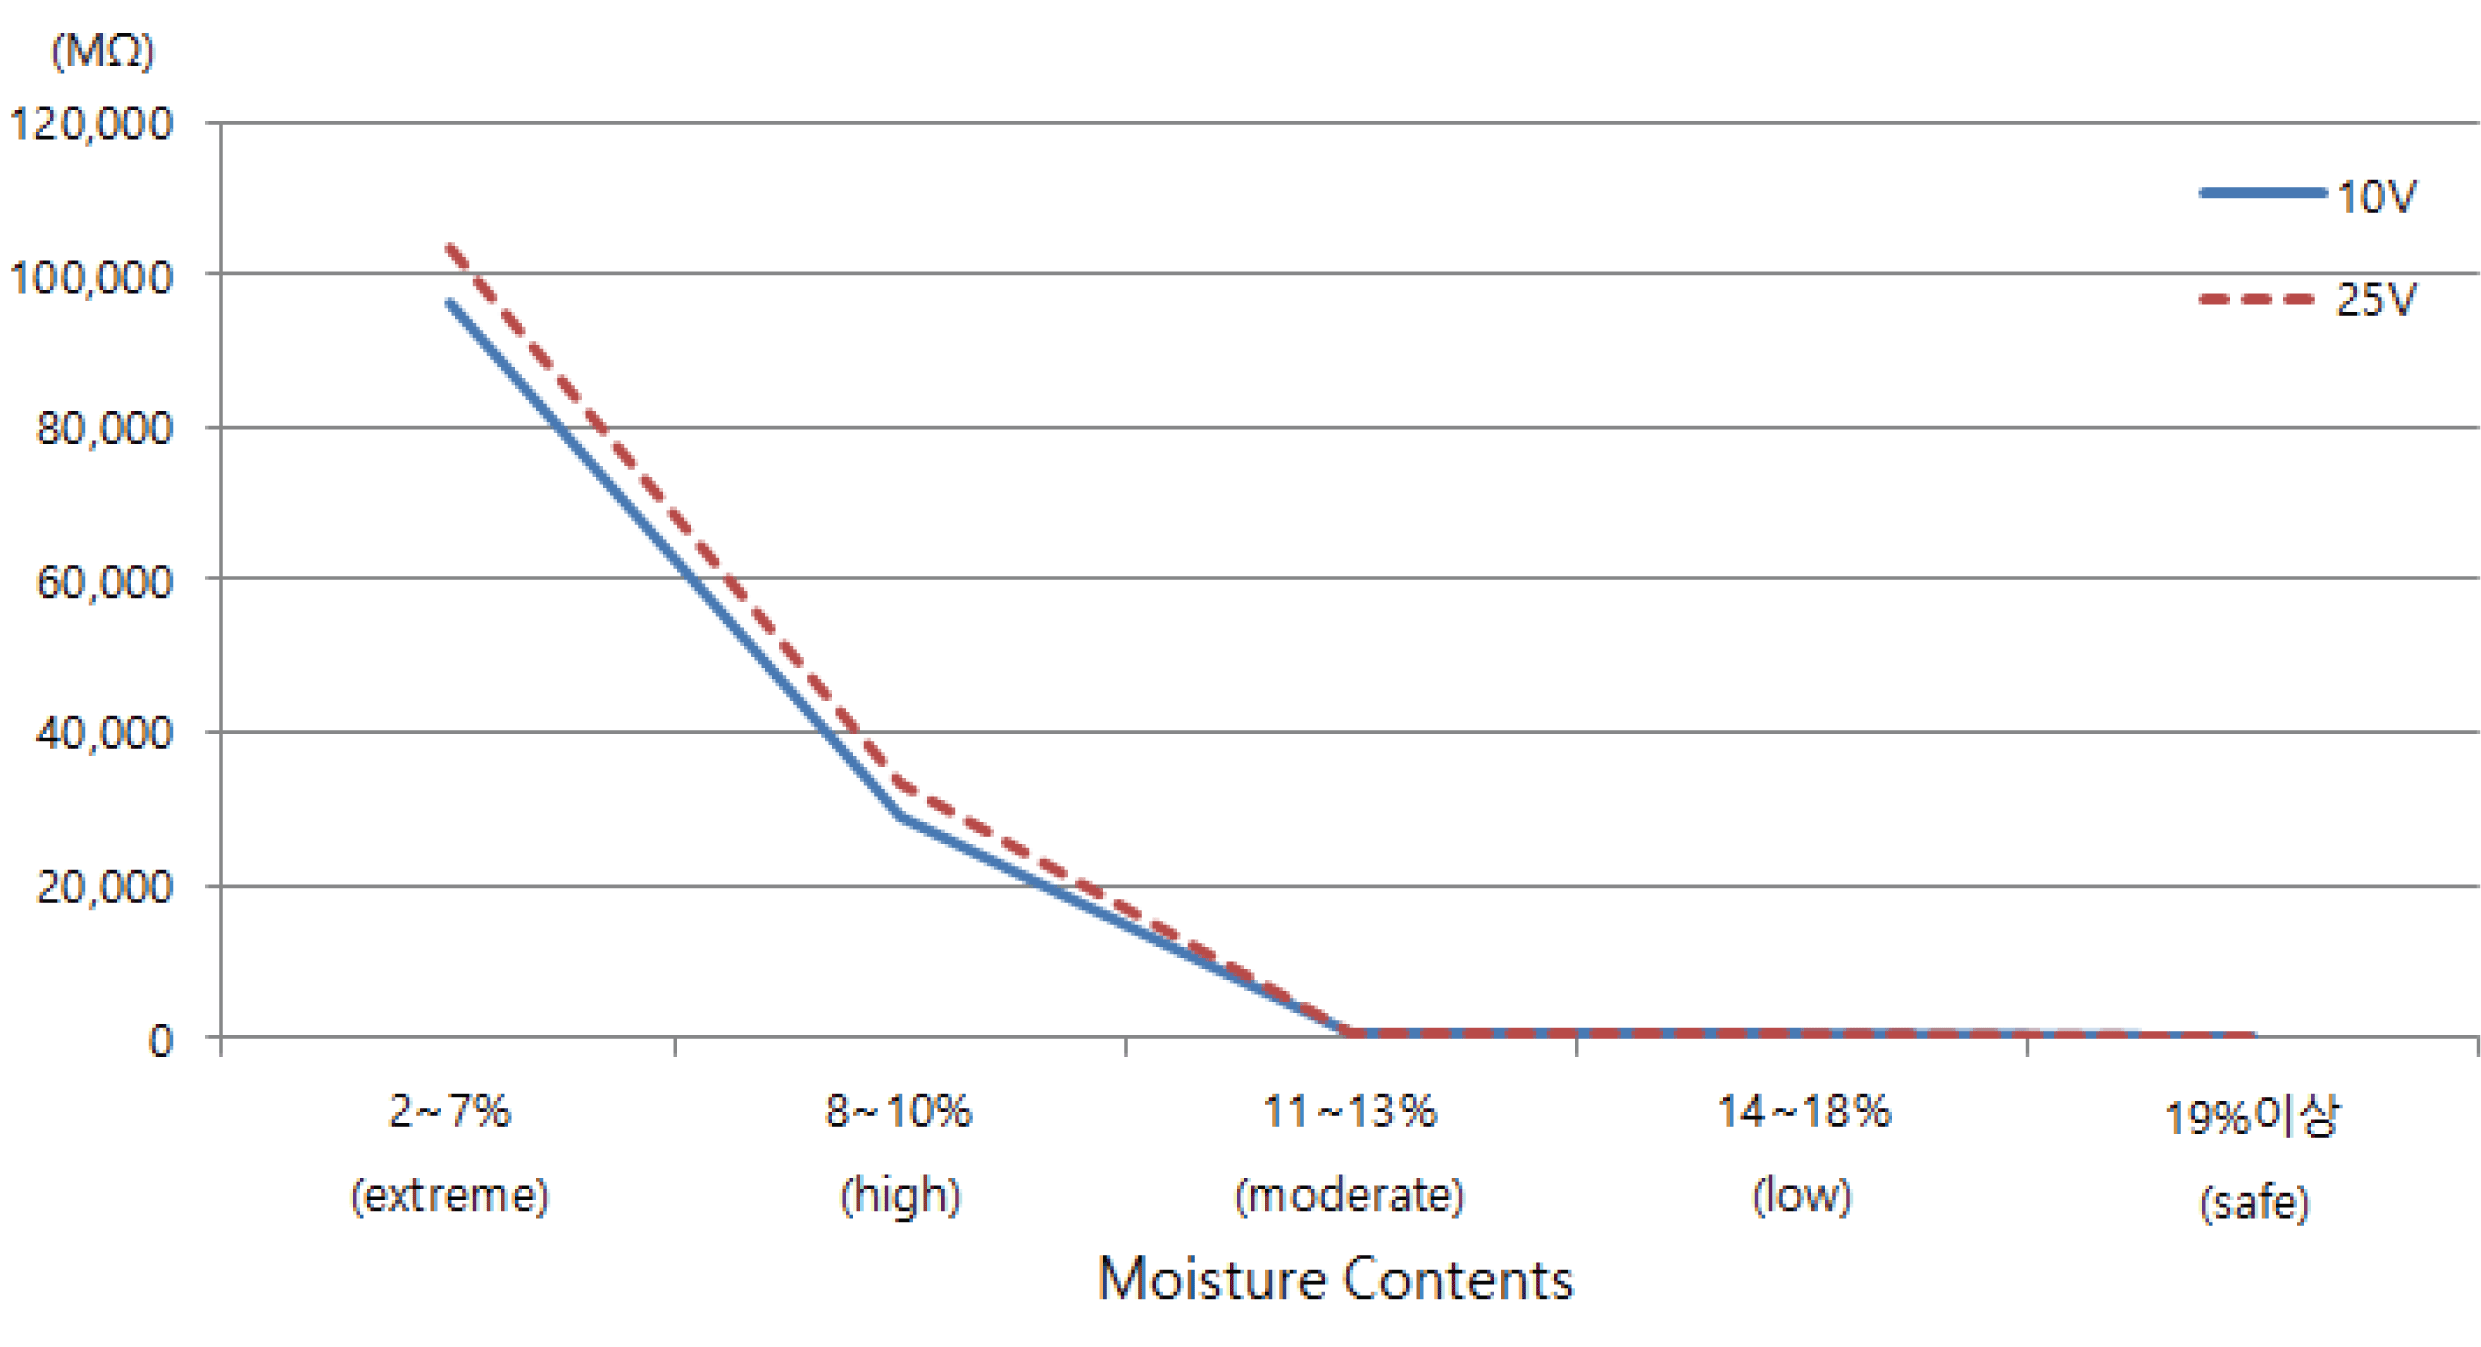
The measurements of the relationship between the electrical resistance and the moisture content in the forest fire surface fuel are shown in Fig. 4. As a result of the analysis, a conversion formula [electrical resistance = 2E+13(moisture content)-9.705] was derived (Yeom, 2018). According with this electric resistance conversion formula, the moisture content of the forest fire fuel was measured, which is the technology this study intends to develop. Then, to derive the forest fire risk, the electrical resistance values were analyzed according to the flammability classification that is based on the moisture content of forest fire surface fuel. As a result, the measured electrical resistance of 10V showed a distribution of resistance values of 376MΩ to 269,734MΩ at a moisture content of 2 to 7%, classified as ‘highest combustibility’, and the average resistance was 96,489MΩ. The distribution of resistance values of 409MΩ to 192,3501MΩ was observed in the moisture content of 8-10%, which is the ‘high level’ category, and the average resistance was measured to be 28,820MΩ. In addition, the distribution of 89 MΩ to 4,923 MΩ was shown in the moisture content of 11 to 13%, which is the ‘middle’ category, and the average resistance value was measured to be 752 MΩ, and the distribution of 7 MΩ to 1,075 MΩ in the moisture content of 14 to 18%, which is the ‘low’ category, and the average resistance was measured to be 418MΩ. The distribution of 1M Ω to 458MΩ was found at a moisture content of 19% or higher, which is classified as “lowest” to “incombustibility,” and the average resistance was measured to be 43MΩ.
The measured electrical resistance of 25V showed a resistance distribution of 346 MΩ to 292,083 MΩ at a moisture content of 2 to 7% classified as ‘highest combustibility’, and the average resistance was 103,373 MΩ. The resistance value distribution was measured to be 401MΩ to 192,833MΩ at a moisture content of 8 to 10%, which is classified as ‘high’, and the average resistance value was measured to be 33,334M Ω. In addition, the distribution of 92 MΩ to 1,111 MΩ at the moisture content of 11 to 13%, which is the ‘middle’ category, and the average resistance value was measured to be 492 MΩ, and the distribution of 7 MΩ to 1,017 MΩ in the moisture content of 14 to 18%, which is the ‘low’ category. And the average resistance was measured to be 459 MΩ. A distribution of 1Ω~427MΩ was shown at a moisture content of 19% or higher, which is classified as “lowest” to “incombustibility,” and the average resistance was measured to be 75MΩ. Table 3 below is the result of classifying electrical resistance according to incombustibility. In addition, in consideration of the environment in which the resulting measurement materials of this study can actually be installed, it is necessary to set the voltage value for measuring the electrical resistance to be used for the actual moisture content measurement, so the currently investigated 10 V and 20 V environments were analyzed. The results are shown in Fig. 5. As a result of comparing the voltages of 10 V and 25 V to select the voltage given when measuring resistance, the measured values of electrical resistance of 10 V and 25 V have similar slopes, and when considering the electrical facilities and environmental factors of the installation site, 10 V would not have any issues. Since the mountain weather observation network is currently operated by solar power, the fuel moisture must be measured with a lowest voltage. Therefore, the measurement voltage for the equipment to be developed in this study was selected to be 10 V.
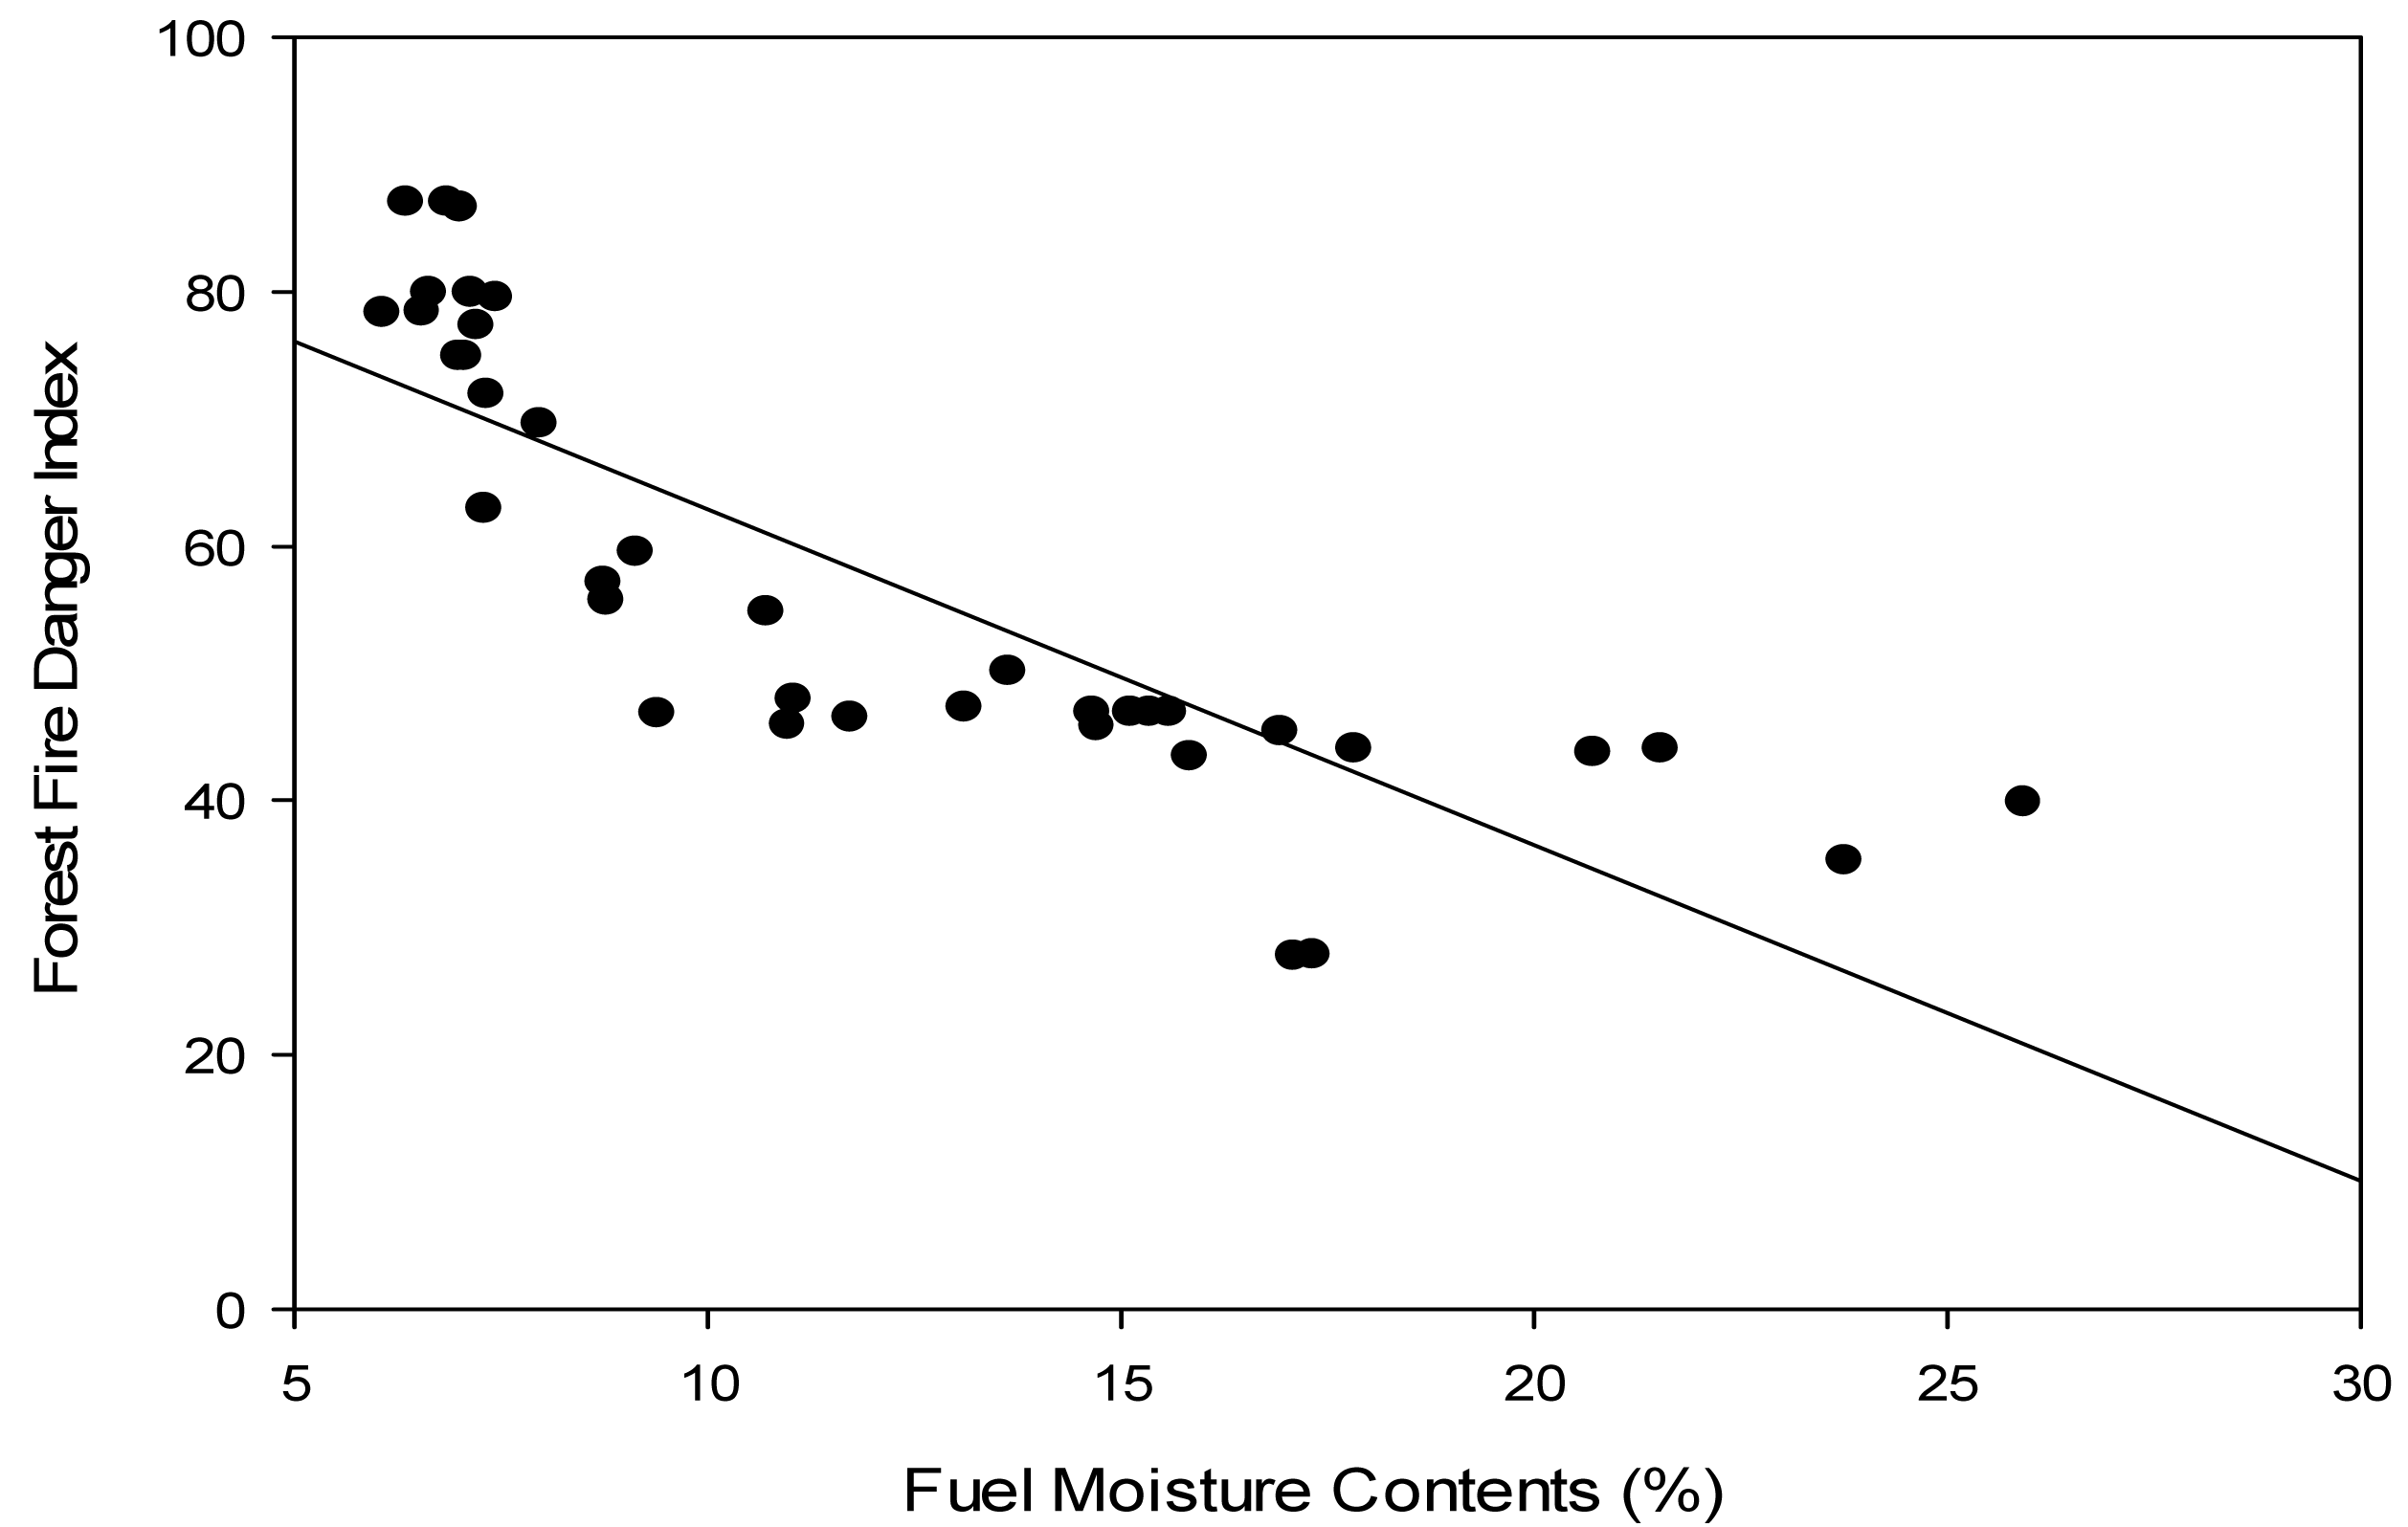
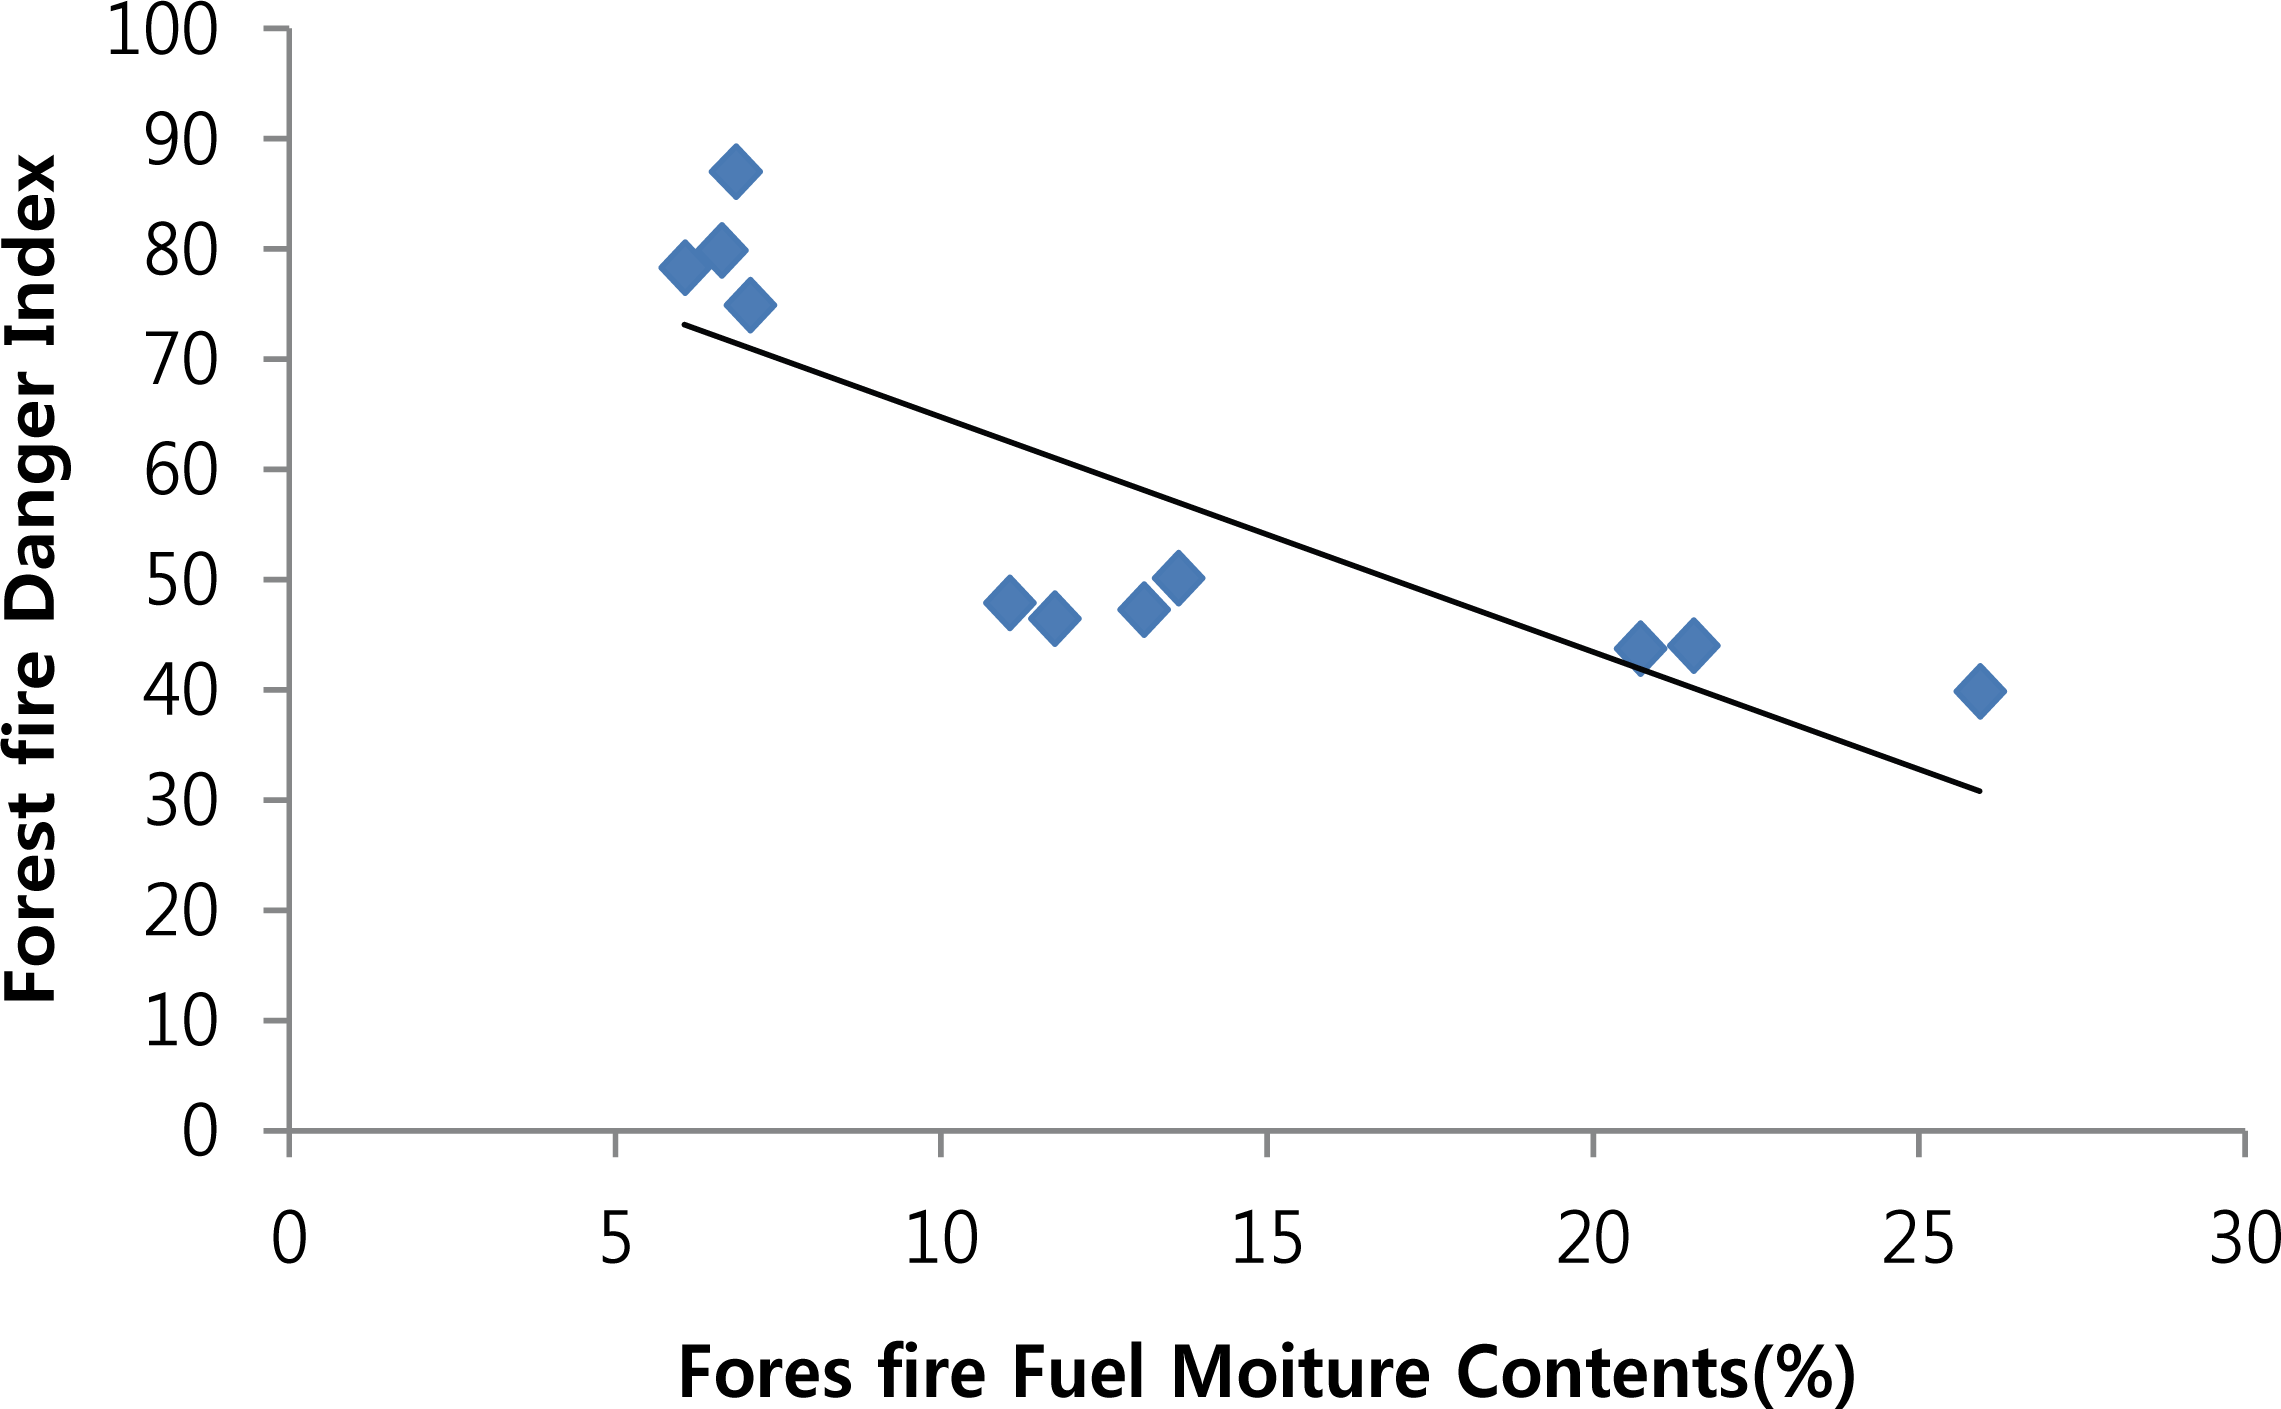
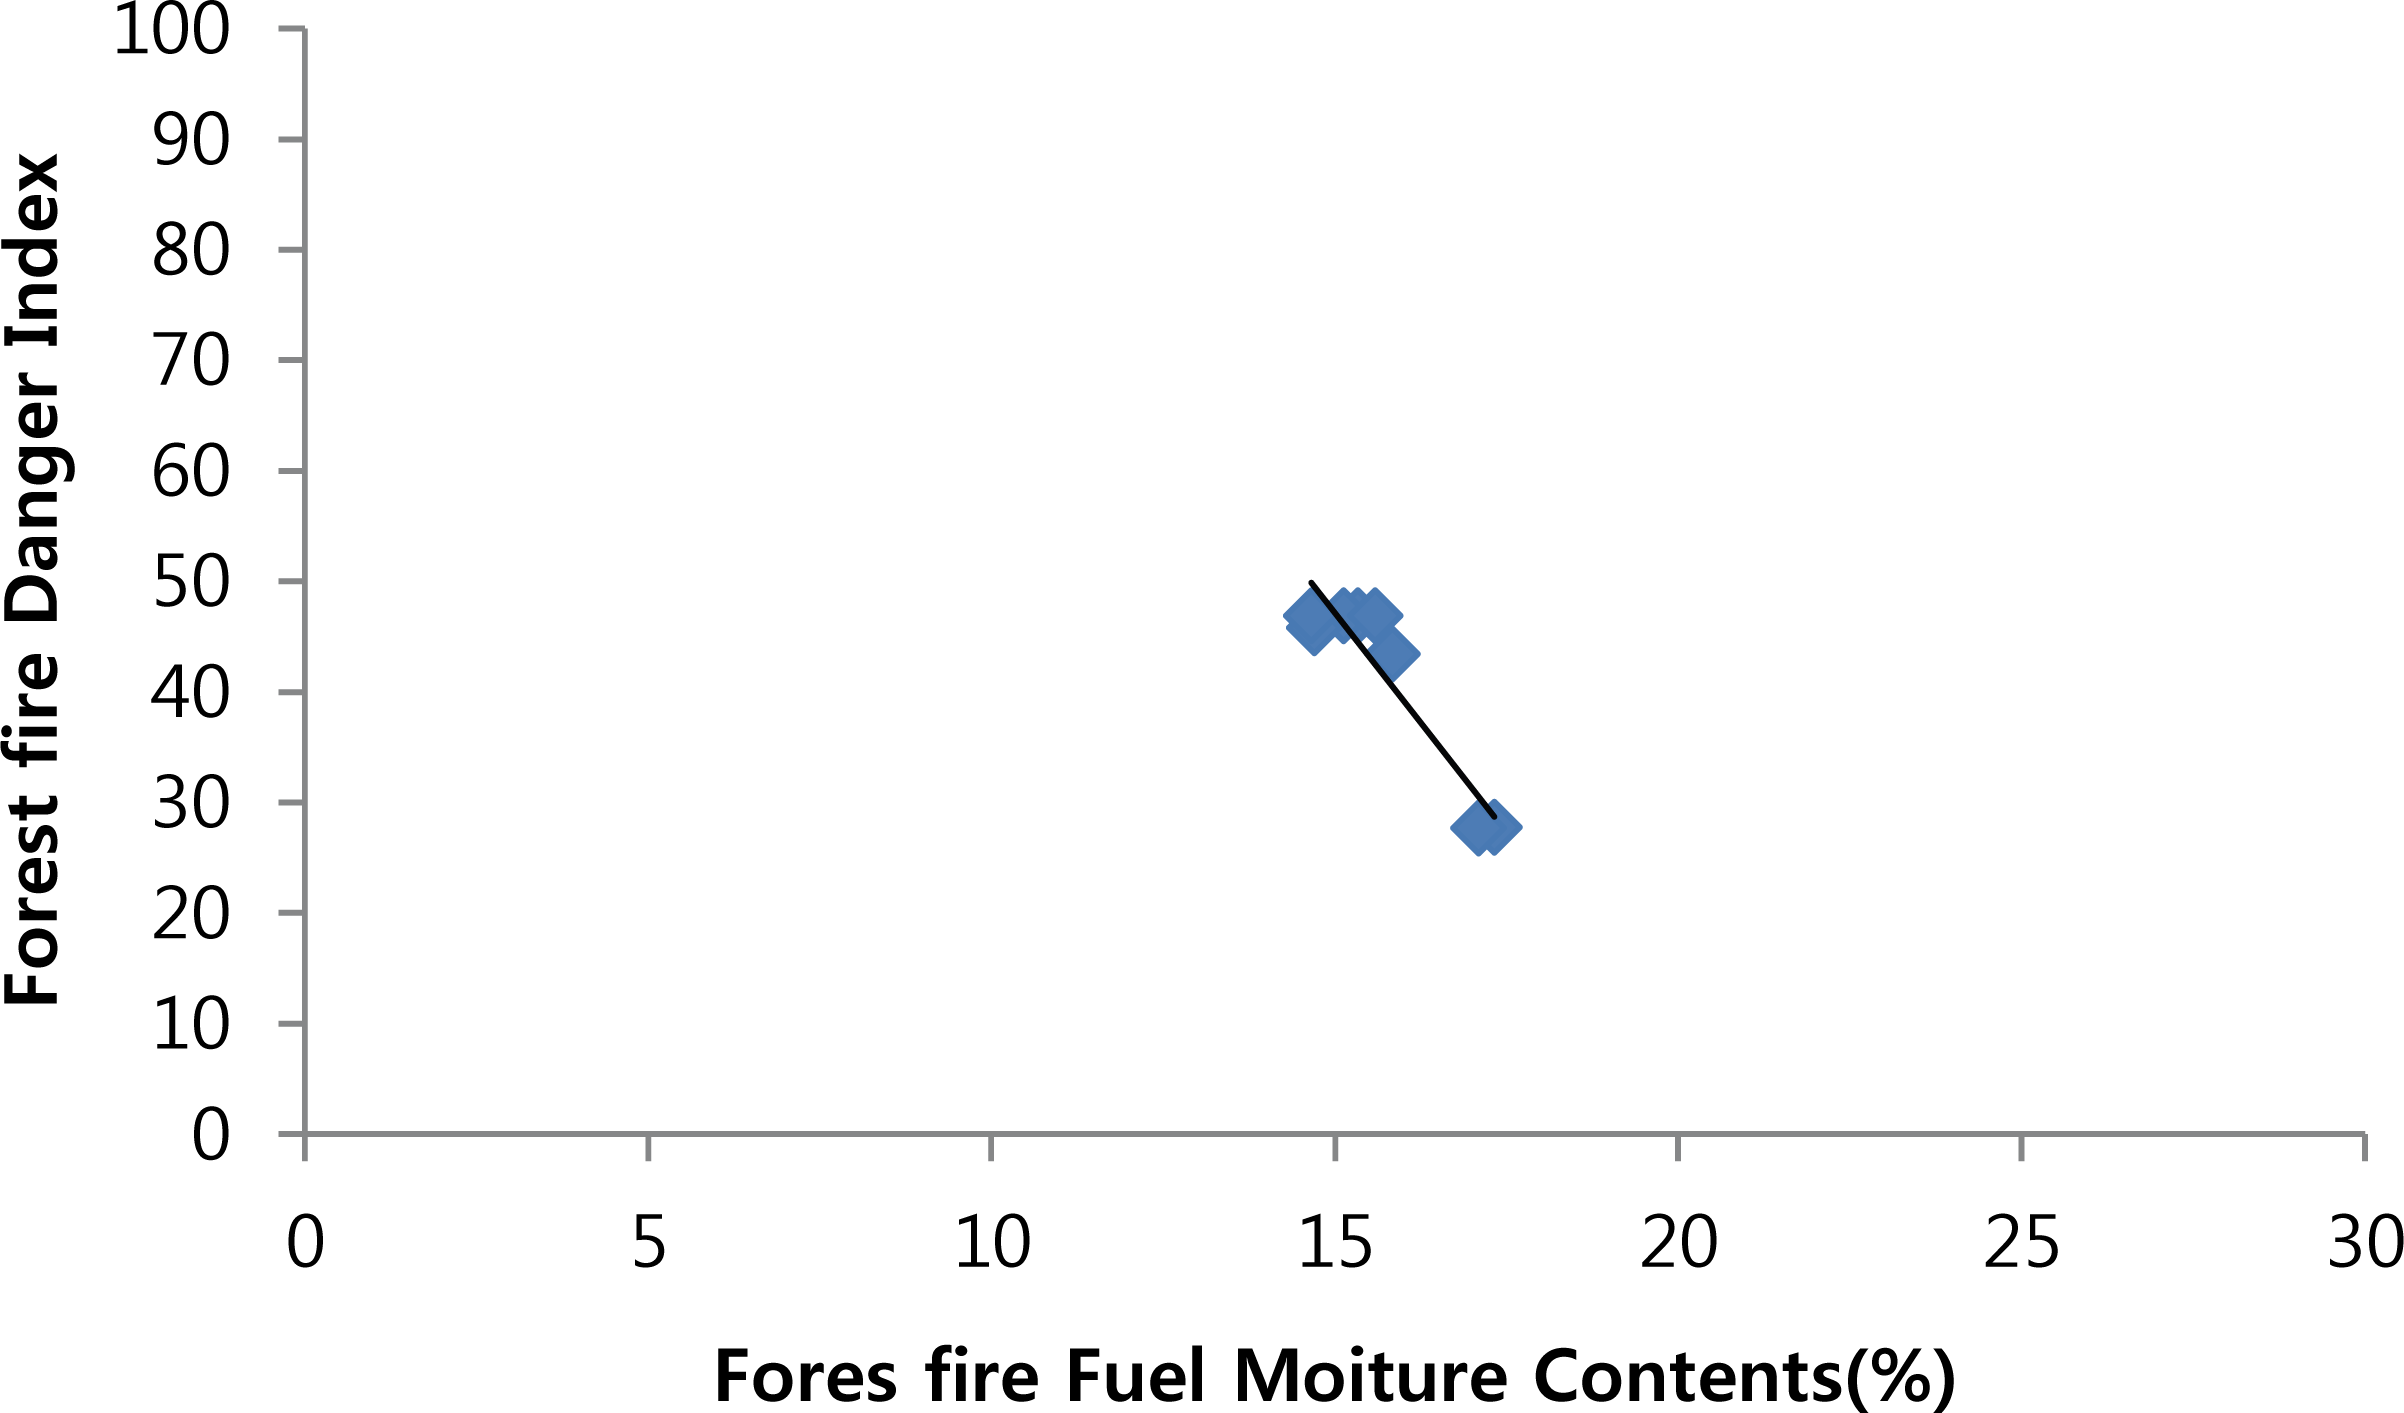
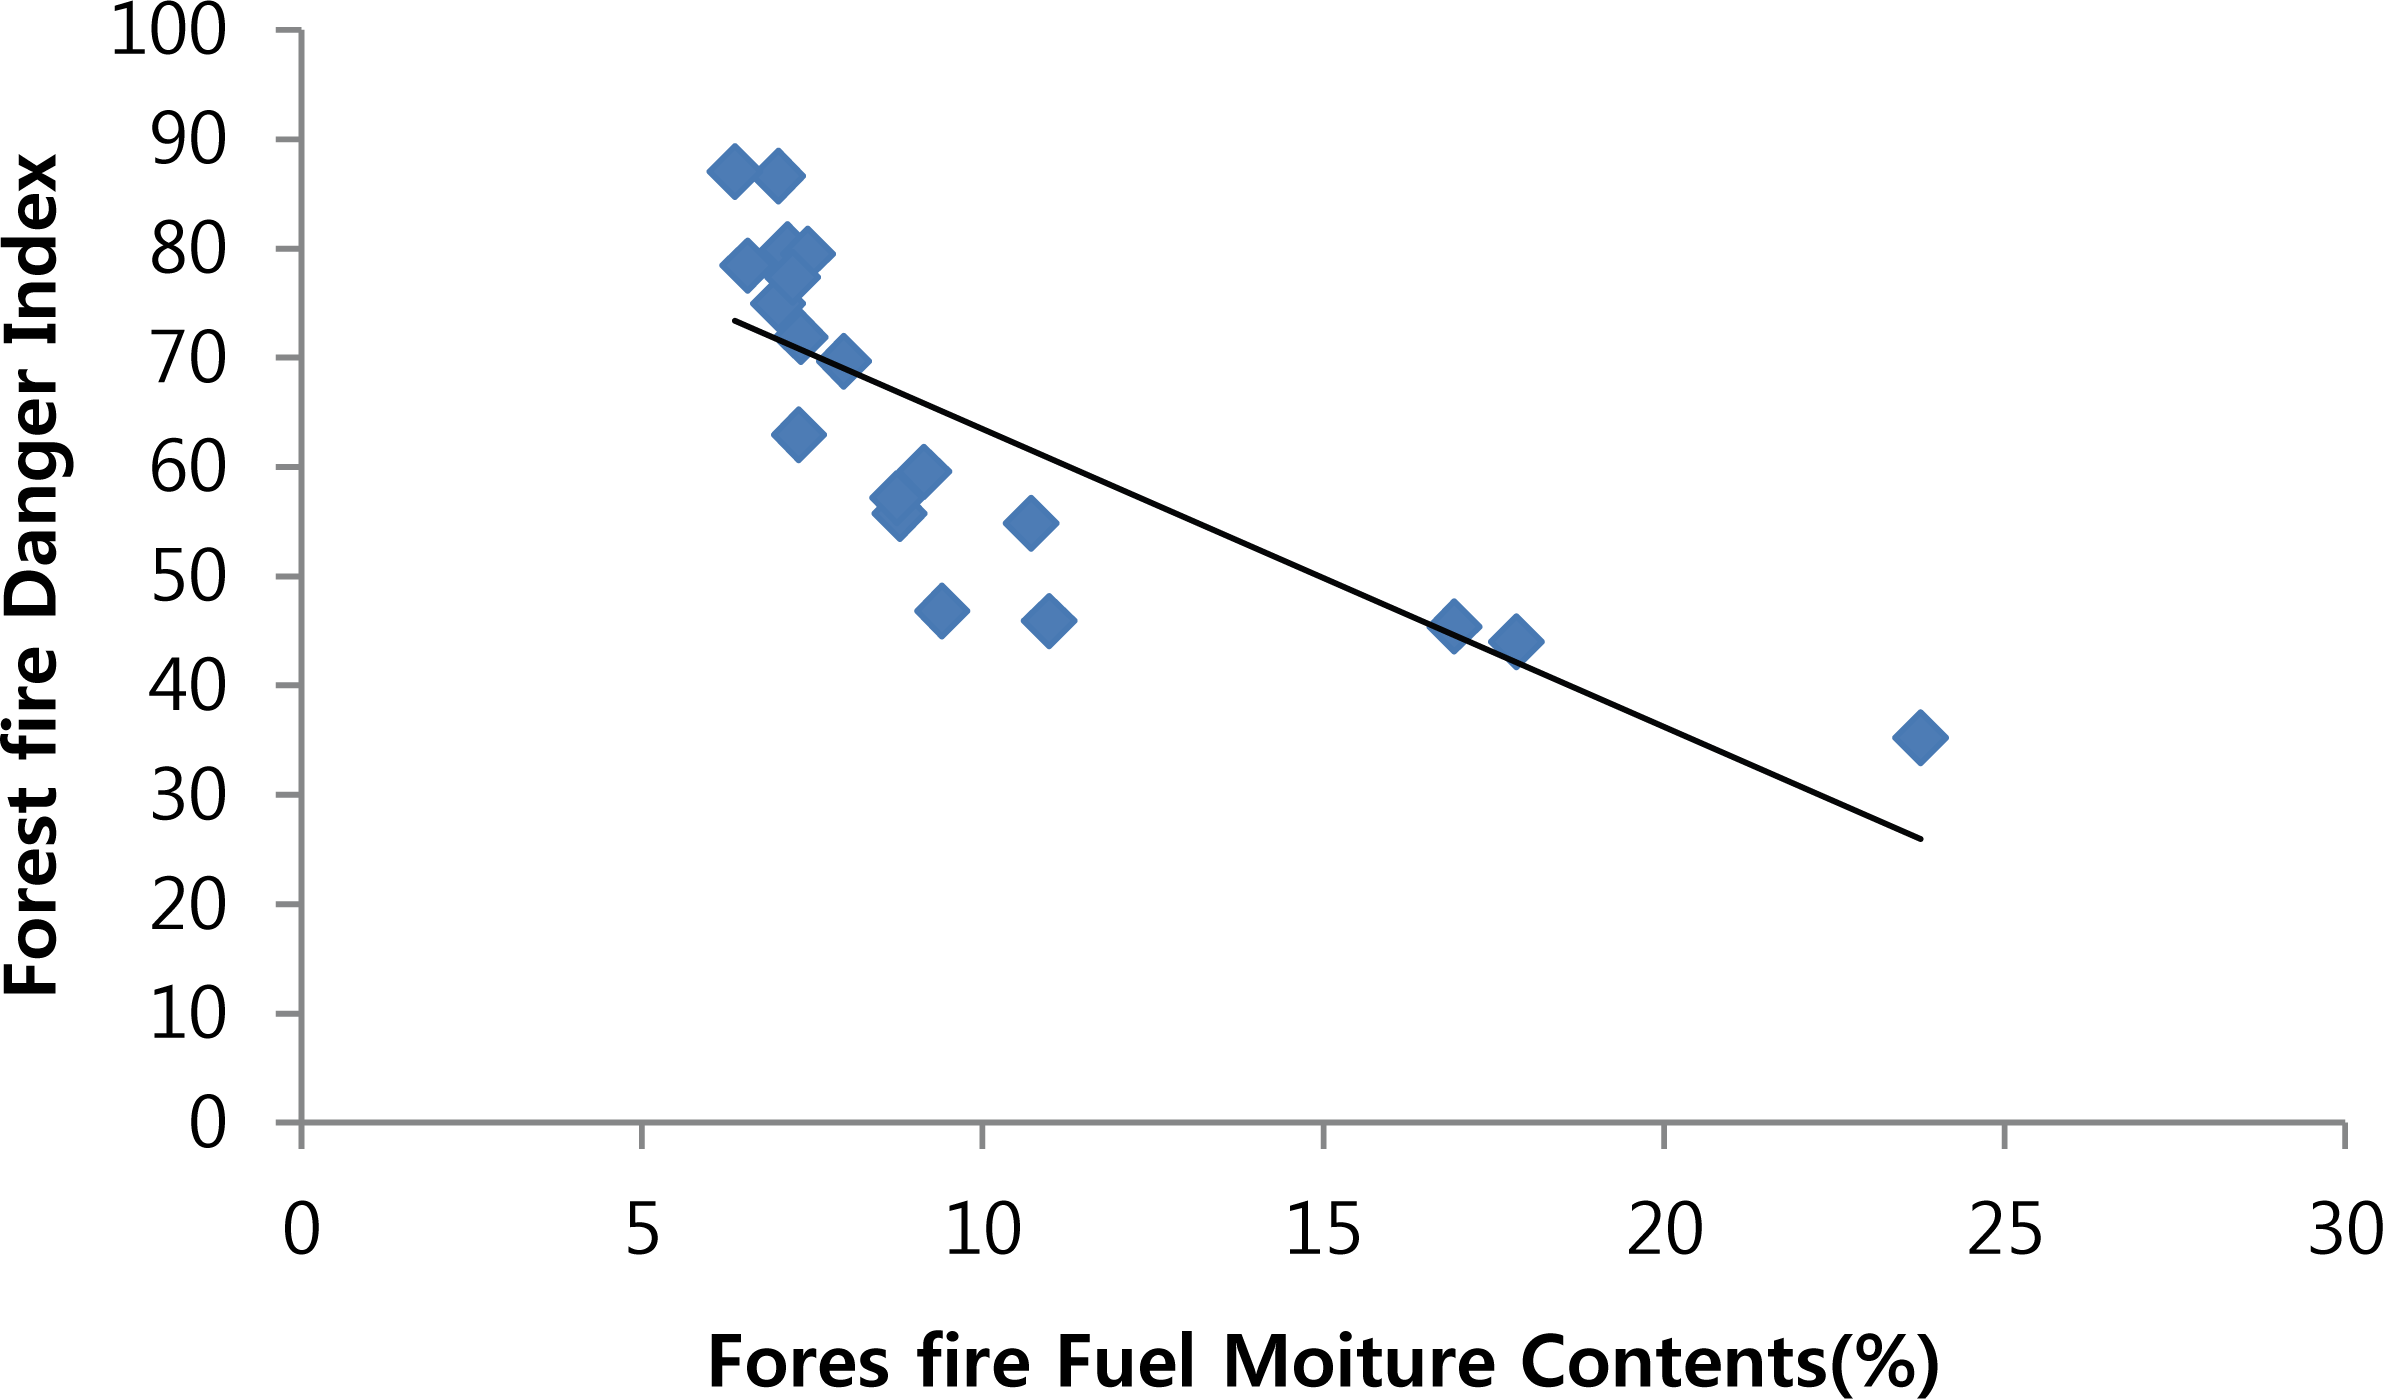
The verification of the forest fire fuel moisture measured by the change in electrical resistance was analyzed by its correlation with the Forest Fire Danger Index of Korea Forest Service currently in operation. As a result of applying the forest fire risk index of the National Institute of Forest Science (NIFoS), the average of the forest fire risk index in Wondeok-eup, Samcheok-si, during the spring fire warning period was 47.11, which was a ‘low’ grade, and the maximum value was 87.50 (at 1300 and 1500 on April 4) and the minimum value was 20.70. The correlation between the forest fire fuel moisture (Gumbongsan AMOS, heliport AMOS, pine forest on campus at Kangwon National University Samcheok Campus) and the forest fire risk index (Wondeok-eup, Gyo-dong, Samcheok-si) investigated in this study is shown in Fig. 6. As a result of the analysis, there was a negative correlation with 99% confidence level (R2=0.824). Therefore, the forest fire fuel moisturemeasured at the Geombongsan AMOS and the Heliport AMOS during the spring fire warning period and the forest fire fuel moisture measured at the pine forest within Kangwon National University Samcheok Campus during the forest fire warning period in the fall had a significant correlation with the forest fire risk index of the region (Wondeok-eup, Samcheok-si, Gyo-dong, Samcheok-si). This can be interpreted as having a correlation with the prediction of forest fire occurrence, which is the result of this study, and serve as basic data that can supplement the forest fire risk index in the future. In addition, the results of direct comparison on whether the measured data of forest fuel moisture is related to hourly or daily changes in the actual forest fire risk index are shown in Fig. 7, Fig. 8, and Fig. 9. According to these results, the measured forest fire fuel moisture in the forest responded similarly to the forest fire risk index of Korea Forest Service.
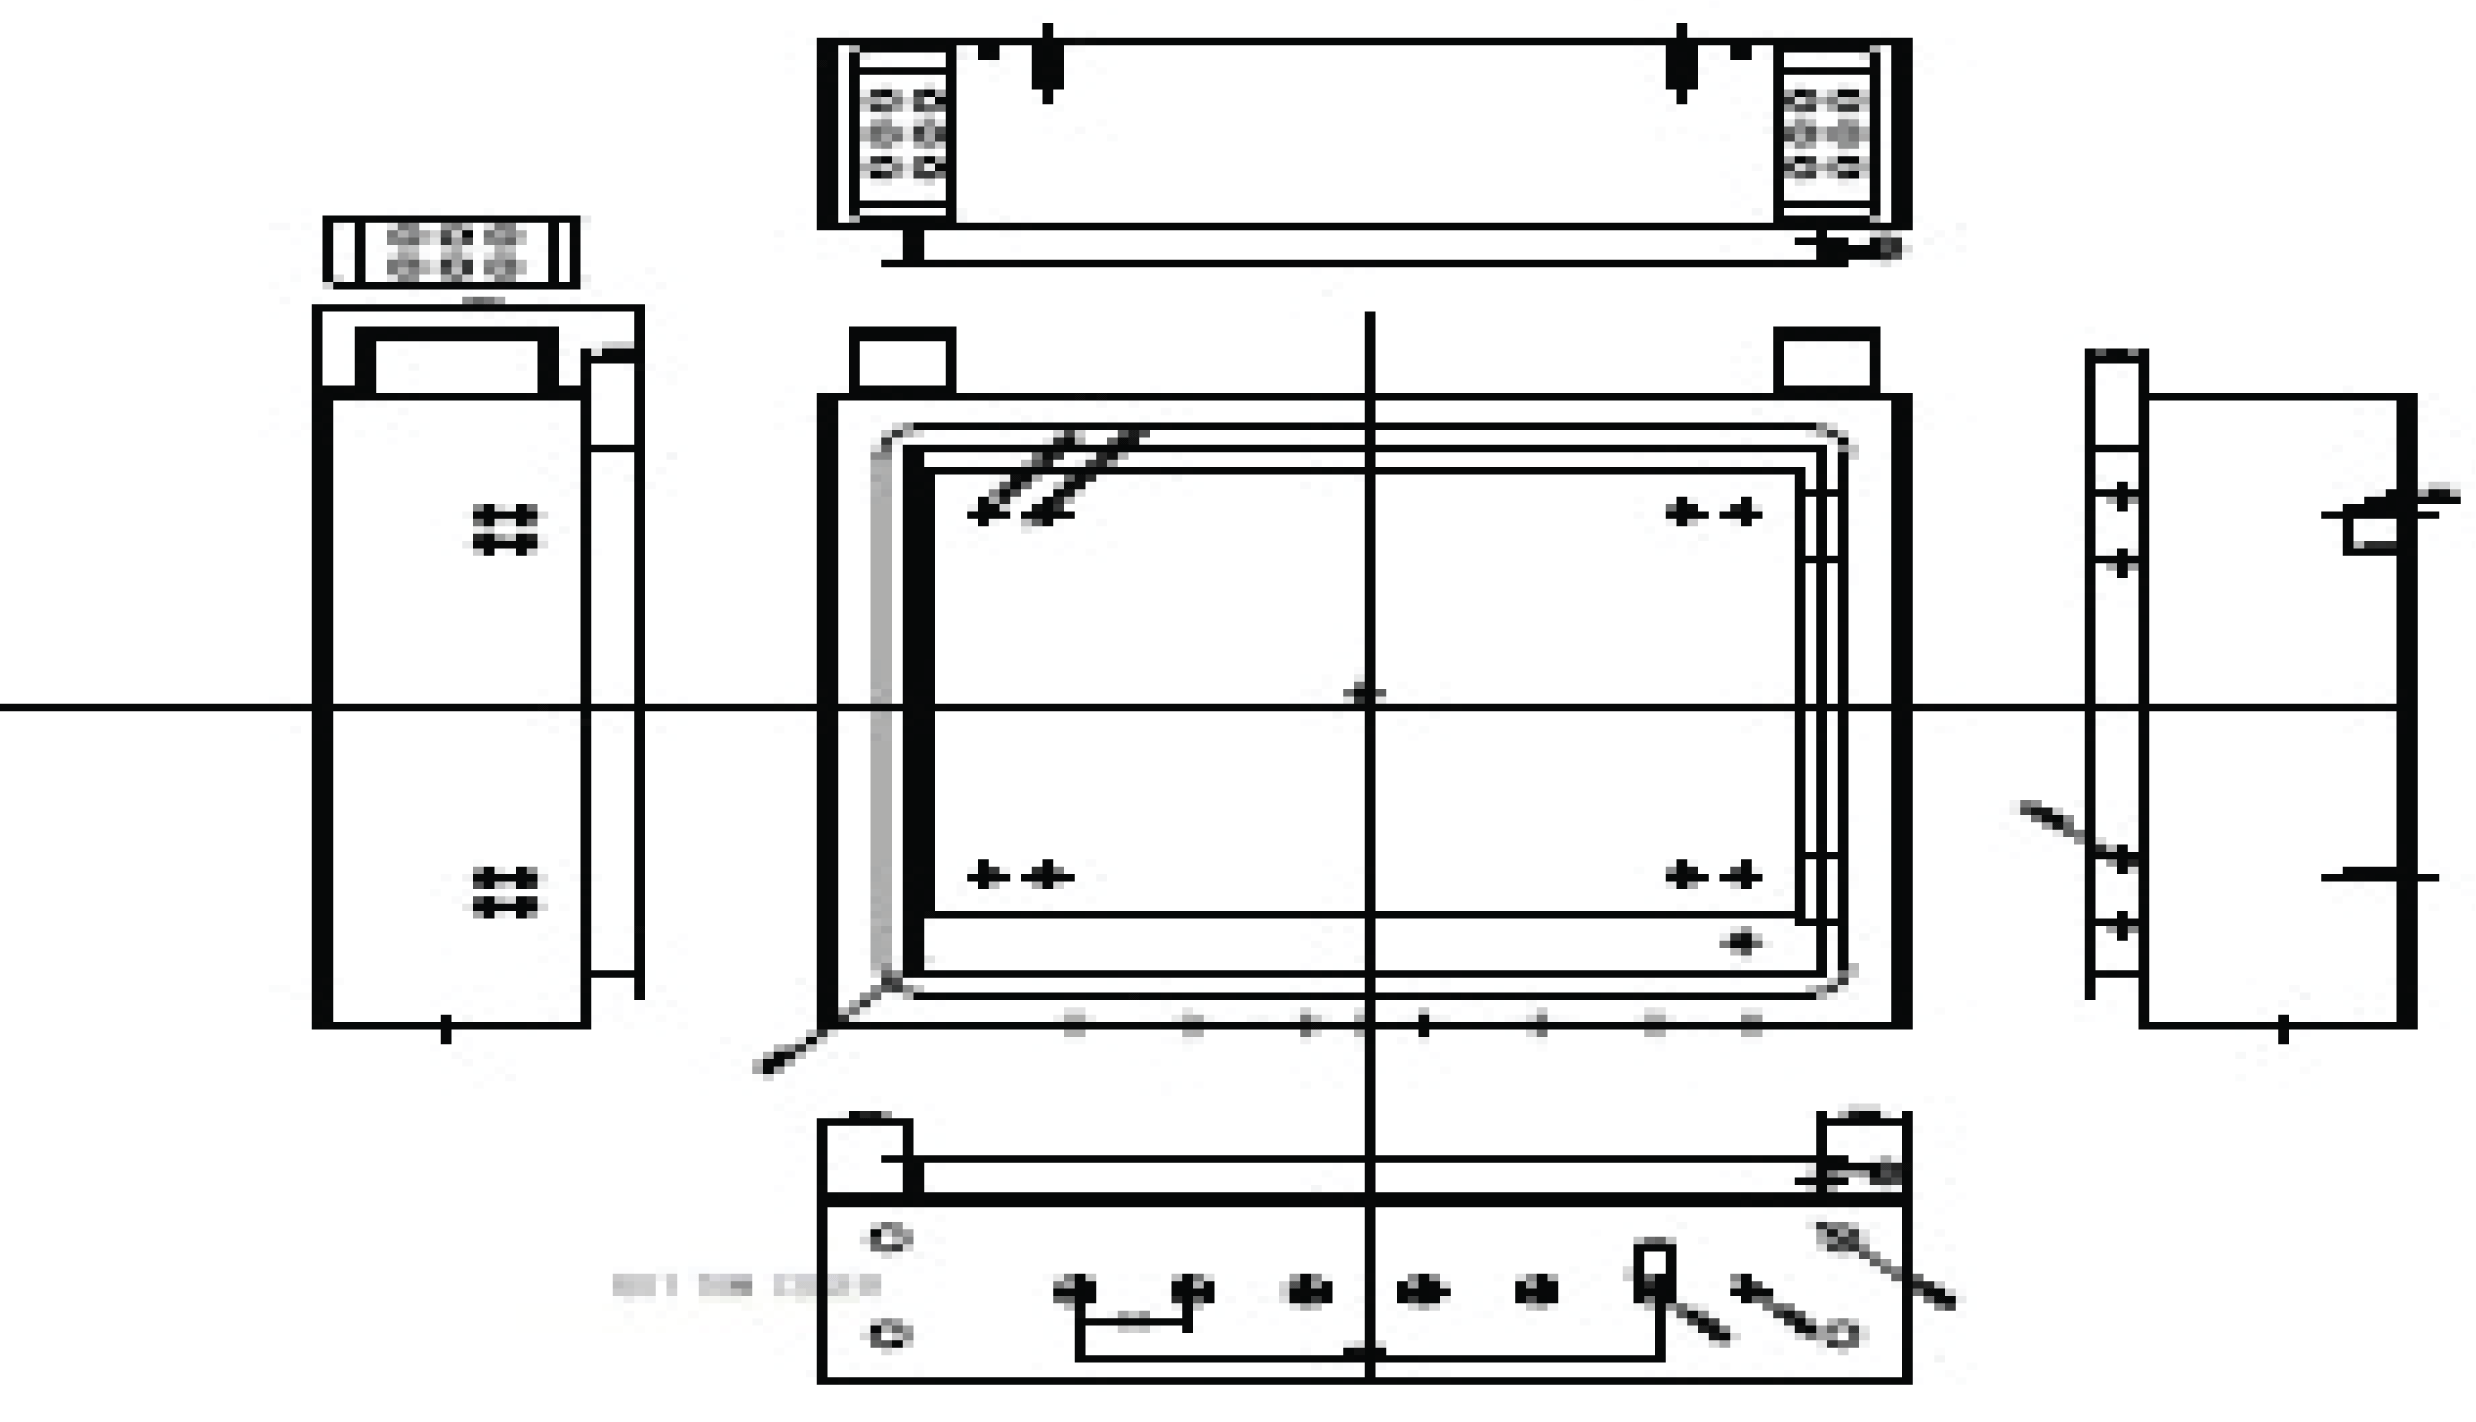
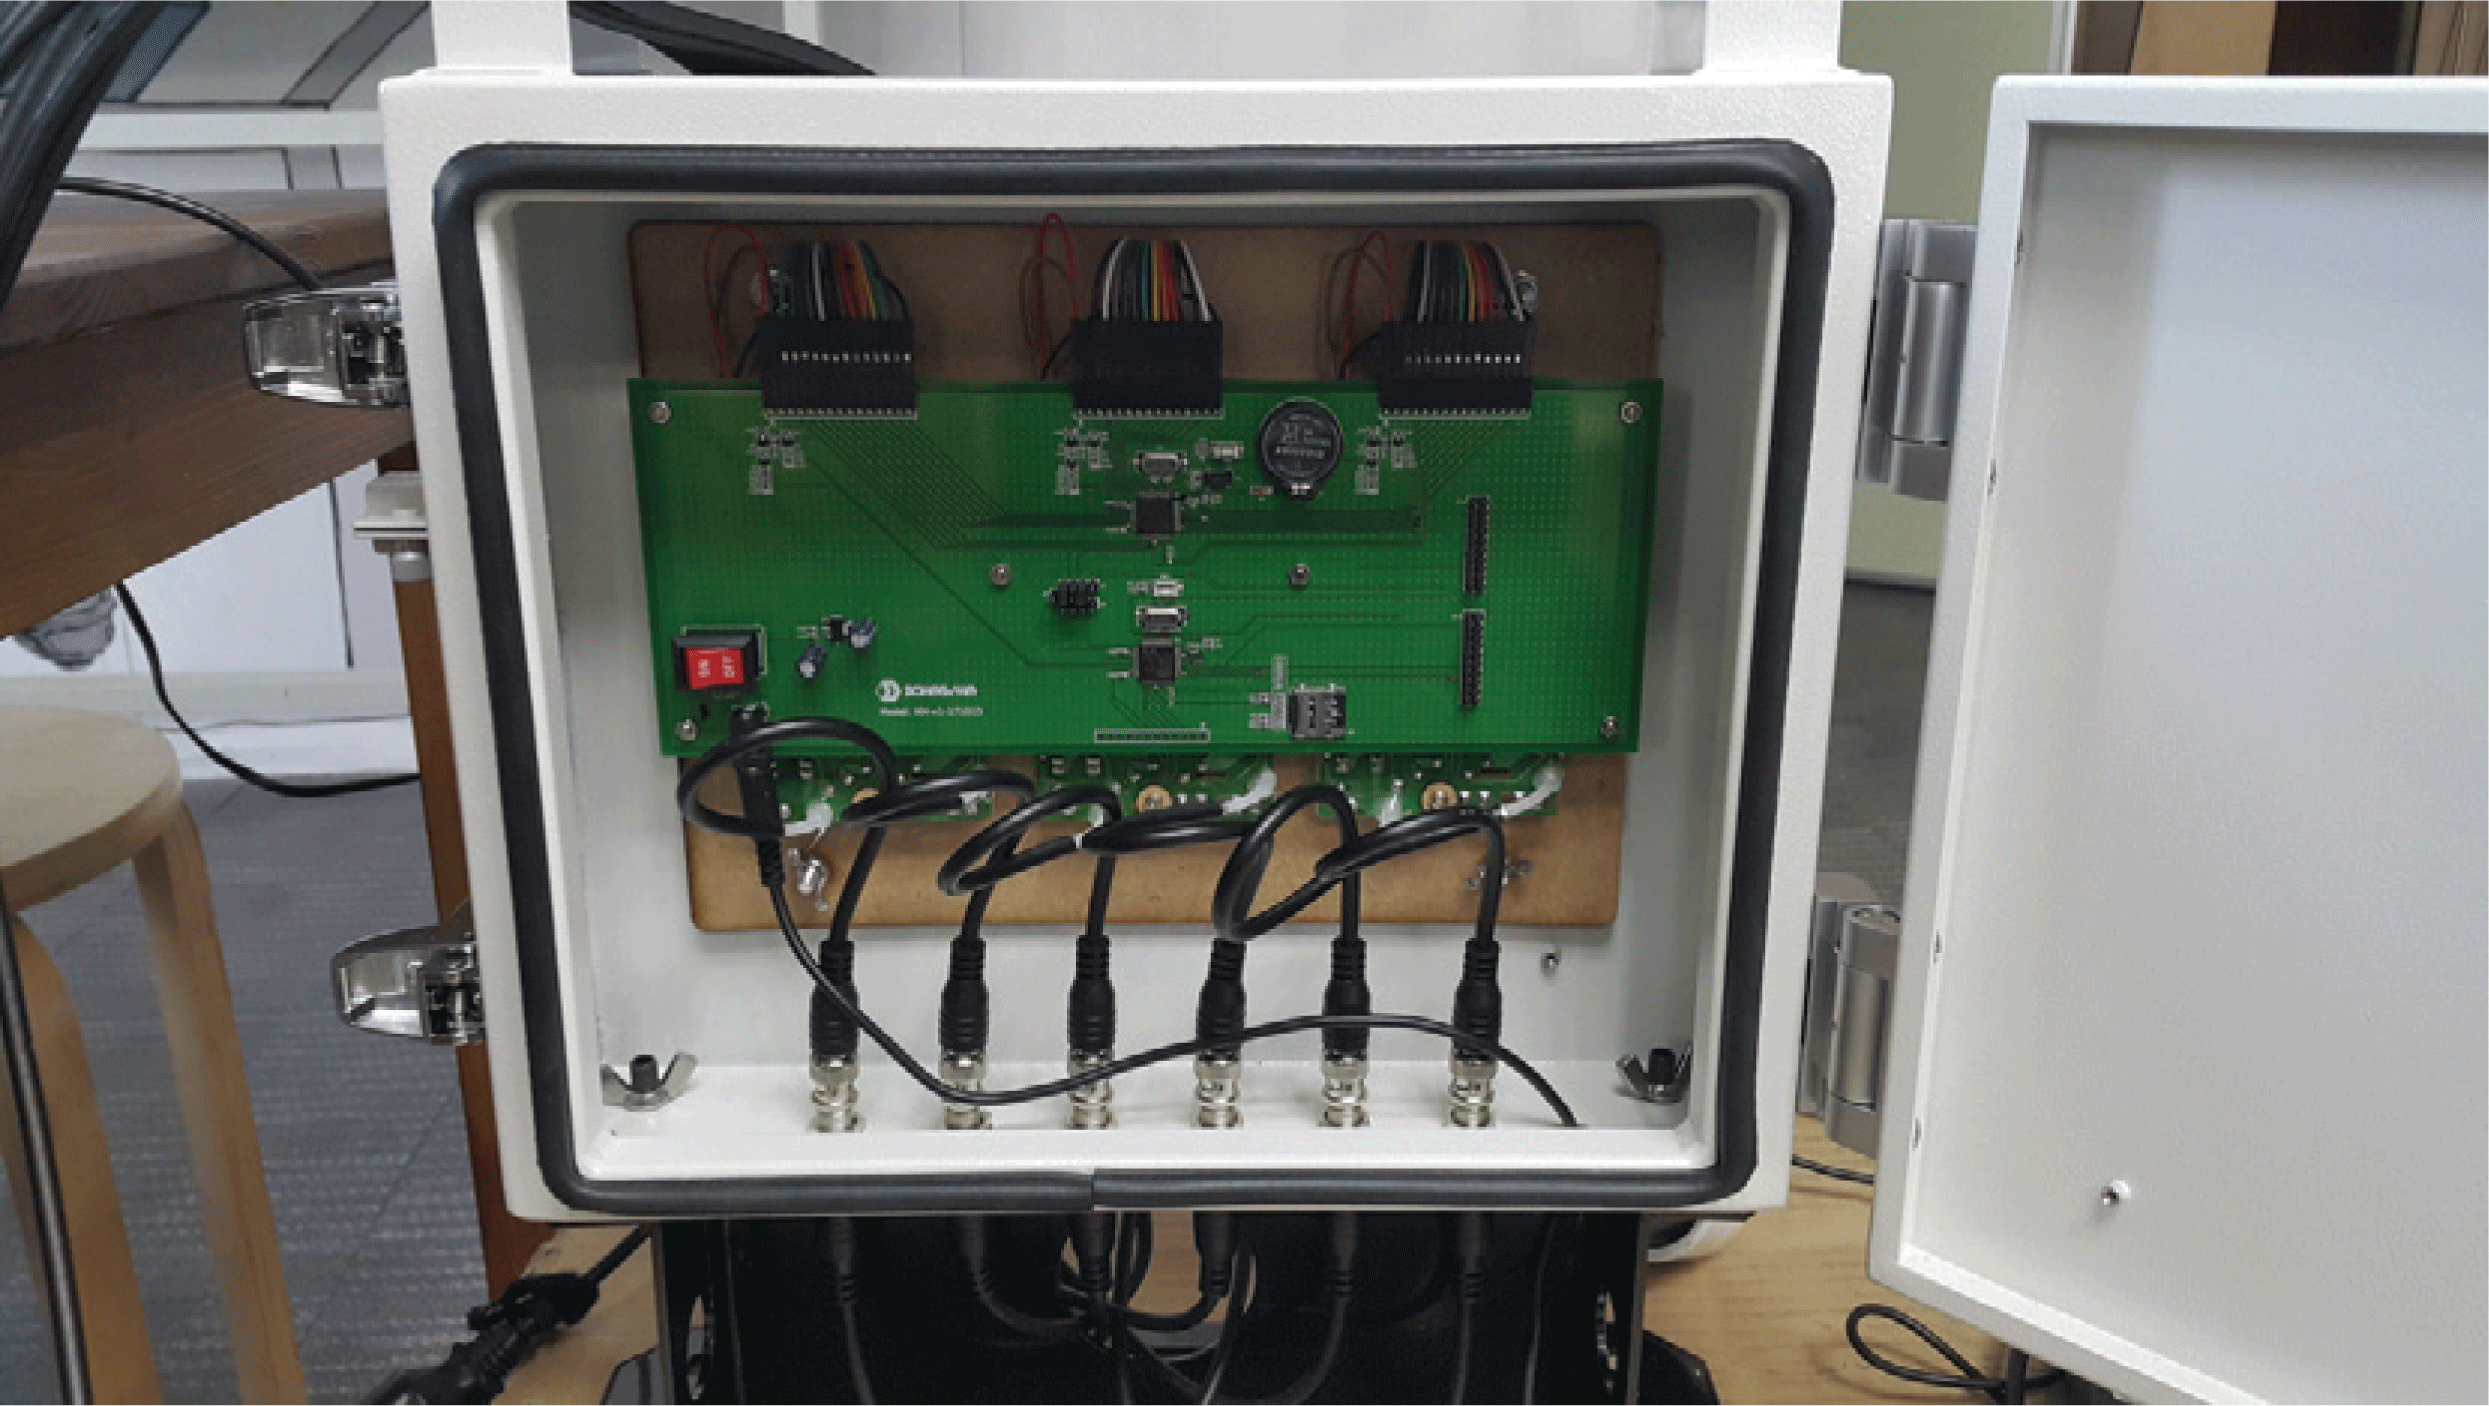
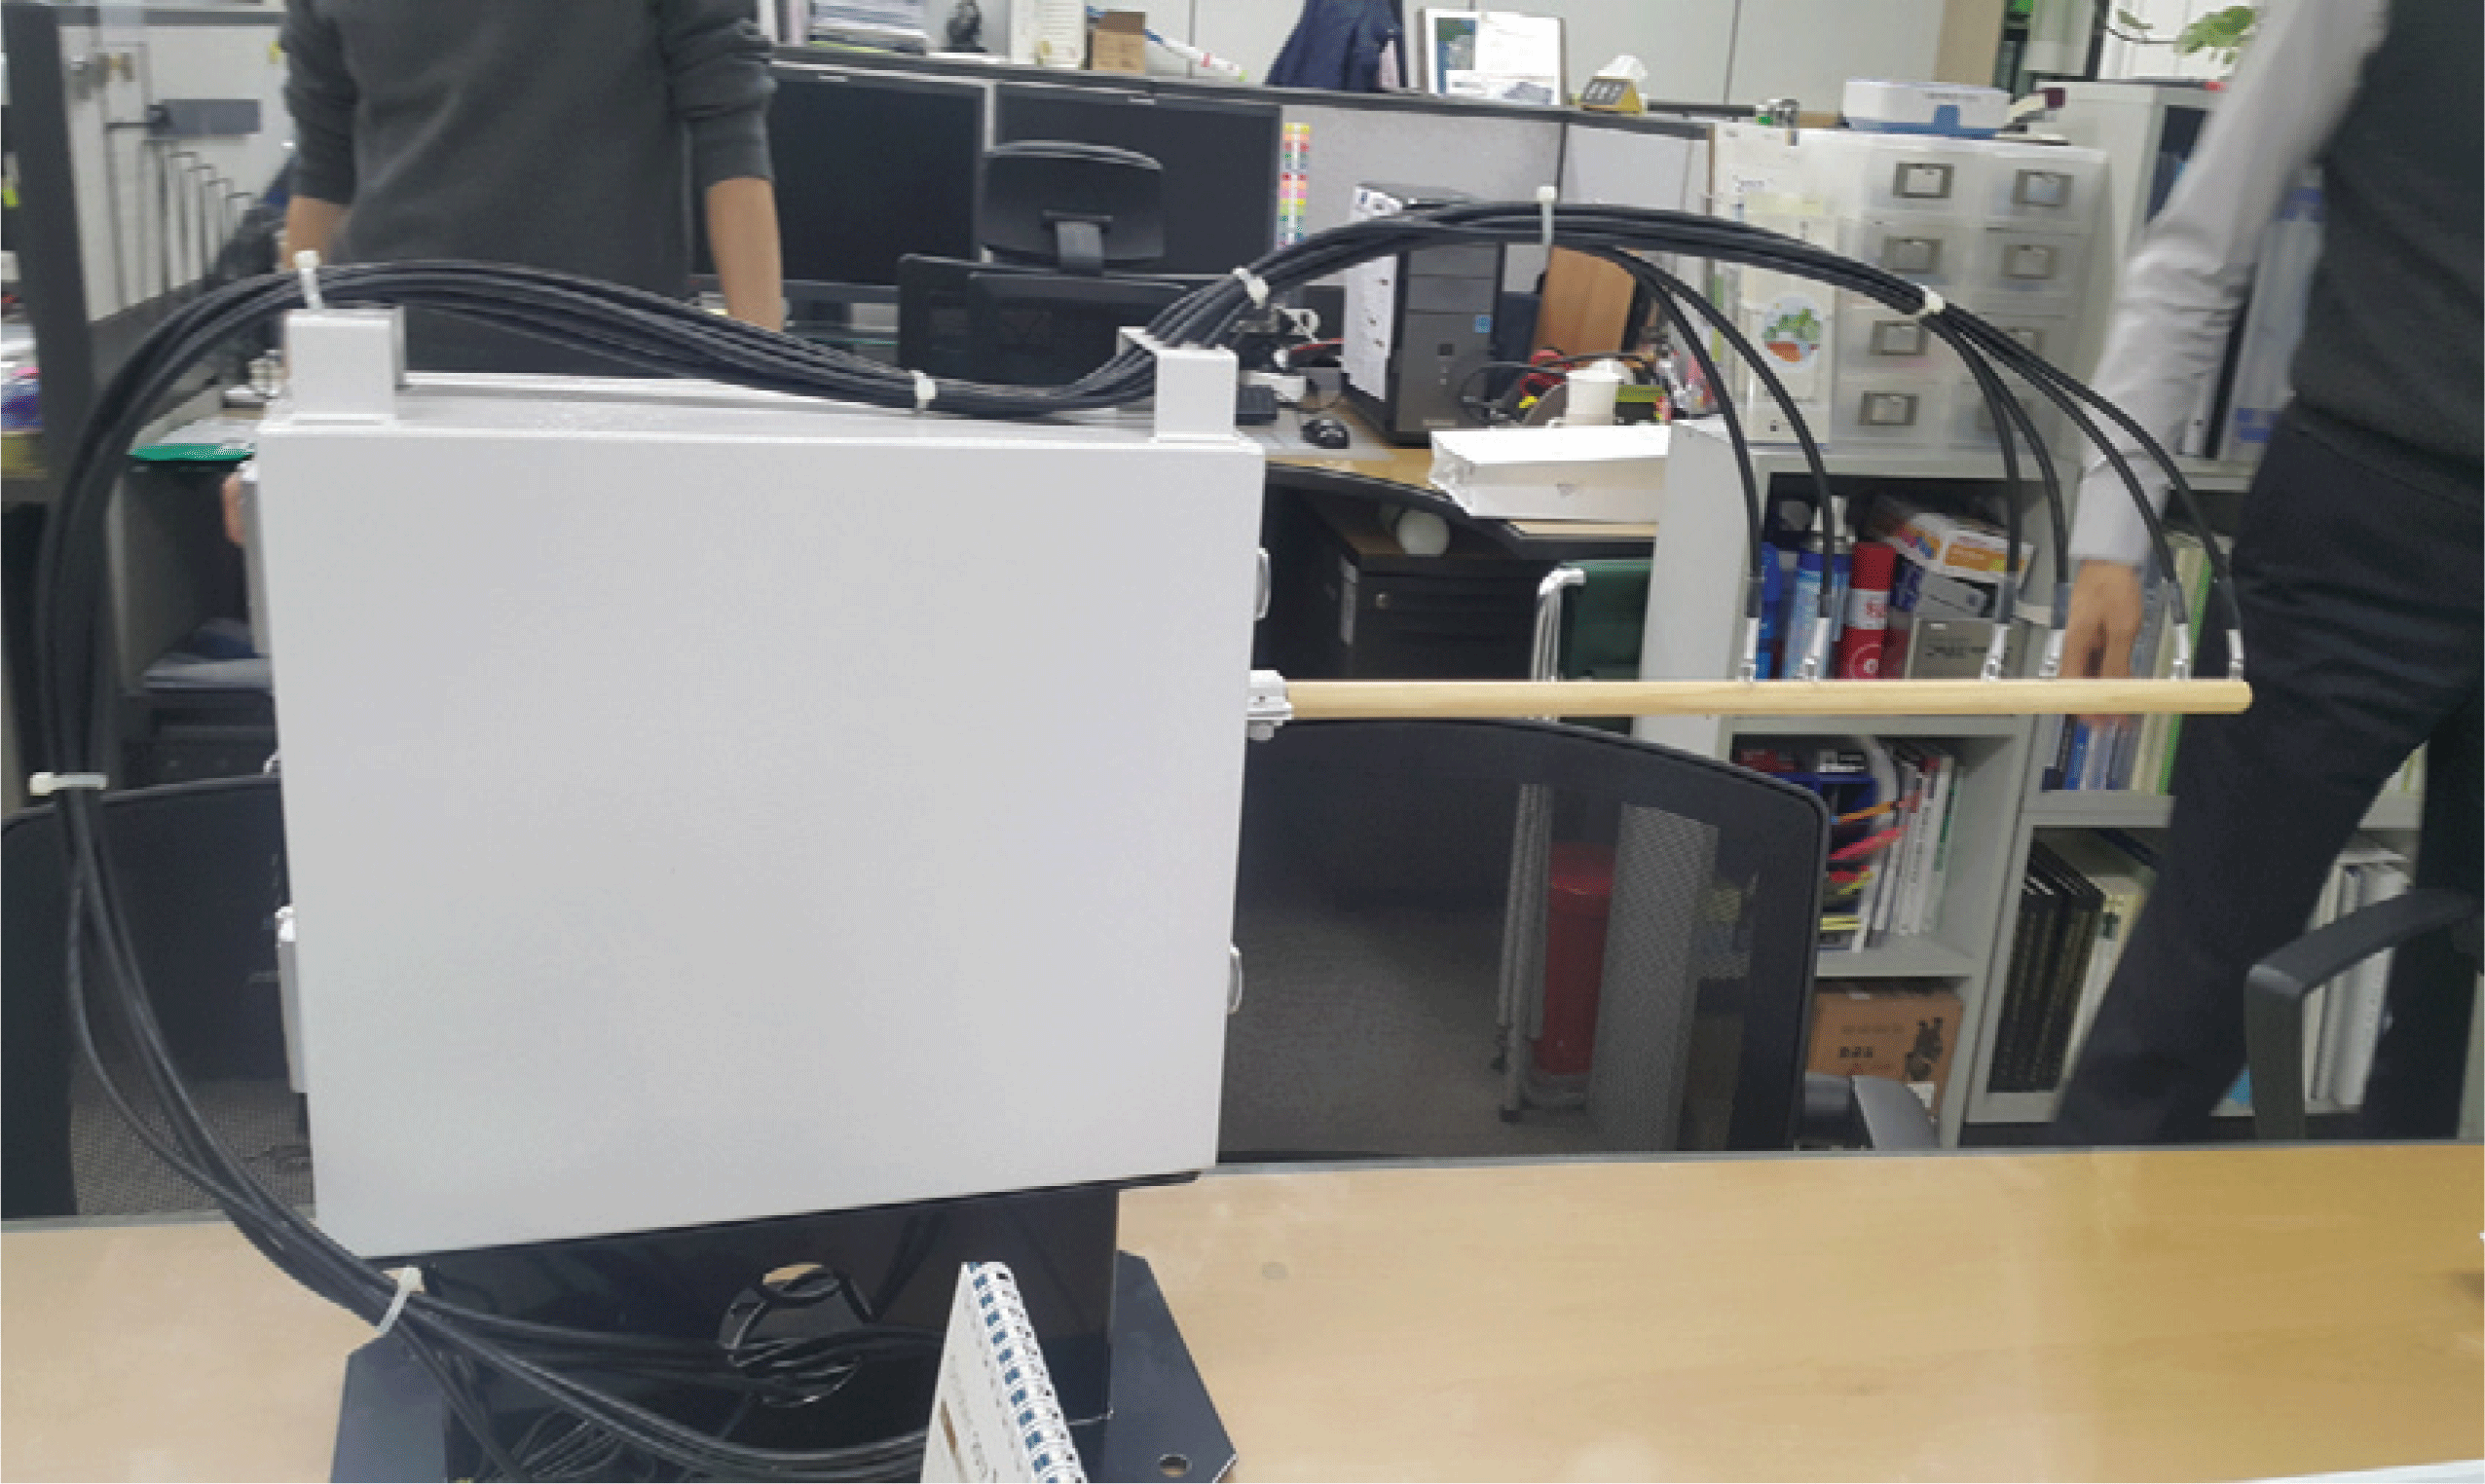
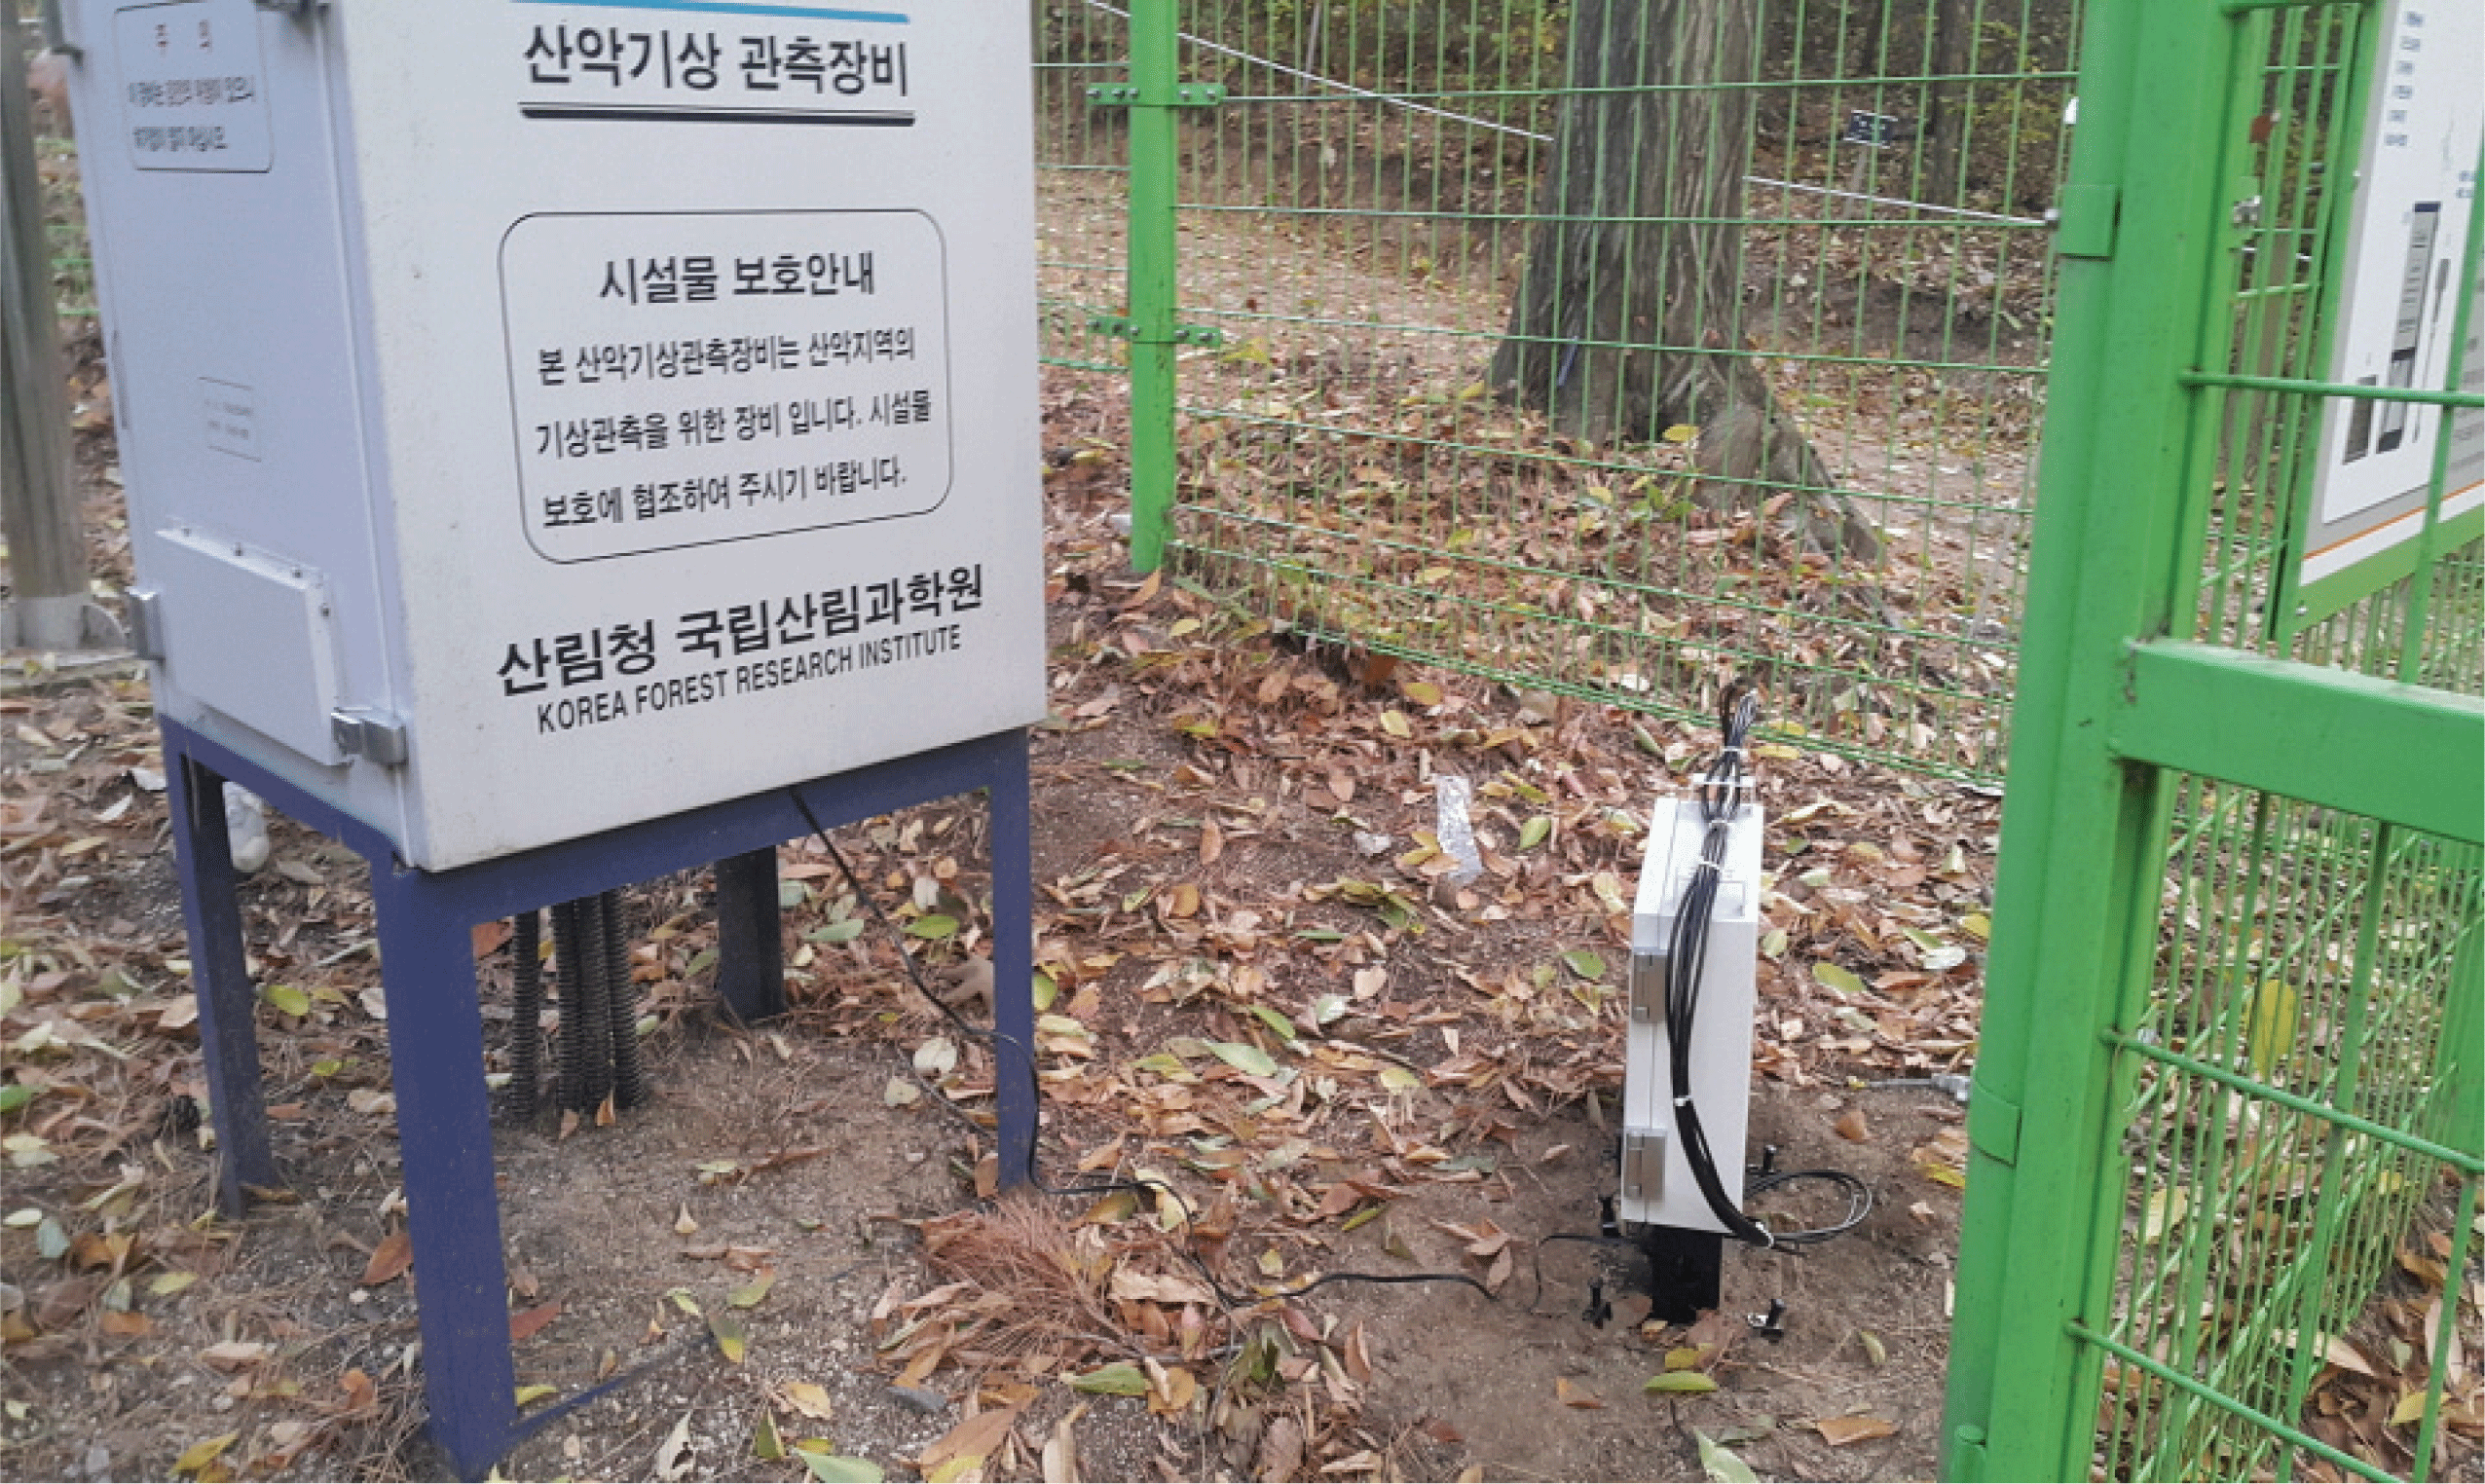
A prototype was developed based on the measurement results of electrical resistance for each voltage for automated measurement of forest fire surface fuel moisture. Fig. 10, Fig. 11. Fig. 12 and Fig. 13 show the process of manufacturing a prototype of an automated sensor for measuring forest fire fuel moisture. For the design of the case, first of all, the sensor must be placed 30 cm above from the ground so that it can be easily installed in the weather network in the forest, and since it’s going to be exposed in the forest, the case was manufactured with water and dustproof features. In addition, the prototype of automated forest fire surface fuel moisture sensor measures at every hour to obtain reliable resistance values, and atend, 1/4 location, and 1/2 location, in that order, to reduce electrical resistance measurement errors. Also, the conversion formula [electrical resistance = 2E+13 (moisture content)-9.705)] (Yeom, 2018) was used in the model to estimate the moisture content for electrical resistance. The device was designed to measure 10 times for each part at 5-second intervals, and then output the average value which was calculated after the maximum and minimum values were discarded. In addition, for future linkage with the forecast system, a forest fire risk threshold was set and used for this output. For this, the range and threshold of forest fire risk were set (Table 4) based onthe ‘A Study on the Analysis of Forest Fire Hazards and Combustion Expansion Factors’ by Lee (1995). However, due to the limited time and cost associated with manufacturing the prototype performed in this study, the development of a prototype capable of stably measuring resistance at high resistance was not reached, but a board that can measure the resistance value under 50 MΩ with stability and accuracy was developed. Therefore, for the application of the sensor proposed in this study, the software was designed so that when the forest fire fuel moisture is 16% (41.21 MΩ) or higher, the risk of forest fire would come out as “dangerous.”. Table 4 shows the threshold value of the sensor for automated measurement of forest fire surface fuel moisture, and Fig. 14 shows a picture of the sensor installed at the National Institute of Forest Science in Hongneung, Seoul.
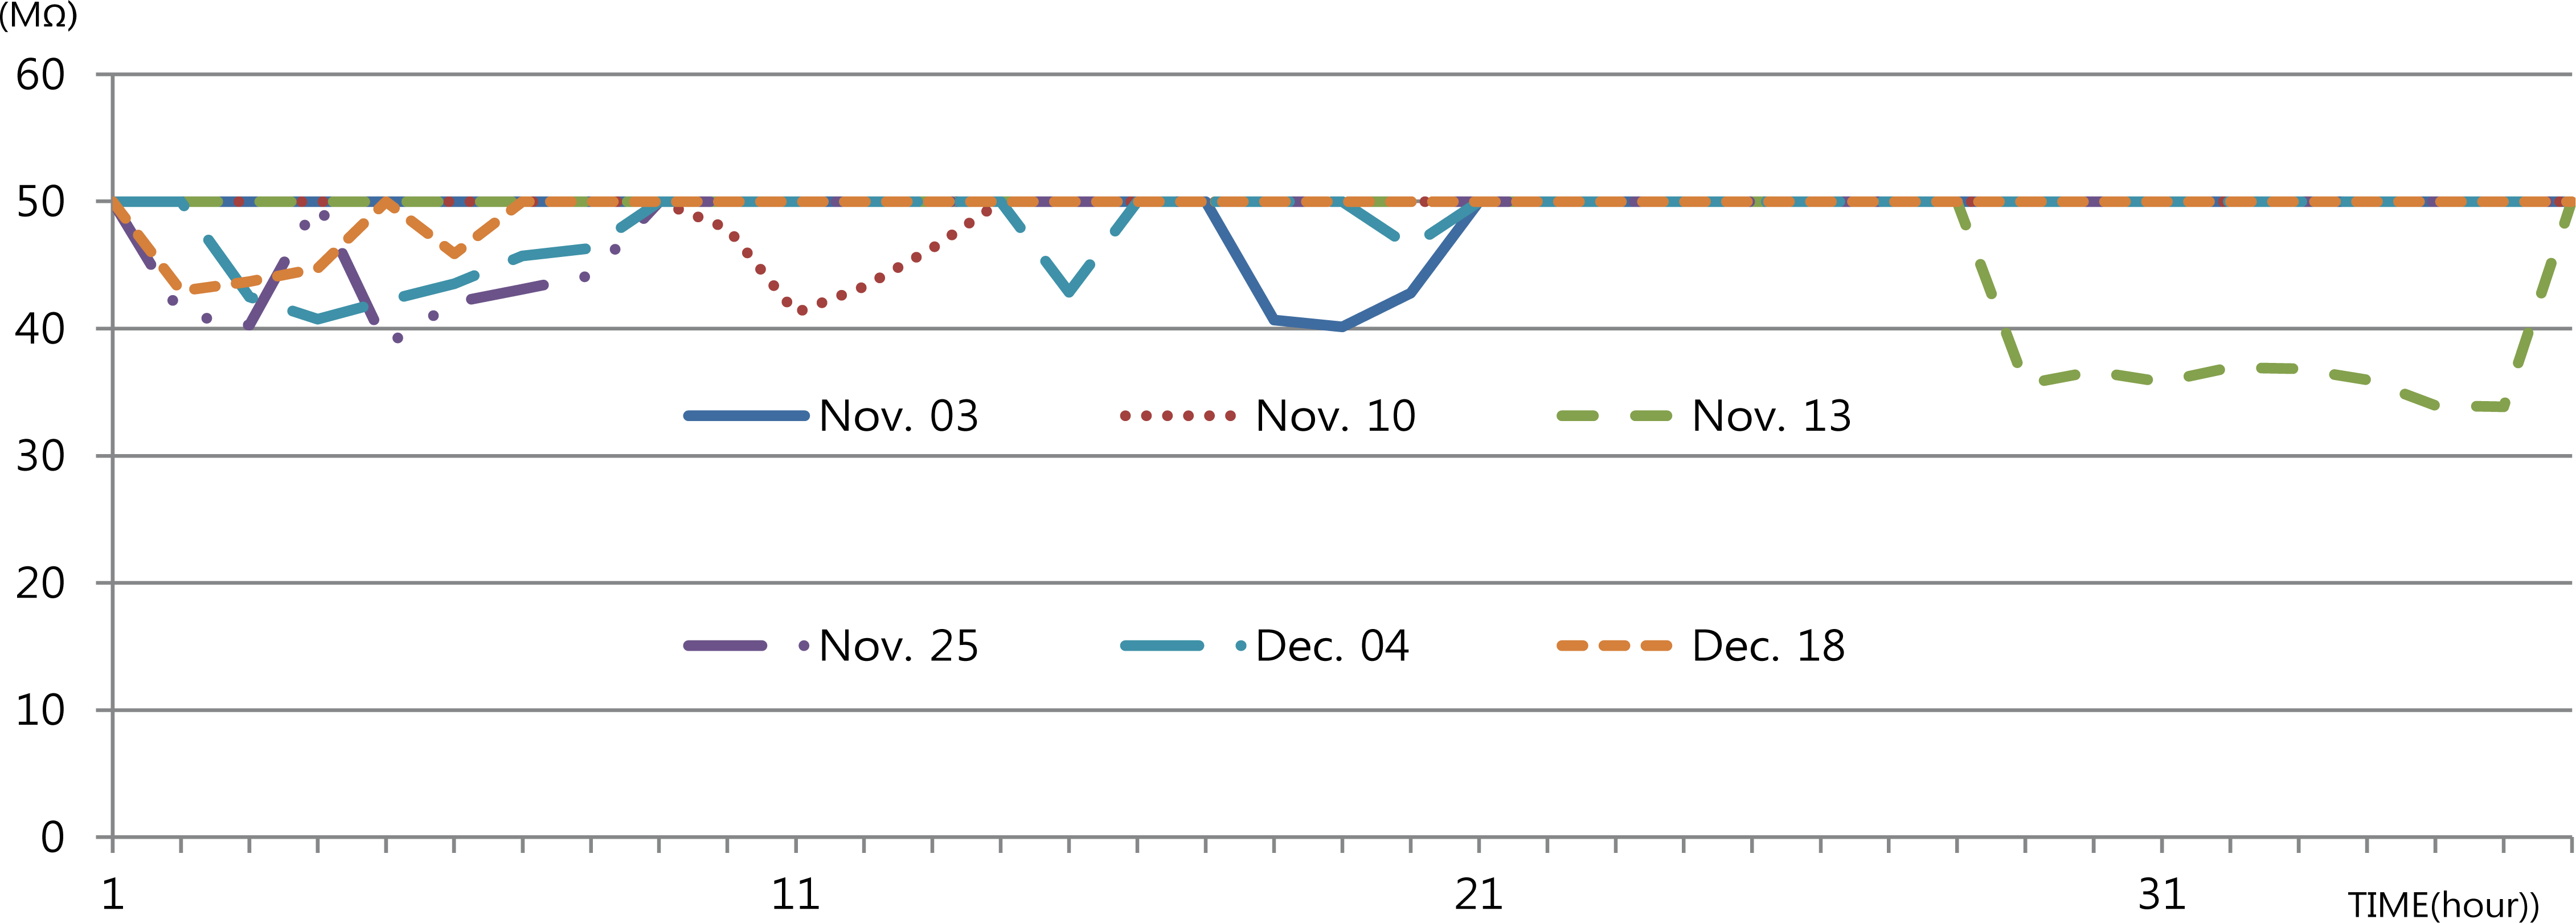
For verification of the prototype produced in this study, the prototype was installed at the automatic weather station in Hongneung Forest within the National Institute of Forest Science and measured changes from November 3, 2017 to December 20, 2017 which are shown in Fig. 15. In other words, there were a total of 7 precipitations during the monitoring period, and the analysis showed that the prototype responded to the events. However, due to the limitation of the equipment that values more than 50 MΩ can’t be measured, the changes below that moisture content (less than 15%) can’t be measured. For this, additional improvement in the equipment is necessary.

For monitoring of forest fire fuel moisture measurement sensor, from November 3, 2017 to December 20, 2017, there were a total of 7 precipitations based on the monitoring results of the installation at the automatic weather station in the forest in Hongneung, and the electrical resistance values changed accordingly which are shown in Table 5, Fig. 16, and Fig. 17.
| Day | Precipitation (mm) | Electrical Resistance (MΩ) |
|---|---|---|
| Nov 10 | 6.5 | 9.85 |
| Nov 13 | 1.5 | 8.74 |
| Nov 25 | 16 | 16.14 |
| Dec 04 | 1.5 | 12.87 |
| Dec 10 | 3 | 9.25 |
| Dec 18 | 0 | 7.04 |
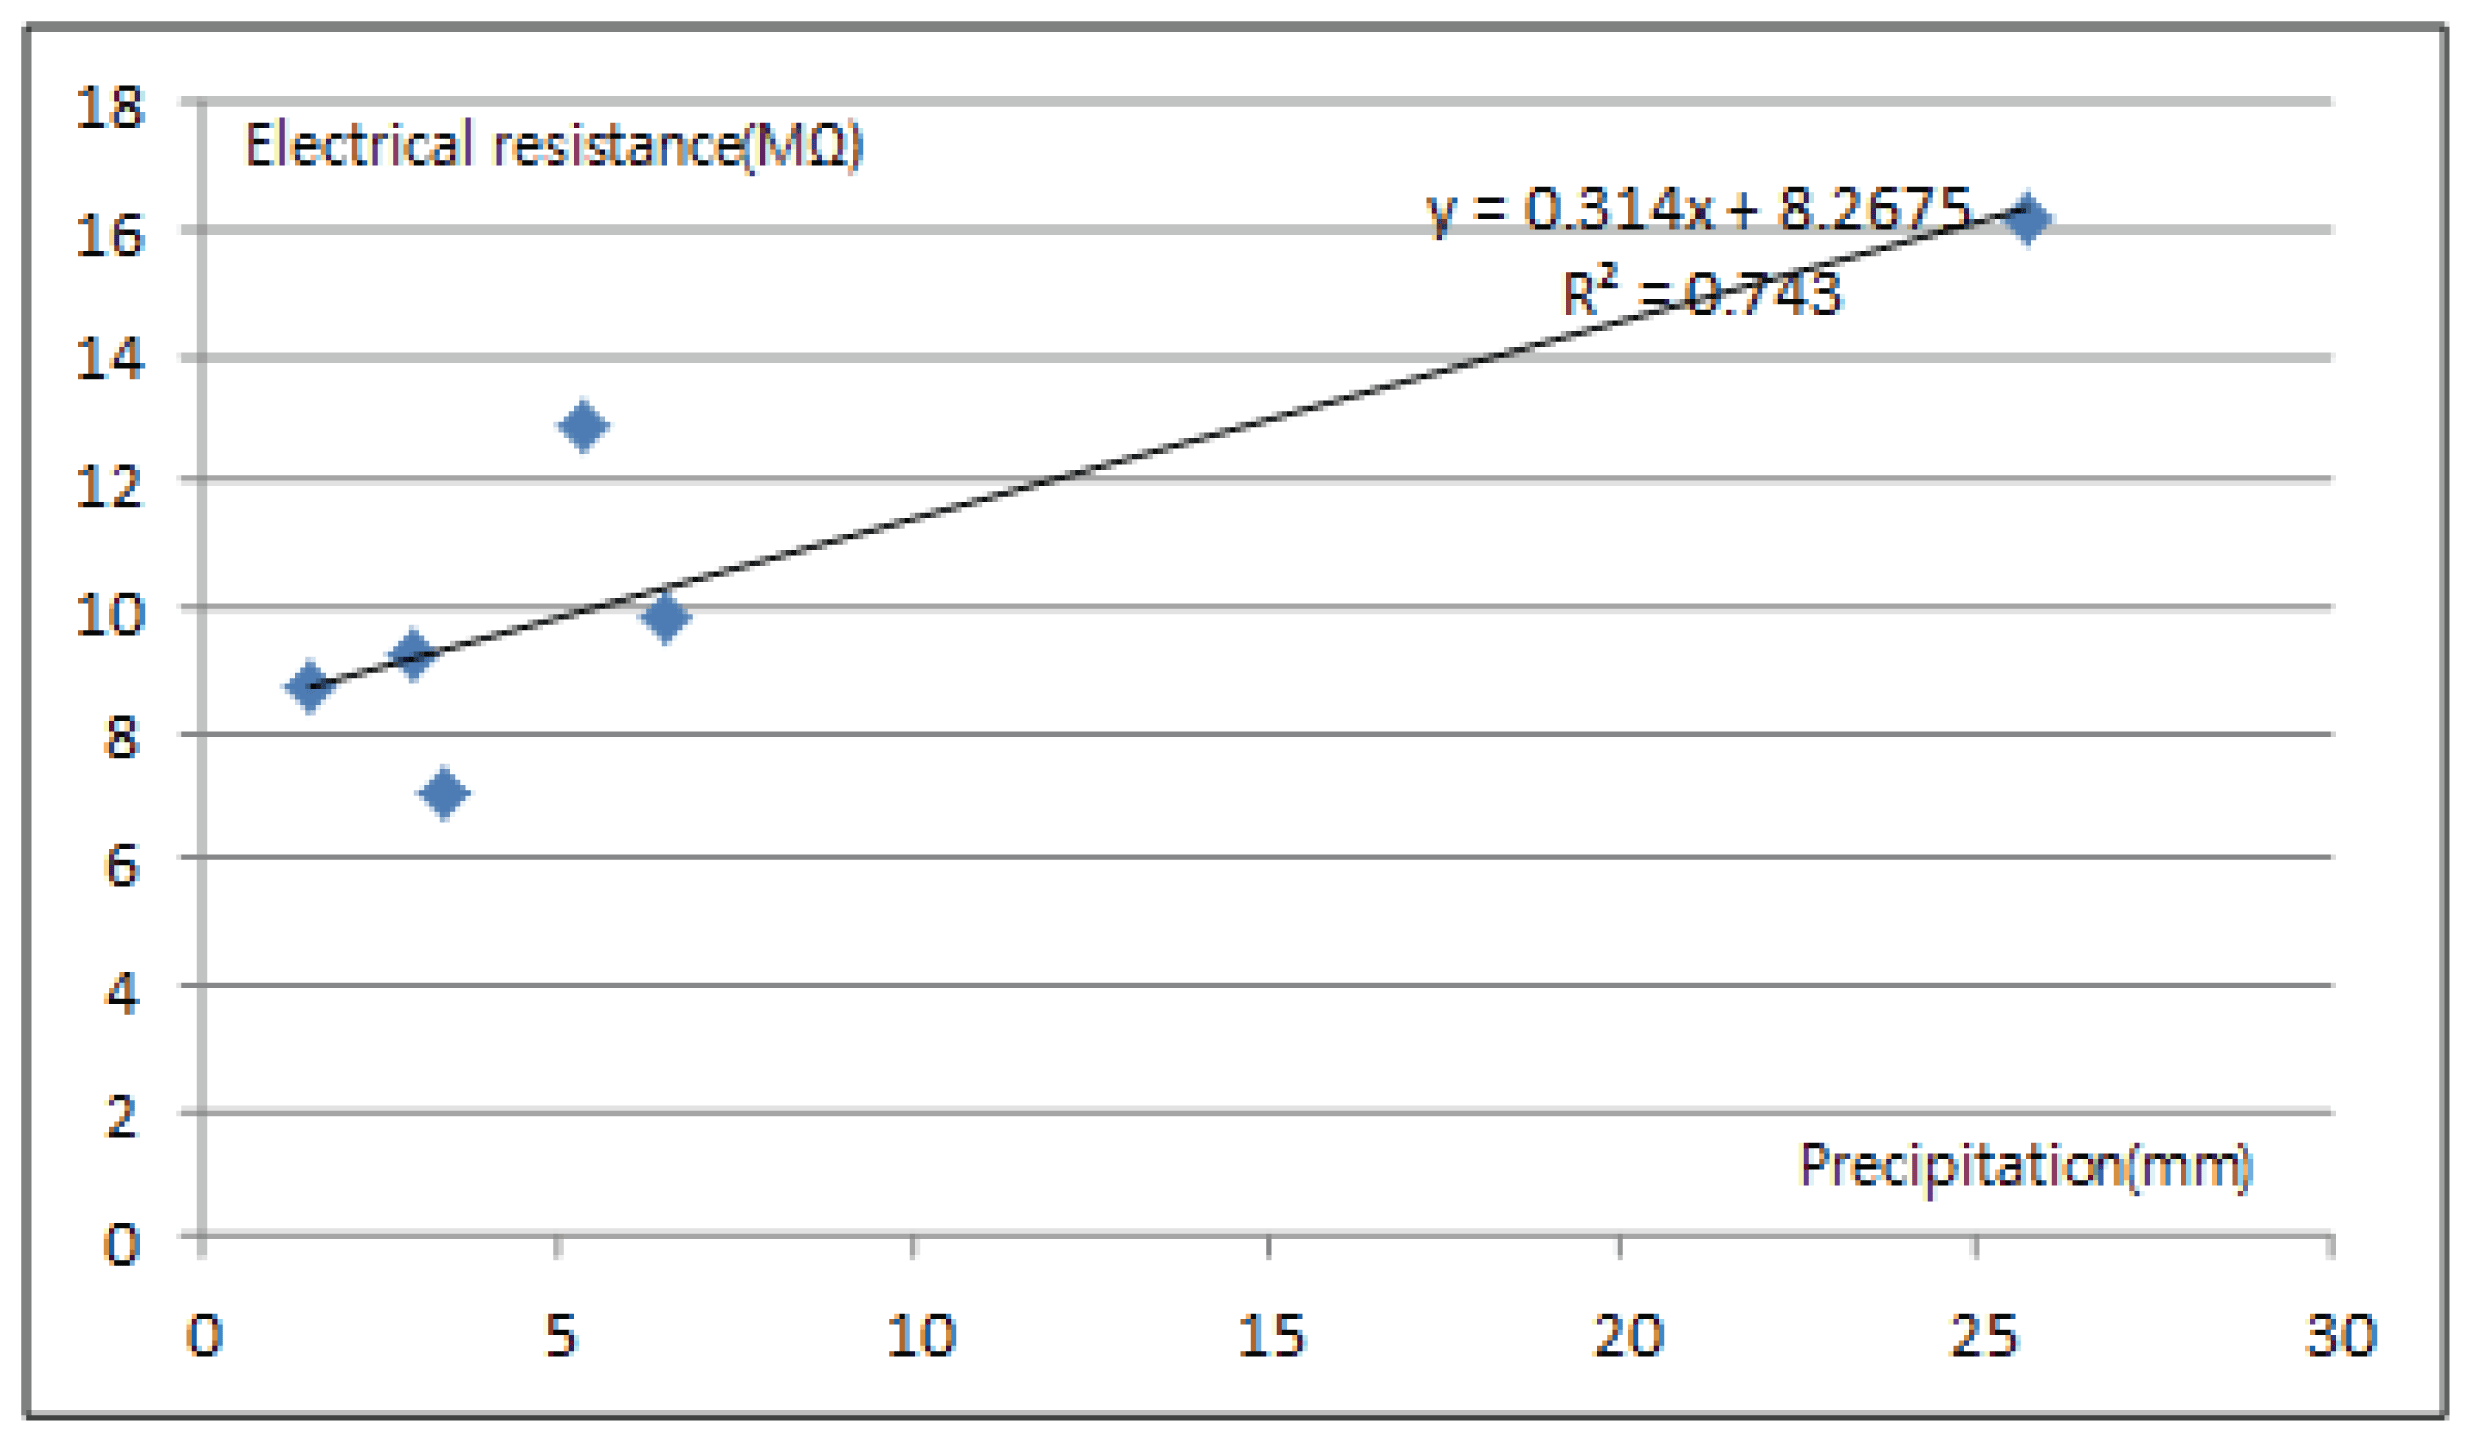
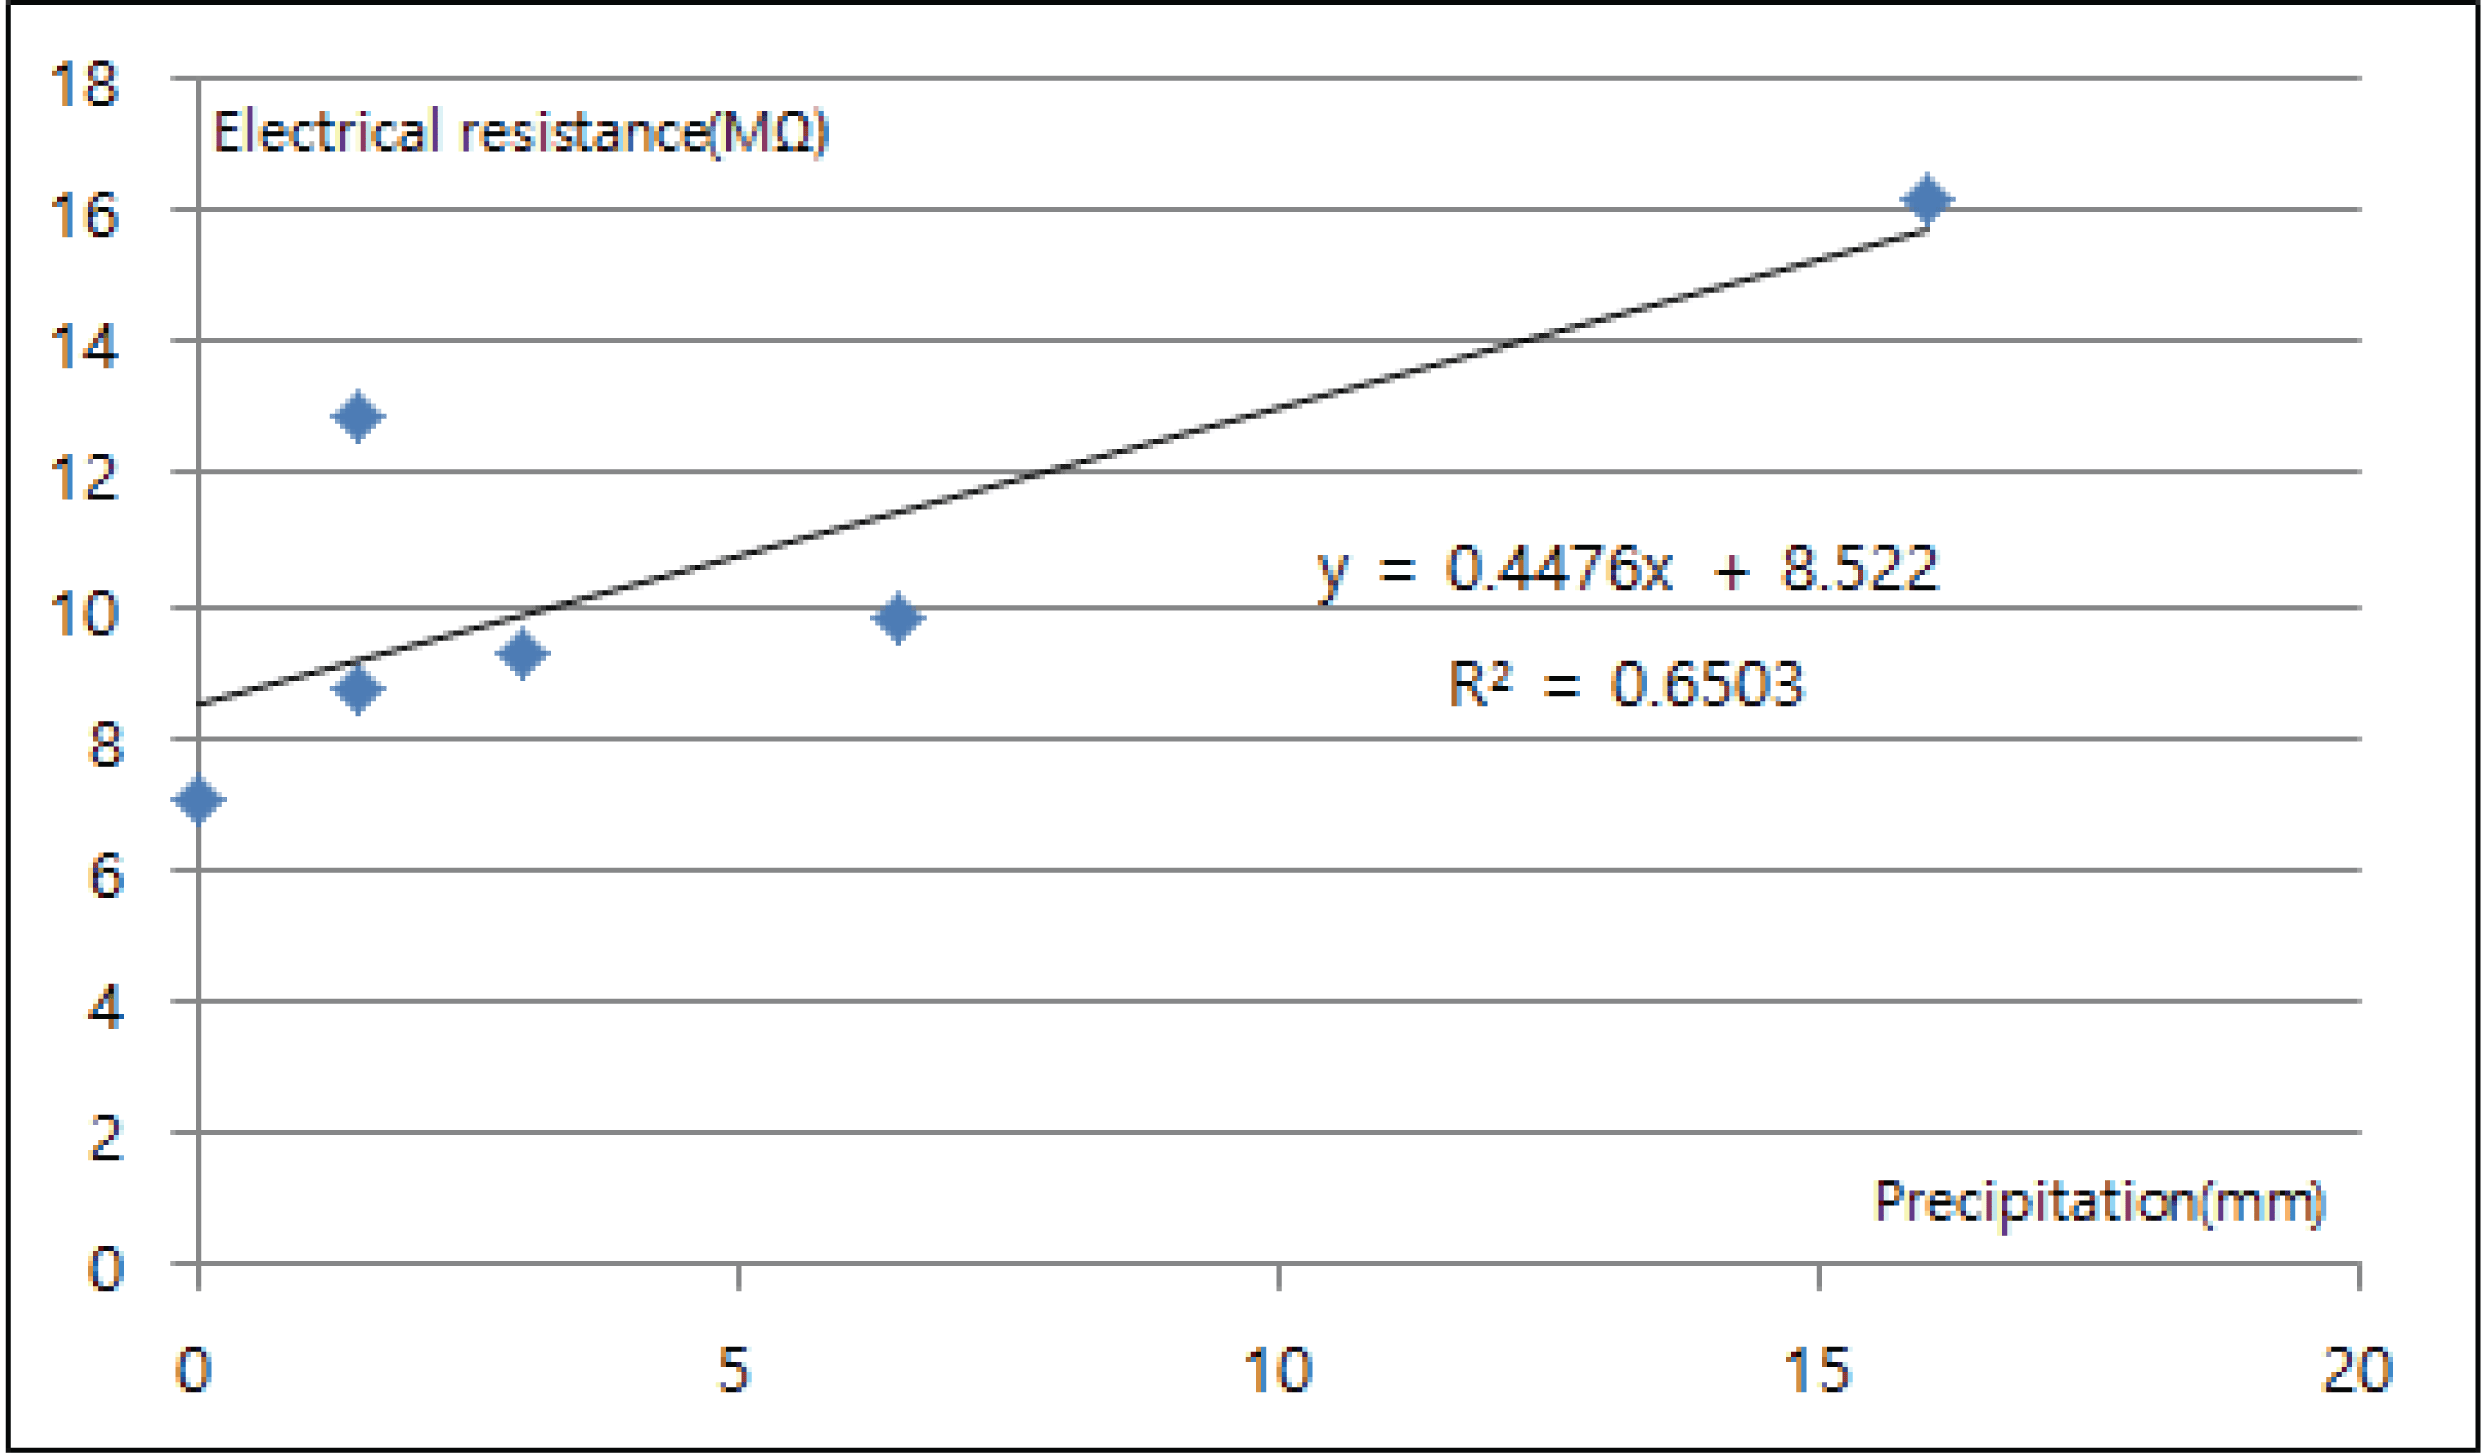
Based on the analysis, the change (decrease) of the resistance value increases as the precipitation increases, and the moisture content increases as the precipitation increases, and the sensor detects the change in the moisture content according to the change in precipitation. However, since the number of the event (7 precipitations) was small, it seems that additional long-term monitoring was necessary.
For monitoring of the forest fire fuel moisture measurement sensor, from November 3, 2017 to December 20, 2017, there were a total of 7 precipitations based on the monitoring result of the installation at the automatic weather station in Hongneung Forest and the time taken until the change in electrical resistance of the sensor occurred was measured and analyzed. This was judged to be an important factor in terms of how well the change of moisture content according to precipitation was detected and analyzed. Table 6 and Fig. 18 are the analysis results of the response time according to the precipitation, at the initial monitoring value, the sensor's response occurred after 10 hours, but after 30 days of installation, the response time were 3 hours and 1 hour, respectively. Thus, it was analyzed that the change in moisture content was measured immediately after precipitation.
| Day | Precipitation (mm) | The time to response (Hour) | The day after install (day) |
|---|---|---|---|
| Nov 10 | 6.5 | 18 | 8 |
| Nov 13 | 1.5 | 10 | 11 |
| Nov 25 | 16 | 28 | 23 |
| Dec 04 | 1.5 | 2 | 31 |
| Dec 10 | 3 | 3 | 37 |
| Dec 18 | 0 | 1 | 45 |
In this regard, Micheael (1983) investigated that the forest fire fuel moisture stick measured the change in moisture when exposed to the natural environment, and the weight decreases over time. Therefore, it is assumed that the time in moisture content change varies according to the change in density of the forest fire fuel moisture stick over time. Therefore, additional research seems to be needed for this.
4. CONCLUSION
This study was conducted to develop an automated measurement sensor for forest firesurface fuel moisture to predict changes in the moisture content and risk of forest fire, which are indicators of forest fire occurrence and spread risk. The results showed thatthis measurement sensor is a method of automatically calculating the moisture content of forest fire fuel by measuring the moisture content of the fuel using electrical resistance. The forest fire fuel used in this sensor was pine (50 cm long, 1.5 cm in diameter), and electrical resistance that estimated the relationship between moisture content and electrical resistance=2E (E:Exponent of 10)+13X(X:Moisture content)-9.705 (R2=0.947) was developed. In addition, using this, a prototype was produced by designing the software and case forthe automated measurement sensor for forest fire surface fuel moisture, and the suitability (R2= 0.824) was confirmed by performing field monitoring verification in the forest. In addition, after analyzing the relationship between the precipitation and the sensor's response sensitivity, the sensor detected the change in moisture content according to the change in precipitation, and it was determined that additional long-term monitoring was necessary. Due to the limitation that the measurement sensor cannot measure a value of 50 MΩ or more, further improvement of the measurement sensor was necessary to measure the change value of the moisture content (15% or less) less than this. Finally, the results of this study are expected to be helpful in the development of technology that can predict the occurrence, spread rate and intensity of forest fires, and are expected to be used as basic data for the advancement of forest fire risk forecasting technology.

