1. INTRODUCTION
Noise pollution is a significant factor that negatively impacts sleep quality and is associated with various health issues, including heart disease and stress disorder (He et al., 2021; Jang et al., 2018a; Jariwala et al., 2017). Therefore, the enforcement of noise control measures is crucial and serves as an important protective factor for preserving health-related quality of life (Hwang et al., 2013; Jang et al., 2018b; Kim et al., 2012; Kook et al., 2007; Lee et al., 2011). The utilization of sound-absorbing materials has been recognized as a straightforward and dependable alternative for mitigating noise levels (Kang et al., 2019; Sharma et al., 2020).
Numerous studies have investigated building materials that exhibit exceptional sound absorption characteristics and have explored methods for determining sound absorption rates and identifying suitable sound insulation materials. However, the utilization of synthetic materials such as foam, asbestos, and glass wool raise concern due to their negative environmental impact and contribution to the greenhouse effect, compounded by the uncertain availability of industrial resources and the global surge in their utilization (Linton et al., 2015). In response to efforts aimed at reducing greenhouse gas emissions, there has been a growing interest in recycling various industrial by-products for efficient resource utilization (Kang et al., 2018a, 2018b, 2019). Consequently, researchers have increasingly turned their attention to natural materials as a means to develop environmentally friendly and sustainable sound-absorbing materials (Asdrubali, 2006).
In the agricultural industry of Thailand, various post-production wastes are generated, including bamboo fiber (Koizumi et al., 2002), coconut fiber (Fouladi et al., 2010), sugar cane fiber (Putra et al., 2013), paddy rice fiber (Putra et al., 2013), date palm fibres (Abd ALRahman et al., 2014). and vegetable fiber (Bastos et al., 2012). These waste materials have shown promising potential for sound absorption, particularly in the mid to high frequency range, with sound absorption coefficients (SACs; exceeding 0.5, especially above 1 kHz.). One potential natural waste material is coffee silver skin (CS; Woldesenbet et al., 2014). CS is derived from the hulling, roasting, cleaning, packaging, and sorting processes of coffee (Murthy and Naidu, 2012). There have been several research studies focusing on the use of natural fibers to produce sound-absorbing materials. For instance, natural fiber materials derived from wood, such as wood pellets, have also been investigated for their sound absorption capabilities as an eco-friendly material (Jang, 2022b), rice straw, bagasse, binderless particleboard (Jamaludin et al., 2020) and sandwich particleboard (Iswanto et al., 2020). As for the development of various environmentally friendly sound absorbing materials, such as pine (Pinus densiflora; Jang, 2022d), pollen cones, which can be developed into high quality sound absorbing materials, hinoki cypress cubes (Jang, 2022e), Acanthopanax senticosus wastes (Jang, 2022a) and peanut shells that can be easily recycled (Jang, 2022c).
According to a recent survey, South Koreans have an average daily coffee consumption of two to three cups, with the majority of coffee consumers being in their 40s and 50s. Experts attribute this coffee obsession to Korea’s work culture and several other contributing factors. The data highlights Korea’s longstanding reputation for having one of the highest rates of coffee consumption globally. In 2020, market research firm euromonitor international reported that Korea ranked second in the world in terms of coffee consumption, with an average of 367 cups per person annually. Notably, this figure was more than twice the global average coffee consumption rate at the time, which stood at 161 cups per year (Lee, 2023). Looking back at the year 2019, South Korean imports of thai raw sugar saw a significant increase. Data from the thai sugar milling corporation indicated a year-on-year rise of 148%, reaching 246,179 metric tons for the period between January and April. Additionally, imports of white and refined sugar also surged by 147% during the same period, amounting to 68,960 metric tons (Brian, 2019). Moving on to 2021, South Korea emerged as the 8th largest importer of raw sugar in the world, importing a total of $760 million worth of the product. In the same year, raw sugar ranked as the 135th most imported product in South Korea. The primary sources of South Korea’s raw sugar imports were Australia ($400 million), Thailand ($127 million), El Salvador ($65.4 million), Guatemala ($36 million), and Brazil ($31 million). These figures clearly demonstrate the growth in both the coffee and sugar cane industries in South Korea. However, this growth inevitably leads to increased waste generation in the manufacturing sector. Therefore, it presents an intriguing opportunity for researchers to study effective methods for recycling this waste.
The objective of this research is to develop a sound-absorbing composite using sugarcane bagasse (SB) and CS. Multiple samples were fabricated and tested in an impedance tube to determine their SAC. This paper is organized into four sections. Section 2 provides a brief overview of the composition and methodology. Section 3 presents and discusses the main results, and finally, Section 4 concludes with the main findings.
2. MATERIALS and METHODS
SB was collected from New Krung Thai Sugar Factory (Kanchanaburi, Thailand). The SB was cut using a chopping machine into approximately 5 mm lengths and then dried in a drying oven at 90°C for 24 hours, resulting in a moisture content of 10% on a dry basis. The dried SB was stored for all subsequent studies and analyses.
CS was obtained from agricultural waste at a robusta coffee producer community enterprise group in Chumphon Province, Thailand. It is different from the coffee grounds because CS is the husk obtained from the grinding of fresh coffee beans in the production of roasted coffee beans. The CS was obtained from the waste of a coffee roasting plant and subsequently dried in an oven at 90°C for 24 hours, resulting in a moisture content of 10% on a dry basis. The dried CS was carefully stored for further analysis. For the preparation of the composite material, the dried SB and CS were mixed at varying ratios: 100:0, 75:25, and 50:50. The resulting mixture was then combined with Melamine-Urea-Formaldehyde from Aica Hatyai, Songkhla, Thailand in a ratio of 3:1. Thorough stirring was conducted to ensure the achievement of homogeneity in the mixture. Subsequently, the resulting mixtures were poured into square molds with dimensions of 300 mm × 300 mm, thickness of 30 mm and subjected to pressing using a hydraulic hot press machine at a temperature of 130°C and a pressure of 220 kgf/cm2 for a duration of 15 minutes. To assess the sound absorption properties, the samples were cut into cylindrical shapes with diameters of 30 mm and 100 mm, and a thickness of 30 mm. For the evaluation of thickness swelling (TS), the samples were cut into square forms with dimensions of 50 mm in width, 50 mm in length, and 30 mm in thickness. The obtained results are presented in Table 1.
The bulk density of the composite samples was determined by measuring and weighing them using Equation (1):
where ρbulk represents bulk density, m denotes mass, and V signifies volume.
In accordance with the Archimedes principle (Calis Acikbas et al., 2018), the weight of the sample was measured after it underwent boiling in hot water for 1 hour. Subsequently, the sample was dried to remove any residual water by wiping it and recording its weight. It was then subjected to a 2-hour treatment of blowing with hot air at 110°C. Consequently, the porosity of the sample (Φ) was determined using Equation (2):
Where Wssuspend is the sampling weight that suspended in water; Wwet is the sampling weight after wiping water on surface; Wdry is the sampling weight after drying.
The thickness of the specimen samples, which had dimensions of 50 × 50 × 30 mm, was prepared in accordance with ASTM D570 guidelines, resulting in swelling. The TS was calculated using Equation (3):
Where To is the thickness of specimens before the test started and Tl is the thickness of specimens after immersion in distilled water for 24 hours.
Distilled water, renowned for its exceptional purity and absence of impurities, was utilized instead of regular tap water in this study. The substitution of regular tap water, which may contain impurities, has the potential to introduce discrepancies in the porosity results due to unforeseen influences, such as chemical reactions with the specimen. Furthermore, the Urea formaldehyde melamine glue employed in this experiment is widely recognized for its insolubility in water once the curing or hardening process is complete. This adhesive, classified as a thermosetting adhesive, undergoes a solidification process and remains solid without softening or liquefaction when exposed to heat (Ebnesajjad and Landrock, 2014).
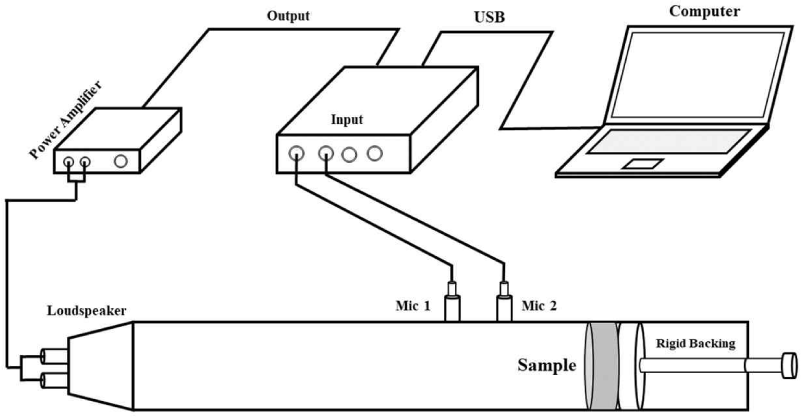
The SAC experiments of composite samples were measured using the impedance tube method according to ISO 10534–2. Fig. 1 shows the schematic diagram of the SAC experiment. This experiment was tested at a frequency of 63–6,300 Hz. The test uses tube to measure the SAC of the sample. The low frequency has a diameter of 100 mm and the high frequency has a diameter of 30 mm in Fig. 2 (de Carvalho et al., 2020; Jung et al., 2001; Putra et al., 2018).

The physical environment such as temperature and humidity in the chamber was controlled at constant. Table 2 presents the SAC of the composite board at 63 Hz–6.3 kHz. For the samples which had the ingredient ratio and density different, the SAC of these samples were recorded and considered. The experimental data; the sound absorption coefficient average (SAA); was divided into three groups: low frequency (63 Hz–1 kHz), medium frequency (1 kHz–3 kHz) and high frequency (3 kHz–6.3 kHz). The noise reduction coefficient (NRC); the arithmetic means of the absorption coefficients for a specific material and installation conditions; was determined by the center octave frequencies of 250, 500, 1,000 and 2,000 Hz. Thus, it could be calculated from Equation (4):
Scanning electron microscopy (SEM) is a valuable technique for examining the surface structures of biological samples. In this study, the surface structures of the sample boards, including SB and CS, were investigated. SEM (Thermo Scientific Phenom Pharos, RMUTP Lab, Bangkok, Thailand) was used to image the external surface of the composites and cross-section.
3. RESULTS and DISCUSSION
Table 1 presents the physical characteristics of the composites. The results indicate that the composite plates were categorized into three groups based on different sample mixing ratios: 100% SB (SB100), 75% SB mixed with 25% CS (SB75-CS25), and 50% SB mixed with 50% CS (SB50-CS50). The values are expressed in percentages by mass. And each group was further subdivided into three density levels: A at 380 kg/m3, B at 450 kg/m3, and C at 520 kg/m3. The table presents the porosity values alongside the TS. The experimental findings demonstrate a consistent trend: as the density of the composite board increased, both the porosity and TS values decreased across all ratio groups.
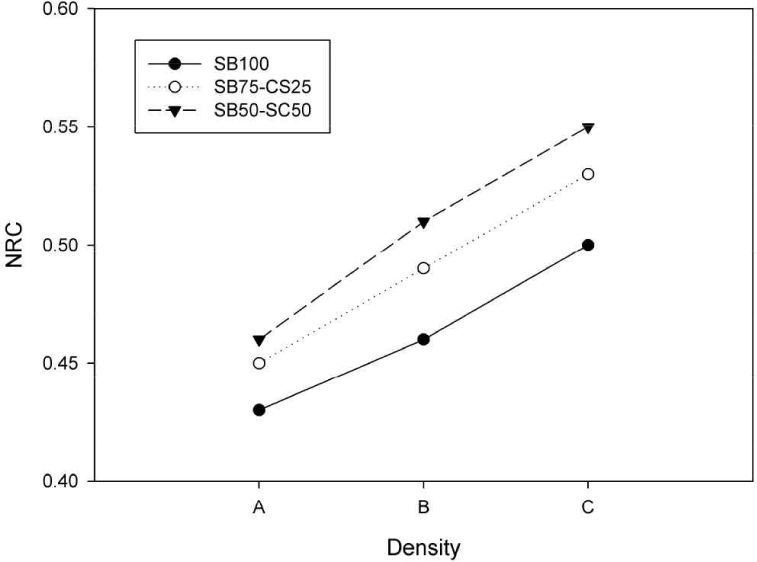
Table 2 presents the average values of the SAA and NRC. Based on the experimental observations, it was noted that the composite sheet in the SB100 group displayed an increase in the SAA as the density of the composite increased. This effect was particularly prominent in the high frequency range, leading to the highest SAA value recorded for the SB100-A composite, reaching a maximum value of 0.50. Similarly, the NRC exhibited a consistent increase and reached its maximum value of 0.50 for the SB100-A composite. When SB and CS were combined in the composite, the highest SAA value was observed in the mid-frequency band. Furthermore, increasing the proportion of CS in the mixture resulted in improved SAA values. This trend was also evident in the NRC, as the inclusion of different fibrous materials contributed to enhanced sound absorption properties. Additionally, the incorporation of flex pieces in the composite increased the complexity of the porous structure, further enhancing its sound absorption characteristics. By increasing the density of the composite, the maximum NRC value achieved was 0.55 for the SB50-CS50-C composite.
Fig. 3 presents the SACs of the composites at different ratios and densities. In Fig. 3(a), the variation of the SAC with frequency is depicted. It is noteworthy that the SAC displays an increasing trend at 1,000 Hz and reaches its peak above 2,000 Hz, followed by a slight decrease and subsequent stabilization. An important observation is the influence of density values on the SAC. Specifically, an increase in density corresponds to higher SAC values, as evidenced in the SB100-C composite at 0.54 above 2,000 Hz. Fig. 3(b) illustrates the variation of the SAC with frequency. Initially, the SAC experiences an increase at 1,000 Hz, followed by a decrease at 1,500 Hz, and then rises again to a second peak above 2,000 Hz as evidenced in the SB75-CS25-C composite at 0.60. Subsequently, the SAC gradually decreases slightly and stabilizes. The SAC values are notably affected by the density of the composites. As the density increases, the SAC also increases, indicating the impact of density on sound absorption properties. Fig. 3(c) demonstrates that the SAC exhibits a peak at 1,000 Hz as evidenced in the SB50-CS50-C composite at 0.65, followed by a decrease above 1,500 Hz, and then rises to a second peak above 2,000 Hz. These two peaks are clearly depicted in the graph. Subsequently, the SAC gradually decreases slightly and remains relatively constant. This observation further supports the influence of frequency on the sound absorption characteristics of the composites.

Fig. 4 depicts the sound absorption behavior at different mixing ratios for the same density. Fig. 4(a) (Density 380 kg/m3) revealed that at a densityof 380 kg/m3, the SAC values in the low-frequency range exhibited a consistent pattern characterized by a gradual increase at 1,000 Hz, followed by a decrease above 1,500 Hz, and subsequent recovery to higher values at a frequency of 2,000 Hz. The graph demonstrates that each composite material displayed nearly identical sound absorption behavior at this density. In Fig. 4(b) (Density 450 kg/m3), at a density of 450 kg/m3, the SB50-CS50 mixture exhibiteda prominent peak in the SAC above 1,000 Hz, reaching a maximum value of 0.60. This observation aligns with the findings depicted in Fig. 4(c) (Density 520 kg/m3), where the SB50-CS50 mixture demonstrated a distinct peak in SAC above 1,000 Hz at a density of 520 kg/cm3, reaching a maximum value of 0.65.

These outcomes strongly suggest that the incorporation of CS in the composite mixture contributes to an enhanced sound absorption performance. The observed results indicate that modifying the composite material composition and increasing its density have a notable impact on SAC and NRC as shown in Fig. 5 (density A = 380 kg/m3, B = 450 kg/m3, C = 520 kg/m3), thereby highlighting the importance of material selection and density optimization in achieving the desired sound absorption characteristics (Nandanwar et al., 2017; Qui and Enhui, 2018).

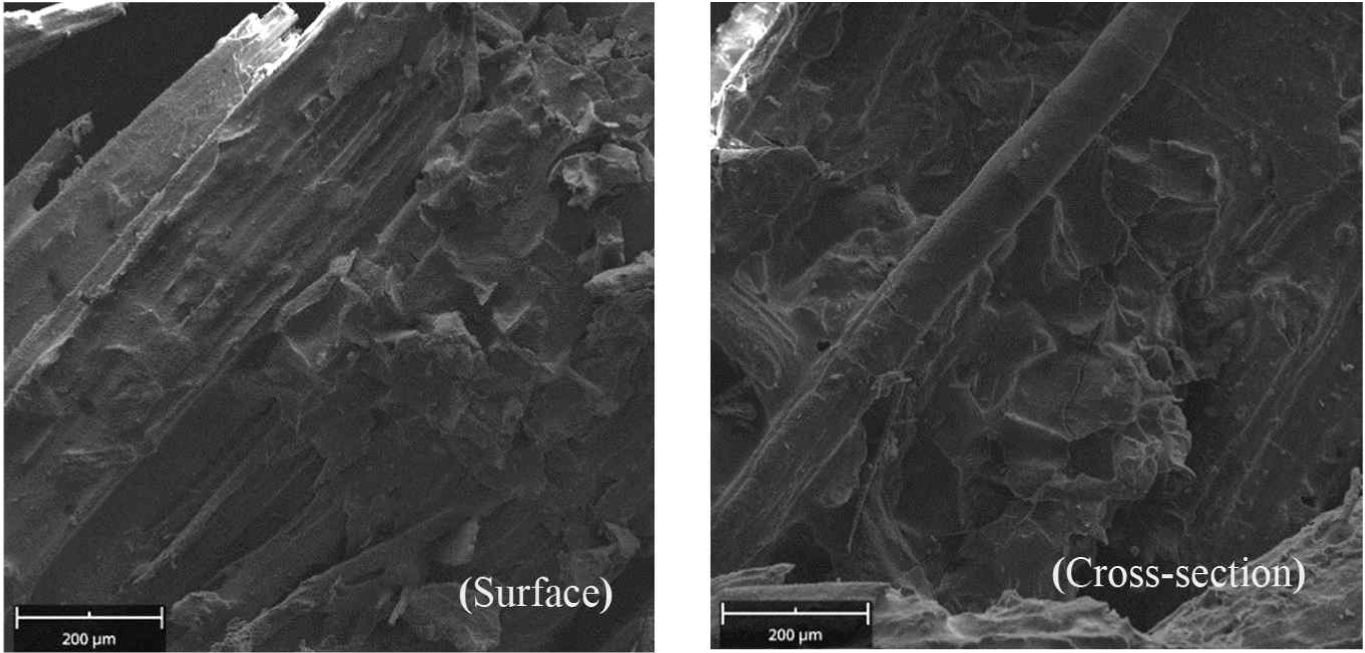
Fig. 6 depicts the SEM image of the composite surface and the cross-section image, revealing the intricate arrangement of two natural fibers, BS and CS, within the composite structure. This complex configuration contributes to the enhanced sound-absorbing properties of the composite materials.

4. CONCLUSIONS
In this study, the SACs of a natural fiber composite made from SB and CS were investigated using the impedance tube technique which gave the following conclusions:
-
The composite materials comprising SB and CS were tested for their sound absorption properties. It was observed that increasing the density of the sample sheets resulted in higher SAC values, with the density of 520 kg/m3 yielding the most favorable outcome. The interesting result can be further developed to achieve a higher density, thereby increasing efficiency in other areas such as improved mechanical characteristics. However, one must consider the porosity of the material, as it can affect sound adsorption efficiency.
-
The mixing ratio of the composite material plays a crucial role in enhancing its sound absorption properties, and the addition of CS has been found to be particularly beneficial. Based on the experimental results, it is recommended to use a ratio of 50% SB and 50% CS, as this composition allows for the formation of a complex structure inside the material, thereby improving its sound absorption characteristics.
-
Increasing the density of the composites also had a significant impact on the swell values. Among the experimental groups, the mixture with a ratio of 50% SB and 50% CS exhibited the highest anti-TS value.
-
This experiment showcases the potential of SB and CS as promising materials for the production of sound-absorbing products, presenting an environmentally friendly alternative.


