
1. INTRODUCTION
Teak (Tectona grandis L.f.) is a native tropical hardwood tree species from Asia which is highly valued in the global timber market (Kollert and Kleine, 2017). This ring-porous wood species is demanded of its natural durability, aesthetic properties, and mechanical resistance (CFC and ITTO, 2009; Ramasamy et al., 2021). In Indonesia, the teak wood is used for furniture and construction material. In addition, it is also possible to be used as material of glued products as well as other species (Galih et al., 2020; Iswanto et al., 2020; Prabuningrum et al., 2020; Sumardi et al., 2022). However, the global teakwood supply from the natural teak forests has been dwindling since the early 21st century (FAO, 2009; Pandey and Brown, 2000). It has also been forecasted that the natural teak forests will not be able to sustainably meet the demand for teakwood in the global market due to some critical environmental issues (FAO, 2015; Kyaw et al., 2020; Mon et al., 2012). However, teak plantations have a good prospect of sustainably supplying teak timber in the global market since the cultivation has been successfully established in 65 countries outside its natural distribution (Koskela et al., 2014). This has led to the development of several strategies to enhance productivity from all teak plantations to meet the increase in global demand (Kollert and Kleine, 2017; Lautenschlager, 2000; Midgley et al., 2015).
In Indonesia, a genetic improvement program to increase timber production from teak plantations has been conducted since 1983 by selecting over 680 plus trees from various places. The two best clones, which were numbered 97 and 110 were determined in 1997, after long consecutive genetic trials (Na’iem, 2001, 2014; Siswamartana et al., 2005). The productivity of those selected clones was reported to achieve more than 200 m3/ha in a 20-year rotation (Budiadi et al., 2017; Na’iem, 2014). Furthermore, intensive silvicultural practices must be incorporated and frequently applied in clonal teak plantation management protocols to maintain radial growth performance (Rahmawati et al., 2021; Seta et al., 2021).
Thinning and pruning were common silvicultural treatment practices used in maintaining the growth performance of timber plantations (Nyland et al., 2016; Smith, 1986). These treatments successfully enhanced the radial growth of the remaining stands in various species, namely Gmelina arborea (Vallejos et al., 2015), Larix kaempferi (Kim et al., 2016), Eucalyptus grandis hybrid (Filho et al., 2018), Eucalyptus camaldulensis (Aiso-Sanada et al., 2019), and Pinus koraiensis (Seo et al., 2019). In teak, previous studies reported that thinning and pruning treatments significantly increase the radial growth of the remaining stands (Budiadi et al., 2017; Kanninen et al., 2004; Víquez and Pérez, 2005). This showed that managing clonal teak plantations with thinning and pruning can improve teak timber production, thereby fulfilling the global demand.
Moreover, necessary precautions need to be taken during the implementation of thinning and pruning treatments to manage timber plantations. Previous studies reported that different intensities of these treatments can significantly affect the wood properties of various species. In 14-year-old clonal teak, different thinning intensities promoted significant differences in pilodyn penetration value, which was strongly related to basic density (BD; Seta et al., 2021). In Quercus acuta, heavy thinning treatment significantly generated a lower mean value of wood air-dried density compared to the un-thinned treatment (Hong et al., 2015). In Gmelina arborea, the values of specific gravity in higher thinning intensities were reported to be significantly reduced by approximately 7% compared to the lower intensity (Vallejos et al., 2015). This also occurred in Acacia salicina, where the treatment had a decrease in specific gravity value by 3.8% (Hegazy et al., 2014). However, a different result was reported in a 12-years-old Eucalyptus camaldulensis plantation, where the BD value was increased by 5.7%, without the alteration of the compressive strength parallel to grain (under green conditions; Aiso-Sanada et al., 2019). In Calabrian pine (Pinus nigra Arnold subsp. calabrica), implementing thinning intensity at 25% and 50% also increased the mechanical properties [dynamic modulus of elasticity (DMOE)] of the remaining trees compared to the un-thinned stands (Russo et al., 2019). Moreover, pruning treatment played an important role in the production of good-quality timber (Gartner et al., 2005; Stener et al., 2017; Víquez and Pérez, 2005).
There is limited information on the impact of thinning and pruning treatment on clonal teak wood properties. Therefore, this study aims to evaluate the physical and mechanical properties of clonal teak wood under thinning and pruning treatments. The results are designated to support new information on intensive silviculture practices in clonal teak cultivation.
2. MATERIALS and METHODS
The thinning and pruning trial was set on a clonal teak plantation at compartment 13, Wanagama Teaching Forest, Universitas Gadjah Mada, Yogyakarta, Java Island, Indonesia (7°54′S, 110°31′E) in December 2004 (Budiadi et al., 2017). The trial was established at an altitude of 214 m above sea level. The average temperature of the location is 27.7°C, 80%–90% of relative humidity and 1,900 mm/year of annual precipitation. The topography of the location is flat with the soil order of Entisol (limestone as the parent material). The clonal teak plantation was established in bulk planted of two improved clones, numbered 97 and 110, which were yielded from the teak tree improvement program that was initiated in 1997 (Na’iem, 2001, 2014).
Furthermore, the plantation site covers an area of 8 ha, with an initial tree spacing of 6 m × 2 m. The used initial spacing mimicked one of several teak cultivation spacing systems in Java, which had been scientifically proven to successfully accommodate agroforestry practices in teak plantations (Prehaten et al., 2021). It was considered to be narrow spacing in the teak cultivation system (Rahmawati et al., 2022), and the new wider space needed to be added periodically to avoid high intraspecific competition among clonal teak stands (Rahmawati et al., 2021). Adding new wider space periodically was proved to alleviate the growth stagnation of the stand since teak was determined to be an intolerant species (Pachas et al., 2019; Rahmawati et al., 2021). Therefore, the first thinning and pruning were applied 4.5 years after planting (Budiadi et al., 2017). In addition, the practice was reported to be not significantly altered the stem form of the stand (Pérez and Kanninen, 2005), and the improved clones were genetically selected based on the growth characteristics and stem form performance (Wardani and Na’iem, 2008), which the uniformity of the stem form was strongly influenced by genetic traits (Rao et al., 2001).
The trial was accomplished on a factorial randomized block design, where the tested factors were thinning and pruning intensities in three replications (Budiadi et al., 2017). These include control, moderate, and heavy for thinning, and low, medium, and high for pruning. Detailed information on the treatment levels is shown in Table 1. The study was conducted when the clonal teak plantation aged 15 years old. During the 10 years of post-thinning and pruning application, several trees that were found in the outer rows recorded died in some plots due to unpropitious conditions. Since very small removal may not affect growth (Smith, 1986), it was assumed that the dead trees did not significantly change the density of those plots.
All trees in the thinning and pruning trial plots were assessed for their growth characteristic, which includes the diameter at breast high (DBH, 1.3 m above ground level) and total height (H). A total of 27 representative trees (one tree per treatment on every replicate) were harvested for wood properties analysis. The representative trees were selected based on the mean DBH of each thinning treatment since the differences in DBH growth were significantly different among the thinning treatments as presented in Table 2. The stem cross-sectional samples (disks) collection was based on the procedure of Pérez and Kanninen (2005), with modification in collecting base disks obtained from each harvested tree at 0.10 m and 1.3 m above ground level (DBH). From the height of 2.0 m above, sections were taken along the stem at 2.0 m intervals until the diameter of the upper stem reach 14–10 cm. Therefore, the collected disk samples were considered to represent the wood properties of the whole tree and the differences in the height level represented the axial level factor. The two types of collected disks were those with (A) 8 cm thickness and (B) 5 cm thickness on each stem height interval. Disks-A were used to assess green moisture content (MCG), BD and shrinkage parameters [radial shrinkage (RS), tangential shrinkage (TS), shrinkage coefficient of anisotropy (T/R- ratio), and volumetric shrinkage (VS)]. Disks-B were used to assess the proportion content and the volume of heartwood [relative heartwood proportion (PHW) and volume of heartwood content (VHW)], respectively. Meanwhile, wood mechanical properties were assessed from log samples which were ± 58 cm in length, each, and were extracted from the stem height section between 1.3 m (DBH) to 2 m above ground level.
df: degree of freedom, Var: variance components, DBH: diameter of breast high (1.3 m above ground level), PHW: relative heartwood proportion, VHW: volume of heartwood content, MCG: green moisture content, BD: basic density, AL: axial level, RL: radial level, TS: tangential shrinkage, RS: radial shrinkage, T/R ratio: shrinkage coefficient of anisotropy, VS: volumetric shrinkage.
The disks with 5 cm thickness were used as samples during the assessment of heartwood. They were ground using a wood grinder on the surface of the transverse plane until the contrast differences between heartwood and sapwood areas emerged. Meanwhile, the disks with 8 cm thickness were prepared and cut to be two sample sets, namely (1) cube sample sets of 2 × 2 × 2 cm to measure wood moisture and wood MCG and BD, and (2) rectangular sample sets of 2 × 2 × 4 cm for shrinkage measurement. Those samples were taken along the radial strip at no interval from 0.5 cm after pith to bark for both sides. To prepare wood samples for assessing mechanical properties, the extracted logs were live-sawn in the middle of the log to obtain boards with 2.5 cm of thickness (radial strips). The boards were air-seasoned for a month until achieved air-dried conditions, which the wood’s moisture content at 20%–15% (Cassens, 1980). After a month, the mean wood moisture content of boards was achieved at 16.7 ± 0.4%, which was feasible to be used as specimen material for wood mechanical properties testing (Djati et al., 2015). Furthermore, the board were transformed into wood samples for mechanical properties testing, after reaching air-dried conditions (Djati et al., 2015; Savero et al., 2020). For the static bending test [modulus of elasticity (MOE) and modulus of rupture (MOR)], the sample dimension was 2 × 2 × 30 cm; and for the test of compression stress parallel (CSPL) and perpendicular to the grain (CSPD), a dimension of 2 × 2 × 6 cm was used. All samples were also taken along the radial strip (board) every 2 cm from 0.5 cm after pith to bark for both sides. Therefore, the differences in the radial distances represented the radial level factor.
In determining the physical properties of the thinning and pruning treatments’ effect on clonal teak wood, some parameters had to be assessed. In this study, the PHW and the total VHW were the initial parameters to be assessed. Based on Pérez and Kanninen’s (2005) method, the volume of heartwood was calculated by measuring the average heartwood diameter and total mean diameter (with and without bark) of two cross-sectional lengths (North-South and East-Weast direction) from disk B samples. The area of heartwood, sapwood and bark cross-sectional was determined as geometric circles (m2). The PHW (%) was estimated as the area of heartwood relative to the full area of the discs. The VHW (m3) was estimated employing the Smalian formulae (Clutter et al., 1983) and the section from the last-taken disk to the apex of the tree was determined as a geometric cone.
The MCG, BD, and wood shrinkage parameters [RS, TS, VS, and T/R-ratio] were assessed after the wood sample making process was completed. All measurements of each parameter were carried out according to the British Standard methods (BS 373:57; British Standards Institution, 1957). Firstly, the weight of the wood sample was measured (immediately, after the wood samples were made) using a digital scale (XE-310, Denver Instrument, Göttingen, Germany) and was considered as the sample weight in green condition. Then, the volume of the wood sample was determined in two different approaches. The water displacement method was used in estimating the wood sample volume for BD (Marsoem et al., 2014; Savero et al., 2020). Whereas for VS, the wood sample dimensional volume was measured using a digital calliper (CD−6” CS, Mitutoyo, Kawasaki, Japan) by multiplying the dimensional measurement of the longitudinal (L), tangential (T), and radial (R) direction length of the wood samples (L × T × R). Those volume measurements were conducted in green condition, thus considered as the sample volume in green condition. Subsequently, the wood samples were oven-dried using laboratory ovens (UN55, Memmert, Büchenbach, Germany) until the weight was constant at 103 ± 2°C, thus considered as the wood sample weight under oven-dried conditions. Under oven-dried conditions, the volume measurement of the wood samples was conducted again using the same method used in the green conditions. Finally, the values of MCG, BD, and shrinkage parameters (RS, TS, VS, and T/R-ratio) from green to oven- dried conditions were respectively determined using Equations (1) to (4) as follows (British Standards Institution, 1957; Savero et al., 2020):
where MCG (%) is the green moisture content of wood, Wg (g) is the wood sample weight in green conditions, Wod (g) is the wood sample weight under oven-dried conditions, BD (g/cm3) is the wood basic density, Vg (cm3) is the wood sample volume in green condition, xSg.o. is the percentage of dimensional shrinkage (%) of certain dimension (RS, TS, and VS) from green to oven condition, Lx.g. is the dimension length of certain direction (L, T, and R) in green condition (mm), Lx.o. is the dimension length of certain direction (L, T, and R) in oven-dried condition (mm), and T/R-ratio is the shrinkage ratio of tangential (TS) and radial (RS) dimension from green to oven-dried condition.
To determine the mechanical properties of the wood, several tests had to be conducted to obtain important information. These include the static bending test to estimate the value of the MOE and MOR of the wood samples. Moreover, the wood sample measurements of the compressive strength parallel to the grain (CSPL) and the compressive strength perpendicular to the grain (CSPD) were also conducted. These tests were carried out according to the British Standard methods (BS 373:57; British Standards Institution, 1957) for small clear specimens using Universal Testing Machine (UTM, Instron 3369, Instron, Norwood, MA, USA). Meanwhile, the static bending test was conducted using a single- point loading at the centre of the wood sample. The span and loading rate used was 28 cm and 2.54 mm/ minute, respectively. Meanwhile, the loading rate used in CSPL and CSPD was 0.50 mm/minute and 0.60 mm/minute, respectively. The values of MOE, MOR, CSPL, and CSPD were respectively calculated using Equations (5) to (8) as stated below (British Standards Institution, 1957; Savero et al., 2020):
where MOE is the modulus of elasticity (kgf/cm2, converted to GPa), ΔP is the load changes in proportion limit area (kgf), L is the span length of the wood sample (cm), ΔY is deflection at mid-length at the limit of area (cm), b is the wood sample width (cm), h is the wood sample thickness (cm), MOR is the modulus of rupture (kgf/cm2, converted to MPa); Pmax is the maximum load (kgf), CSPL is the compressive strength parallel to the grain (kgf/cm2, converted to MPa), Aparallel is the wood sample surface parallel to the grain (cm2), CSPD is the compressive strength perpendicular to the grain (kgf/cm2, then converted to MPa), Aperpendicular is the wood sample surface perpendicular to the grain (cm2).
A two-way analysis of variance (ANOVA) was used to examine the different effects of thinning and pruning treatments on PHW and VHW. Furthermore, the nested- factorial ANOVA was employed for MCG, BD, TS, RS, T/R-ratio, VS, MOE, MOR, CSPL, and CSPD. In MCG, BD, TS, RS, T/R-ratio, and VS, different effects of thinning, pruning, the axial level (nested within thinning, pruning, and the interaction of thinning-pruning), and the radial levels (nested within thinning, pruning, the interaction of thinning-pruning, and axial level) were evaluated. Meanwhile, in MOE, MOR, CSPL, and CSPD, the different effects of thinning, pruning, and radial levels (nested within thinning, pruning, and the interaction of thinning-pruning treatments) were evaluated. In this study, all factors were considered fixed effects. The variance components were also estimated in each source of variation. Furthermore, Tukey’s HSD tests were used for post hoc analysis of the treatments at α 0.05. Subsequently, statistical analysis was performed with the Statistical Analysis System (SAS) OnDemand for Academics (SAS Institute, Cary, NC, USA) and Microsoft Office Excel 2019 (Microsoft Corporation, Redmond, WA, USA).
3. RESULTS and DISCUSSION
In teak, the existence of the heartwood content is an important factor in determining its grade and possible utility (Trockenbrodt and Josue, 1999). In this study, the PHW of clonal teak was not significantly different among thinning treatments (p = 0.2551), pruning treatments (p = 0.6980), and the combination of thinning and pruning treatments (p = 0.5946; Table 2). Although A0 possessed the highest mean PHW, the differences between A1 and A2 were only approximately 3.01% and 1.19%, respectively (Table 3). Under various treatments, the mean PHW in this study was around 41.415 ± 4.83%–47.263 ± 4.30% (Tables 3 and 4). The results are almost similar to the findings of which 8 and 12 years old teak wood originated from seed sources (Wahyudi and Arifien, 2005). The heartwood content proportion was also noted to be higher compared to teakwood produced in the deciduous area in Ghana, where at the age of 20 years old, the heartwood content proportion was ± 7% less than the findings of this study (Amoah and Inyong, 2019). However, the results were lower compared to the older ages tree. In 70-year-old teak trees in East Timor, the average proportion of stands’ heartwood was ± 40% higher than the findings in this study (Miranda et al., 2011). This discrepancy was presumably caused by various influences, i.e., differences in the growth rate, type of stands, characteristics of the individual tree, age, genotype, topography, and site quality (Huh et al., 2020; Kim et al., 2020a, 2020b; Pinto et al., 2004).
PHW: relative heartwood proportion, VHW: volume of heartwood content, MCG: green moisture content, BD: basic density, TS: tangential shrinkage, RS: radial shrinkage, T/R ratio: shrinkage coefficient of anisotropy, VS: volumetric shrinkage, MOE: modulus of elasticity, MOR: modulus of rupture, CSPL: compressive strength parallel to the grain, CSPD: compressive strength perpendicul ar to the grain.
Furthermore, although the mean PHW of the clonal teak was not significantly altered by thinning treatment, the total heartwood volume content (VHW) of the clonal teak was significantly different among thinning intensity levels (p < 0.0001; Table 2). Meanwhile, the mean VHW of the conal teak was also not significantly differed by pruning treatments and the combination of thinning and pruning treatments (p = 0.9758 and p = 0.3156, respectively; Table 2). A2 possessed 0.646 ± 0.11 m3 in mean VHW, making it to be the highest and significantly different from other intensity levels (Table 3). This phenomenon was supposed to be induced by the nature of DBH growth under higher thinning intensity levels which tended to produce bigger log dimensions (Seta et al., 2021). Pérez Cordero and Kanninen (2003) also reported that in multi-ages teak, the heartwood volume raised with increasing DBH and decreased with raising stand density. Since different thinning intensity levels did not significantly alter the PHW, significant differences in the growth of DBH tended to produce more heartwood volume. Therefore, incorporating both silvicultural practices would generate an outstanding stands dimension without adversely affecting the development of heartwood in the clonal teak plantations, which is very beneficial for further clonal teak wood utilization.
In this study, the mean MCG of the clonal teak wood was significantly different among various thinning intensity levels (p < 0.0001; Table 2). Thinning was regarded as a significant source of variation, which contributed approximately a quarter of the total variation of the mean MCG (Table 2). A significant increase in the mean MCG of the clonal teak was noted to be A2, the highest among other thinning treatments (Table 3). However, the disparity of the mean MCG in A2 between A0 and A1 was only less than 5% (Table 3). Meanwhile, the mean MCG of the clonal teak wood was not significantly different under various pruning intensity levels (p = 0.196), with a contribution of a total variation of only 1.9% (Table 2). Nevertheless, the increase in the mean MCG under thinning treatments could be influenced by the level of pruning treatments, as indicated by the significance of the interaction effect of thinning and pruning treatments combination, which contributed to approximately a third of the total variation (p < 0.0001; Table 2). In the combination treatments, A2B2 had the highest mean MCG (Table 4). However, A2B2 differed significantly from A2B3, whereas A2B3 did not differ significantly from A0B1 (Table 4). Therefore, the increase of the mean MCG under thinning treatments indeed depended on the level of pruning treatments. Meanwhile, different axial levels within thinning treatments tended to strongly affect MCG mean values (p < 0.0001; Table 2).
Thinning and pruning practices were understood to affect the transpiration mechanism of the stands. This was because stand density reduction in thinning treatment increased the water availability in the soil by minimizing soil water stress due to a decrease in stand transpiration and canopy interception (Bréda et al., 1995; Forrester, 2015). Meanwhile, transpiration could be immediately reduced by removing part of the leaf areas of the trees as part of the pruning treatment mechanism (Forrester et al., 2012). These transpiration-reducing mechanisms led to increasing water use efficiency in which the water was used for wood formation (Forrester et al., 2012). In general, the mean MCG under all treatments (Tables 3 and 4) were almost similar to a previous study of 30 to 31 years old teak from various clones in India (Shukla et al., 2011). However, the results were higher compared to the finding in 8-year-old clonal teak from Muna island (Savero et al., 2020). Moreover, it was reported that MCG from a fresh-cut tree would be around 33%–249% of the absolute wood-dried weight, which is strongly affected by differences in the part of the stem, site, age, harvested season, and tree dimension (Shmulsky and Jones, 2011).
The moisture content in green condition (MCG) is one of the main parameters in determining wood quality since it determines the effectivity in the log hauling and wood drying process (Marsoem et al., 2014). Moreover, 10 years after the application of the treatments, thinning and pruning still significantly affected the mean MCG of clonal teak wood, suggesting the importance of both practices in clonal teak plantation management. Since higher thinning and pruning intensities tended to produce higher MCG (Table 3), additional treatment must be conducted to alleviate the adverse effect of high MCG on the clonal teak wood’s further utilization. The Implementation of girdling as a pre-harvest treatment could be an option for alleviating the inimical effect of high MCG on the thinned clonal teak stands. Girdling is a pre-harvest treatment that reduces the moisture content of the standing tree’s stem as a result of photosynthates flow impediment from reaching the root system by creating inward incisions encircling the stem from the periphery to the cambium zone (Basri et al., 2015; Noel, 1970). This method has been practiced for decades as part of the teak stand management in India, Indonesia (Java), Myanmar, and Thailand (Strugnell, 1932). Previous studies reported that several months of girdling in young ages trees was effective in reducing MCG by more than 50% from the initial MCG in teak (Rini, 2013), Acacia mangium (Basri et al., 2015), and various coniferous species (Laurila et al., 2014). Therefore, it was suggested to conduct girdling as a pre-harvest treatment when practising thinning and pruning regimes on the clonal teak plantation to alleviate the adverse impact of high MCG on clonal teak wood from both silvicultural practices.
BD is one of the most important aspects of wood properties. The result of ANOVA showed that different thinning and pruning intensities did not significantly affect the mean value of the clonal teak wood BD (p = 0.486 and p = 0.536, respectively; Table 2). Furthermore, the combination of thinning and pruning treatments also did not significantly alter the mean value of BD (p = 0.052; Table 2). In this study, although not significantly different, A0 had the highest mean value of BD compared to other thinning treatments and A2 possessed the lowest (Table 3). Meanwhile, B2 possessed the highest mean value of BD among the other pruning treatments (Table 3). These results were similar to a previous study in Costa Rica, in which different thinning intensities were reported to have no significant impact on the BD of teak wood from generative seed source origin plantations (Pérez and Kanninen, 2005). However, a previous study reported that different thinning intensities promoted significant alteration in the BD value of the clonal teak wood based on the significant differences in the mean value of pilodyn penetration toward the treatments (Seta et al., 2021). This discrepancy can be caused by the differences in the BD estimation approach. In this study, BD was estimated as the mean of the whole stem, which was assessed from various parts of the stem (axially and radially). Furthermore, the differences could also occur because the pilodyn penetration was more correlated to the wood density of the outer portion than the inner section of the stem (Wessels et al., 2011; Wu et al., 2010).
Furthermore, the effect of different axial levels within thinning was the biggest contributor to the total variation of mean BD (49.8%) as shown in Table 2, which was considered to be significant (p < 0.0001). Under various axial levels within thinning treatments, mean BD, in general, tended to decrease along with the increase in tree height (Fig. 1). The decreasing axial trend in the mean BD of this study corresponds to the results of a previous study on young teak wood (Moya Roque and Ledezma, 2003). However, in more mature ages of teak wood, the gradual changing pattern of mean BD was reported different, where the base level is lower compared to the near crown level (Miranda et al., 2011; Pérez Cordero and Kaninen, 2003). Meanwhile, the effect of different radial levels within thinning and axial levels contributed 37.5% to the total variation of mean mean BD, also considered to be significant (p < 0.0001; Table 2). The significance of radial level to the source of wood density variation has also been reported in previous studies of teak from Ghana (Amoah and Inyong, 2019) and Acacia melanoxylon from Portugal (Machado et al., 2014). However, the radial variations in the mean BD of clonal teak wood were predicted to be less significant with the increase in the tree age (Miranda et al., 2011; Rahman et al., 2004).
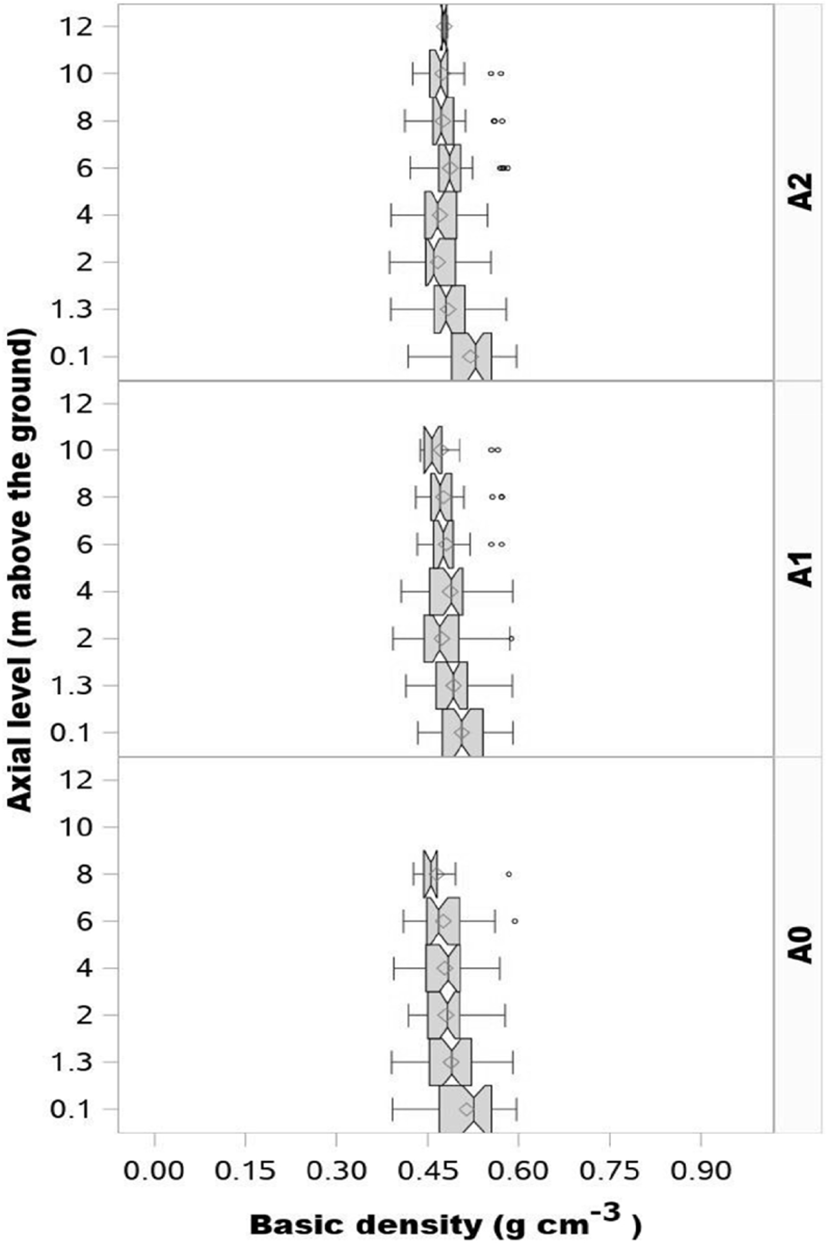
In general, the mean values of BD under all treatments showed to be around 0.478–0.492 g/cm3 (Tables 3 and 4). This is relatively similar to a previous report in Laos on 25 years old teak trees (Wanneng et al., 2014). However, the results were lower than the 50–70 years old teak trees from East Timor which possessed ± 17%–22% higher mean BD than the findings of this study (Miranda et al., 2011). Therefore, the application of thinning and pruning regimes in the clonal teak stands, based on our findings, did not promote any inimical effects on mean BD.
Under different thinning intensity levels, the mean TS, T/R-ratio, and VS were significantly different (p < 0.0001, p < 0.0001, and p < 0.0001 respectively; Table 2). Thinning was identified as an important source of variation, which contributes to more than 40% of the total variation in the mean TS, T/R-ratio, and VS (Table 2). Meanwhile, it was not considered a significant contributor to the total variation in RS (p = 0.747; Table 2). In this study, A2 had the highest mean TS, T/R-ratio, and VS compared to other thinning treatments, which was significantly different from A0 (Table 3). Furthermore, A1 was also found to be significantly different to A0 in the mean TS, T/R-ratio, and VS (Table 3). However, only in mean VS, A1 was found to be significantly different from A2 (Table 3). Despite its insignificance, A2 promoted the highest mean RS compared to other thinning treatments which significantly alter the mean TS and T/R-ratio (A2 ≈ A1 > A0; Table 3). Meanwhile, the higher thinning intensities were applied, the bigger the mean VS would be (A2 > A1 > A0; Table 3). Whereas thinning did not promote any significant differences in mean RS (A0 ≈ A1 ≈ A2; Table 3).
Furthermore, under different pruning intensity levels, the mean RS and VS were significantly different (p = 0.0303 and p = 0.0445, respectively; Table 2). The results also showed that pruning contributed to approximately 28.16% and 7% of the total variation in the mean RS and VS, respectively. However, it was not considered to be a significant contributor to the total variation in TS and T/R-ratio (p = 0.215 and p = 0.6583, respectively; Table 2). Meanwhile, B2 performed the highest mean RS compared to other pruning treatments, which was also significantly different from B1 (Table 3). In addition, the highest mean VC (11.424 ± 0.74%) was possessed by B3, which also varied from B1 (Table 3). Furthermore, B3 and B2 were also found to be significantly different to B1 in the mean RS and VS, respectively (Table 3). Therefore, pruning tended to significantly alter the mean RS and VS (B2 ≈ B1 > B0) and did not promote any differences in mean TS and T/R-ratio (B0 ≈ B1 ≈ B2).
This study showed that the increase in the mean TS, T/R-ratio, and VS under thinning treatments depended on the level of pruning, as indicated by the significance of the interaction effect of both treatments (p < 0.0001, p < 0.0001, and p < 0.0001, respectively; Table 2). The interaction of thinning and pruning treatments in mean TS, T/R-ratio, and VS contributed to the total variation of approximately 43%, 25%, and 32%, respectively (Table 2). In contrast, it did not significantly differ from the alteration in mean RS (p < 0.0001; Table 2). Increasing pruning intensity levels in any of the A0 treatments did not significantly alter the mean TS, T/R-ratio, or VS (Table 4). Meanwhile, in A1 treatments, an increase in pruning intensity levels escalated the mean TS, T/R- ratio, and VS significantly (Table 4). However, when the highest pruning intensity level was applied in A2, there was a significant decrease in the mean of TS, T/R-ratio, and VS (Table 4). Axial variation (within thinning) tended to significantly differentiate the mean values of wood dimensional shrinkage variables (Table 2). The mean T/R-ratio and VS decreased gradually as the tree height increased, with significant differences from the base to the highest level (Fig. 2).
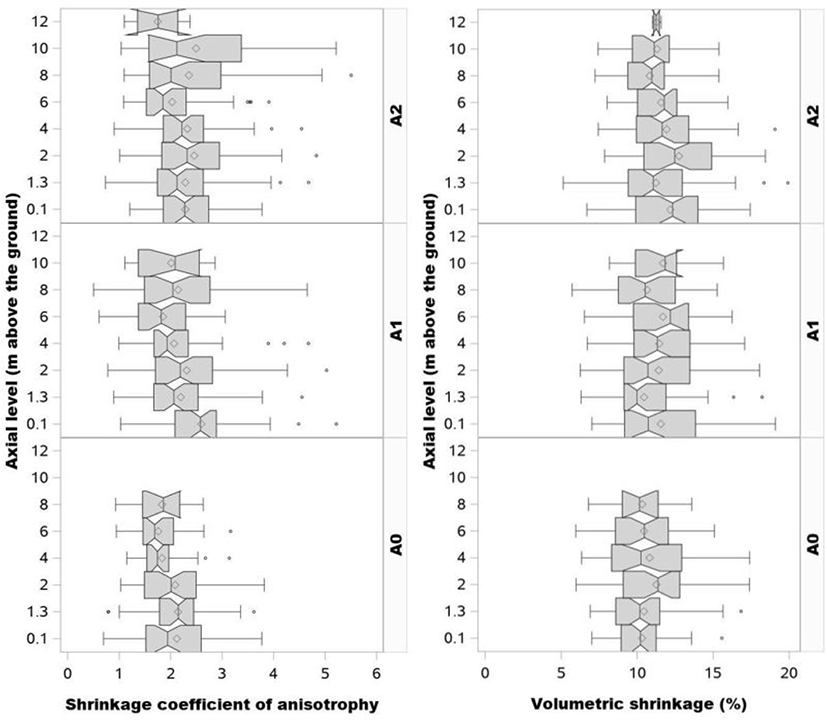
Furthermore, compared to 11-year-old clonal teak and 14-year-old seed source teak planted in Java, it was discovered that TS and RS were lower, but the T/R-ratio was relatively higher (Hidayati et al., 2016). Meanwhile, the TS, RS, and VS of this study were also higher compared to the study in mature-aged teak wood (Marsoem et al., 2014; Miranda et al., 2011). The T/R- ratio is an important wood dimensional stability parameter that indicates the best use of wood in terms of drying quality, which leads to dimensional stability (Christoforo et al., 2016). The T/R-ratio was generally around 1.5 to 2.5 for all species of tree, therefore, the lower the value, the more stable the wood for not being bent during board making (Quarles and Valachovic, 2012).
The wood’s dimensional stability is an important property that determines how much wood shrinks or swells with changing moisture content, which shows its suitability for various applications (Sargent, 2019). Thus, significant changes in wood dimensional stability parameters must be considered an important issue in the process of teak timber production. This study discovered that thinning, pruning, or both treatments had a significant impact on the TS, RS, T/R-ratio, and VS of clonal teak wood (Table 2). Those practices tended to increase the wood shrinkage rate in all directions and were considered detrimental to wood dimensional stability (Shmulsky and Jones, 2011). Therefore, necessary precautions had to be taken in the implementation of these silvicultural practices on clonal teak stands. The application of further treatment could be considered when both silvicultural practices were implemented. Girdling could also be applied as a pre-harvest treatment because of its ability to reduce TS, RS, and T/R-ratio significantly, indicating increased wood dimensional stability (Basri et al., 2015).
The mean MOE and MOR did not differ significantly across all thinning treatment intensity levels (p = 0.2481 and p = 0.3922; Table 5). Although not statistically significant, A1 had a higher mean MOE and MOR than A0 and A2 (Table 3). Furthermore, A1 increased the mean MOE of ± 4% from A0 but under A2, the mean MOE only increased by 0.7% (Table 3). In MOR, the trend was slightly different, A1 promoted an increase of MOR by approximately 2.4% from A0 but A2 tended to decrease MOR by approximately 1.3% from A0 (Table 3).
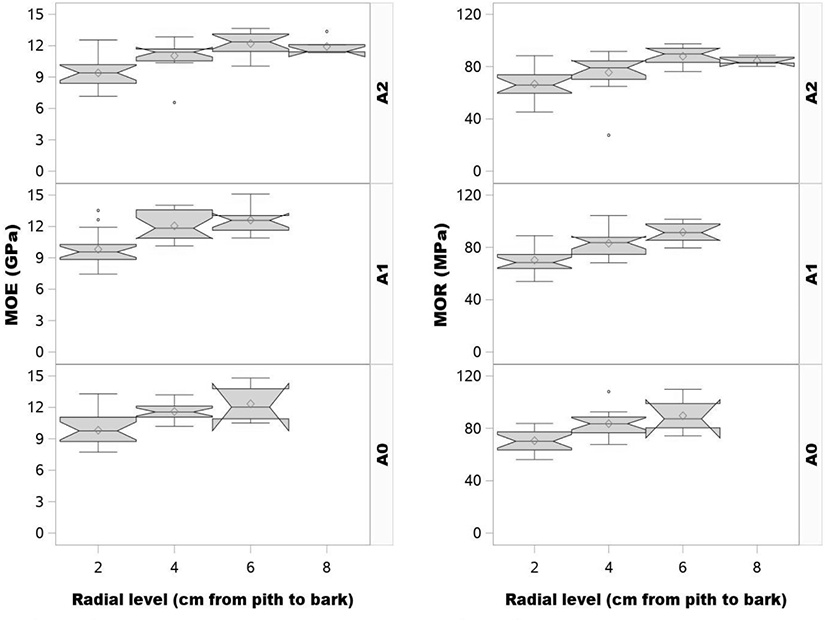
The effect of different pruning intensity levels on mean MOE and MOR was also not significantly different (p = 0.4111 and p = 0.5925, respectively; Table 5). Although not significant, B3 had the highest mean MOE and MOR under pruning treatments, while B1 had the lowest (Table 3). Therefore, the higher the pruning intensity levels applied, the more MOE and MOR increased (Table 3). The combination of thinning and pruning treatments gave insignificant changes in both mean MOE and MOR (p = 0.7816 and p = 0.4925, respectively; Table 5). Radial levels within thinning treatments, however, had a significant effect on mean MOE and MOR variations (p < 0.0001 and p < 0.0001, respectively), which contributed more than 85% of the total variation (Table 5).
In this study, the mean MOE ranged from 10.843 ± 1.75 to 11.235 ± 1.82 GPa across all treatments, while the mean MOR, across all treatments, ranged from 77.168 ± 14.11 to 80.214 ± 12.46 MPa (Table 3). These results were superior to previous studies on the 8-year- old clonal teak from Muna Island (Savero et al., 2020); 11-year-old clonal teak trees from Java (Hidayati et al., 2016); and 10–20-year old teak trees from Ghana’s dry region (Amoah and Inyong, 2019). Furthermore, the mean MOE was also more than the 12-year-old teak stands from three different agroforestry management systems in India, where the mean MOR was within the range (Shukla and Viswanath, 2014). The mean MOE values in this study were in range with previous investigations on 21-year-old teak (Bhat and Priya, 2004), 35-year-old teak (Thulasidas and Bhat, 2012), and 50-70 years teak (Miranda et al., 2011). However, when compared to the older ages of teak trees, the mean MOR in this study was relatively lower (Bhat and Priya, 2004; Miranda et al., 2011; Thulasidas and Bhat, 2012). Moreover, a previous report showed the importance of radial level as the source of MOE and MOR variation in teak (Amoah and Inyong, 2019). A gradual increase was observed in both MOE and MOR from the area near the pith to the area near the bark at various radial levels within thinning treatments (Fig. 3). This gradual increasing trend on radial levels had also been identified, whether in young (15−20-year-old) or mature (50−70-year-old) teak trees (Amoah and Inyong, 2019; Miranda et al., 2011). However, only young teak showed significant differences at various radial levels, and the area near the pith was lower than the area near the bark (Amoah and Inyong, 2019).
The MOE and MOR represent wood stiffness and strength, which are important mechanical properties for structural or construction timber (Ross, 2010; Shmulsky and Jones, 2011). Teak is one of the tropical tree species whose timber has been used for structural or construction purposes since antiquity (Ramasamy et al., 2021; Thulasidas and Bhat, 2012). Therefore, the information on the alteration of MOE and MOR in the teak timber production process was critical. In this study, thinning and pruning treatments did not affect the alteration of mean MOE and MOR of clonal teak wood (Table 3). This was in line with previous results, where heavy and moderate thinning programs on teak in India and Myanmar did not significantly change the strength properties (Kadambi, 1972). Therefore, the implementation of both treatments will not adversely affect the MOE and MOR of the clonal teak stands.
In the compressive strength measurements, either mean CSPL or mean CSPD were not significantly different across all thinning treatment intensity levels (p = 0.8134 and p = 0.6693, respectively; Table 5). Although not statistically significant, A2 promoted approximately 1.1% and 3.7% increase from A0 in mean CSPL and CSPD, respectively (Table 3). There was no difference between the effect of various pruning intensity levels on mean CSPL and CSPD (p = 0.1382; and p = 0.1449, respectively; Table 5). In pruning treatment, the highest mean CSPL was B2, while in mean CSPD was B1 (Table 5). The combination of both treatments gave insignificant changes in CSPL and CSPD (p = 0.3789 and p = 0.3445, Table 5).
In this study, the mean CSPL ranged from 41.573 ± 6.13 to 43.789 ± 5.22 MPa across all treatments (Table 3). Meanwhile, the mean CSPD under all treatments ranged from 14.127 ± 2.42 to 15.102 ± 2.06 MPa (Table 3). The CSPL values were significantly higher compared to studies of younger-aged clonal teak trees at 8 years (Savero et al., 2020), 10 years (Hidayati et al., 2015), and 11 years (Hidayati et al., 2016). Furthermore, in comparison with 10–20 year teak trees from Ghana, the mean CSPL showed lower values (Amoah and Inyong, 2019). In older-age teak trees, the obtained values were also lower, compared to 21 years (Bhat and Priya, 2004), 32 years (Thulasidas and Bhat, 2012), and 50–70 years (Miranda et al., 2011). Meanwhile, the mean CSPD in this study were also considered to be lower compared to a previous report in the same region, which ranged from 15.28 MPa to 21.83 MPa (Marsoem et al., 2014).
In addition, radial levels within thinning treatments had a significant effect on mean CSPL but not on mean CSPD variations (p = 0.0093 and p = 0.0683, respectively; Table 5). This phenomenon could be caused by the variation of lignin content, in which the lignin content decreased significantly from the outer part of the wood to the inner part of the wood of clonal teak (Lukmandaru et al., 2016). Since the resistance of the wood structures to the comprehensive force was determined by lignin content, therefore, parts of wood with high lignin content tended to possess better strength (Fagerstedt et al., 2015; Iswanto et al., 2021). The CSPL and CSPD are also important compression strength parameters in determining the quality of the wood’s mechanical properties (Ross, 2010). In structural timber application, CSPL will determine the load a column carries, while CSPD is important in the design of building connections between wood members and beam supports (Shmulsky and Jones, 2011). Therefore, the information on the alteration of both strengths is essential in teak timber production, which is one of the best construction materials (Ramasamy et al., 2021; Thulasidas and Bhat, 2012). In this study, thinning and pruning treatments did not affect the alteration of mean CSPL and CSPD of clonal teak wood (Table 5). This was in line with a previous report, where heavy and moderate thinning regimes on teak in India and Myanmar did not change the strength properties (Kadambi, 1972). Therefore, the implementation of both treatments did not adversely affect the CSPL and CSPD of the clonal teak stands.
This study suggests that the implementation of thinning and pruning regimes in the clonal teak plantation as part of intensive silvicultural techniques did not have a significant adverse effect on its heartwood development (PHW and VHW), BD, and mechanical properties (MOE, MOR, CSPL, and CSPD; Tables 2, 3, and 5). The results showed that moderate thinning had the highest mean MOE and MOR, while heavy thinning promoted the greatest mean value in both CSPL and CSPD (Table 3). It had also been reported that thinning practices at certain intensities tended to improve the mechanical properties of the stand (Russo et al., 2019; Seta et al., 2021; Wang et al., 2005). Meanwhile, necessary precautions were needed to be taken in implementing higher thinning and pruning intensities since those practices significantly altered the mean of MCG and dimensional stability (TS, RS, T/R-ratio, and VS) of the clonal teak wood (Tables 3 and 5). To diminish the adverse impact of high MCG and wood shrinkage parameters, additional pre-harvest treatment must be incorporated as an integral component of clonal teak plantation management when thinning and pruning regimes were implemented. Girdling is one of the pre-harvest treatments that have been scientifically proven to reduce MCG and wood dimensional shrinkage of the stands in various species (Basri et al., 2015; Laurila et al., 2014; Rini, 2013). Therefore, it is suggested that girdling has to be incorporated when thinning and pruning regimes will be applied in managing genetically-improved clonal teak plantations.
4. CONCLUSIONS
The implementation of thinning and pruning regimes as part of the clonal teak plantation silvicultural activities had no detrimental effects on the alteration in mean PHW, VHW, BD, MOE, MOR, CSPL, and CSPD. This showed that both regimes had a positive impact on the clonal teak’s mechanical properties. However, various thinning intensity levels caused significant differences in the mean MCG, TS, T/R-ratio, and VS, where the mean alteration was influenced by the levels of the pruning treatment. The variations in mean RS and VS were also produced by several pruning intensity levels. The results also showed that reducing stand density by 50% (heavy thinning) will increase MCG, T/R-ratio, and VS by 4.65%, 15%, and 1.08%, respectively. When thinning and pruning regimes in clonal teak plantations will be applied, necessary consideration must be given to the considerable impact on MCG, TS, RS, T/R-ratio, and VS. To alleviate the adverse impact on high MCG and wood shrinkage parameters, additional pre-harvest treatment needs to be incorporated as an integral component of clonal teak plantation management when thinning and pruning regimes are implemented. Therefore, the inclusion of thinning and pruning regimes into the clonal teak plantation management protocol will not significantly affect the wood properties.