1. INTRODUCTION
Recently, interest in lifestyles of health and sustainability and well-being has increased owing to the increasing income and consciousness of the general population. In particular, interest and demand for wood and wood materials, which are representative eco-friendly materials, have been continuously increasing. Therefore, various studies have been conducted related to wood-based materials, addressing aspects such as the excavation of surface/middle layer materials, adhesive changes, functional materials, and additive complexes. Thus, wood-based materials are being re-discovered as cost-efficient, durable, and functional eco-friendly materials (Han et al., 2019; Hwang and Oh, 2020a; Hwang et al., 2021; Iswanto et al., 2020; Jamaludin et al., 2020; Jang et al., 2017; Kang et al., 2015; Kim, 2017; Lee and Kim, 2020; Lee et al., 2016; Oh et al., 2014; Park and Jo, 2020; Roh, 2016; Seo et al., 2018; Setyayunita et al., 2022; Wibowo et al., 2021). In addition, to save and utilize wood resources, research has been conducted on efficient recycling, such as the production of wood-based materials by recycling and compounding sawdust, short-cut materials, and waste materials (Hwang and Oh, 2020b, 2021; Hwang et al., 2013; Prabuningrum et al., 2020).
The number of leisure activities has been increasing as well, according to alternative holidays and weekend holidays for promoting the welfare of humans and revitalizing economies. The installation and use of outdoor play facilities, such as waterwheels, windmills, tables, and benches, has been rapidly increasing. Accordingly, the demand for eco-friendly functional composites that can be safely and functionally used at these outdoor play facilities has been increasing as well.
Cork is made of the bark that is harvested periodically from the trunks and branches of cork or oyster oaks. It is very light and has very high liquid resistivity. In addition, it has excellent insulation and sound absorption properties, providing insulation with respect to heat and sound. In addition, cork is not slippery, owing to its high coefficient of friction, and has good compressibility and elasticity (Kim, 1993). These advantages should be contrasted with the disadvantages of wood, which exhibits poor water resistance; therefore, cork can be used in settings characterized by moisture and high humidity. In particular, cork is not only used for making bottle caps, academic tools, and memo boards, but also for making handles, backrests, and ceilings that require safety at outdoor play facilities such as windmills, waterwheels, outdoor benches, and swings, owing to its light weight, compressibility, and elasticity. However, as mentioned above, cork is made of the wood bark; therefore, its strength is significantly lower than that of wood. Therefore, when cork is manufactured and used in boards, its strength is typically reinforced by attaching a base plate, such as wood or a wood-based material, under the cork board. In addition, owing to the cork disadvantages, it is very difficult to use it on curved surfaces; in particular, it cannot be effectively used in handles, ceilings, or backrests of outdoor play facilities.
In this study, to increase the applicability of reinforced cork boards at outdoor play facilities, three types of cork composites were manufactured by reinforcing cork with metal, glass fiber, and carbon fiber. The effects of the reinforcing materials on the mechanical properties of the studied cork composites were investigated.
2. MATERIALS and METHODS
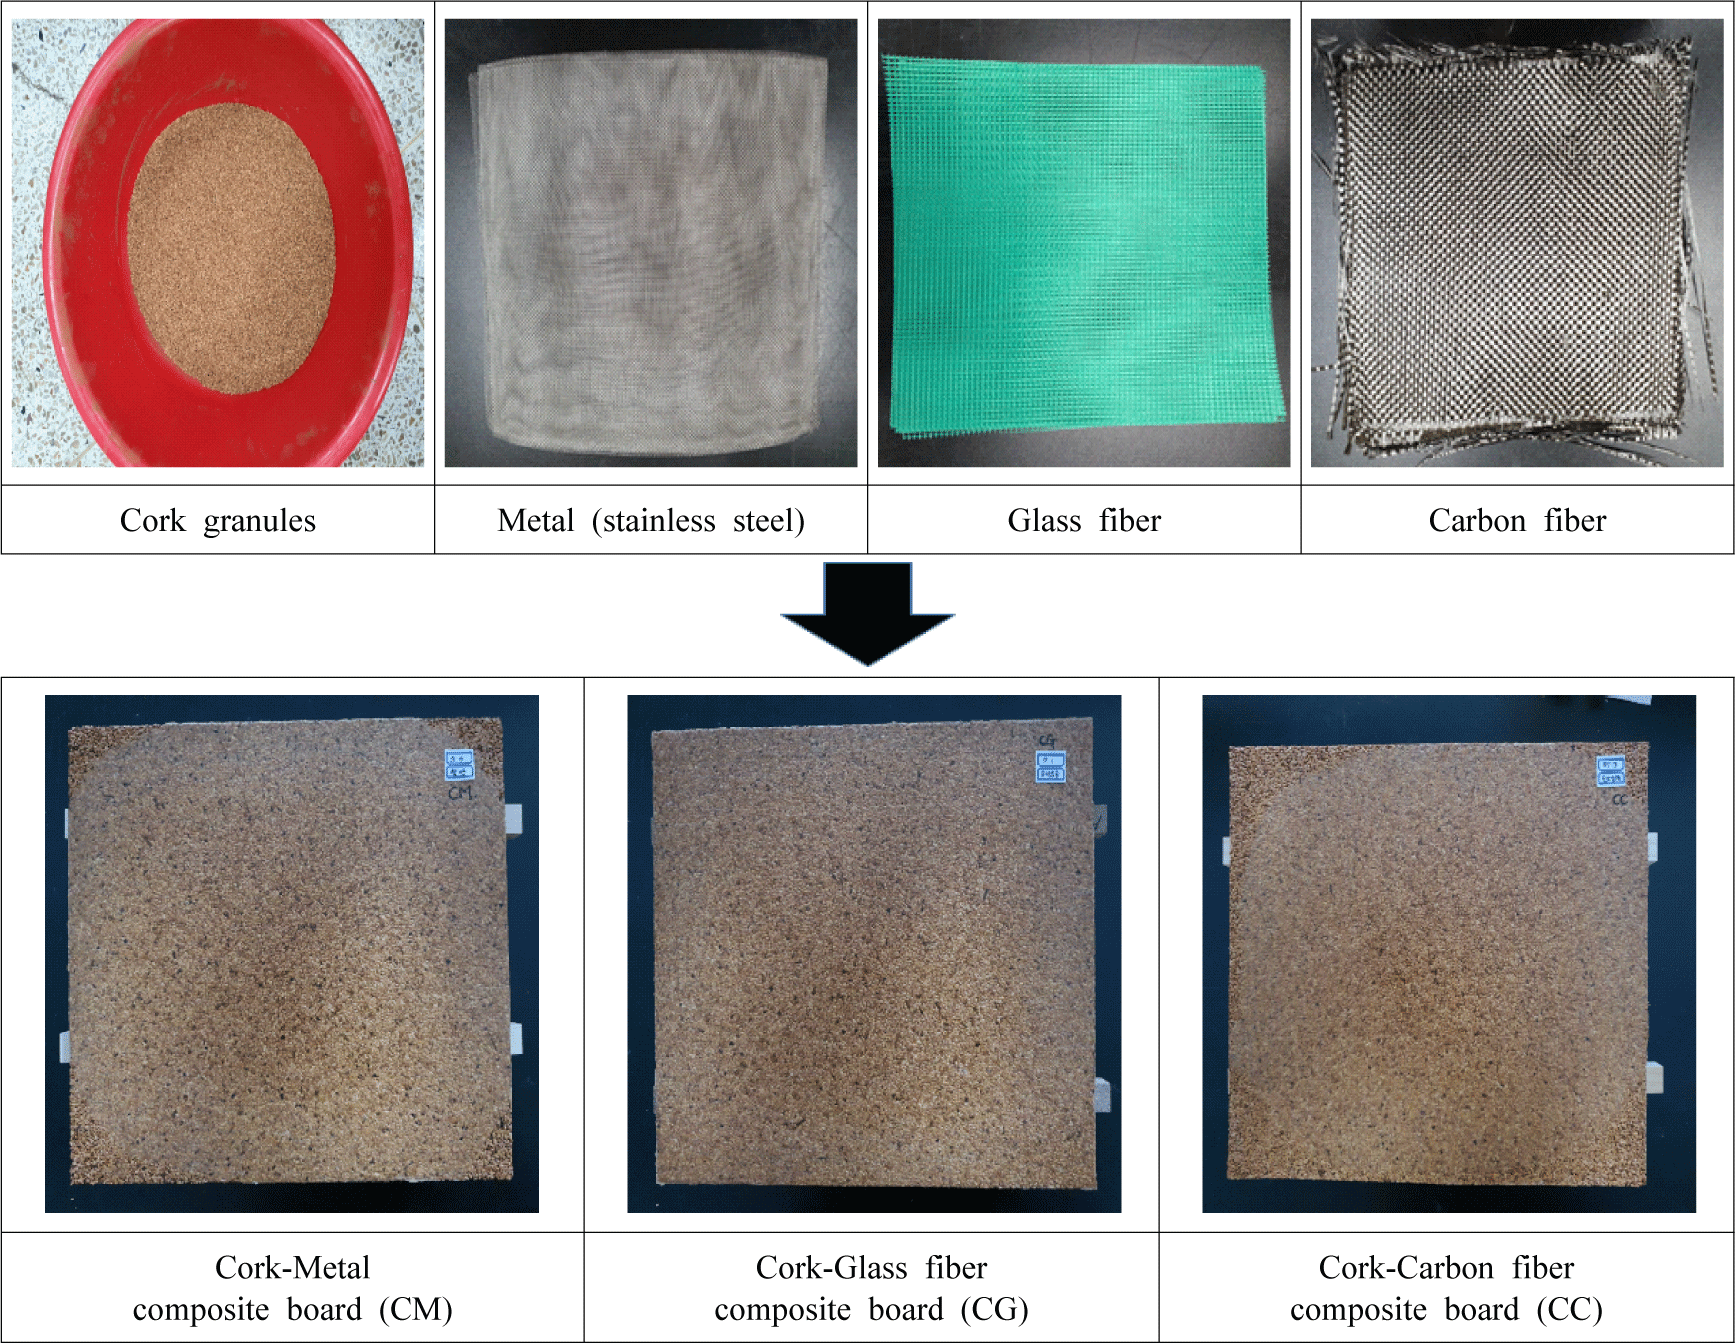
The cork specimens in the present study were prepared by crushing the bark of a cork oak (Quercus suber L.). Cork granules (size, 2–4 mm) were purchased from FC Korea Land (Seoul, Korea). Three types of cork composites, in which a metal, a glass fiber in the form of a mesh, and a carbon fiber in the form of fabric were inserted into the middle layer of cork granules (width, 300 mm; length, 300 mm; thickness, 14 mm). The reinforced metal, glass fiber, and carbon fiber were 300 mm in width and length, while their thickness was 0.4 mm. The number of meshes was 14 for the metal and glass fibers, while the carbon fiber was used in the fabric form. The strength performances of metals, glass fibers, and carbon fibers used as reinforcing materials in cork composites are described elsewhere (Miyairi, 1999) and in Table 1. The target density of the cork composite boards was 450 kg/m3. The cork composite boards are shown in Fig. 1. Each board was cut into rectangular sections (width, 20 mm; length, 300 mm) that were used as test pieces by controlling humidity at 20°C and 65% RH for 7 days or more. The adhesive that was used for manufacturing the studied cork composite boards was room-temperature curing polymeric methylene diphenyl diisocyanate resin, and the amount of spread was used in the weight ratio of 1:0.6 of cork granules. A mat was formed by placing cork granules and three reinforcing materials into a molding mold and then pressing for 24 h at a pressure of 0.98 MPa. Eleven test pieces were made for each condition.
| Type | ρ (kg/m3) | ET (GPa) | σT (MPa) | σB (MPa) |
|---|---|---|---|---|
| Metal (stainless steel) | 8,200 | 210 | 1,040 | 650 |
| Glass fiber | 2,510 | 76 | 2,500 | - |
| Carbon fiber | 1,750 | 230 | 3,500 | - |

Static bending strength tests were conducted on the prepared cork composites by three-point loading, using a universal test machine (Instron 6569, Instron, Norwood, MA, USA). The span was 270 mm and the cross-head rate was 10.0 mm/min. The static bending modulus of elasticity (E) was calculated using Equation (1) and the bending modulus of rupture (σ) was calculated using Equation (2). The bending strain (ε) was calculated using Equation (3).
In the above equation, P is the load, l is the span, b is the specimen width, h is the specimen thickness, and y is the deflection.
In the above equation, Pmax is the maximal load, l is the span, b is the specimen width, and h is the specimen thickness.
In the above equation, l is the span, h is the specimen thickness, and y is the deflection.
The tested specimens were obtained by cutting out square sections (width, 50 mm; length, 50 mm) from three cork composite boards (width, 300 mm; length, 300 mm). The prepared specimens were used as the test specimens for the tensile peel test. To measure the IB strength of the cork composite boards, in each case a metal block was adhered to an epoxy resin on both sides of the tested specimen prepared in accordance with the Korean Industrial Standard KS F 3200 (Korean Standards Association, 2021). This block was suspended on the load attachment of a material testing machine, a tensile load was applied to peel the test piece, and the peel strength at break was measured. The crosshead speed was 2 mm/min. The load was applied perpendicular to the plate plane of the tested specimen, the maximal load at the time of the peel failure of the test piece was registered, and the IB was calculated using Equation (4).
In the above equation, P is the maximal load at the peel failure and A is the specimen area (mm2).
3. RESULTS and DISCUSSION
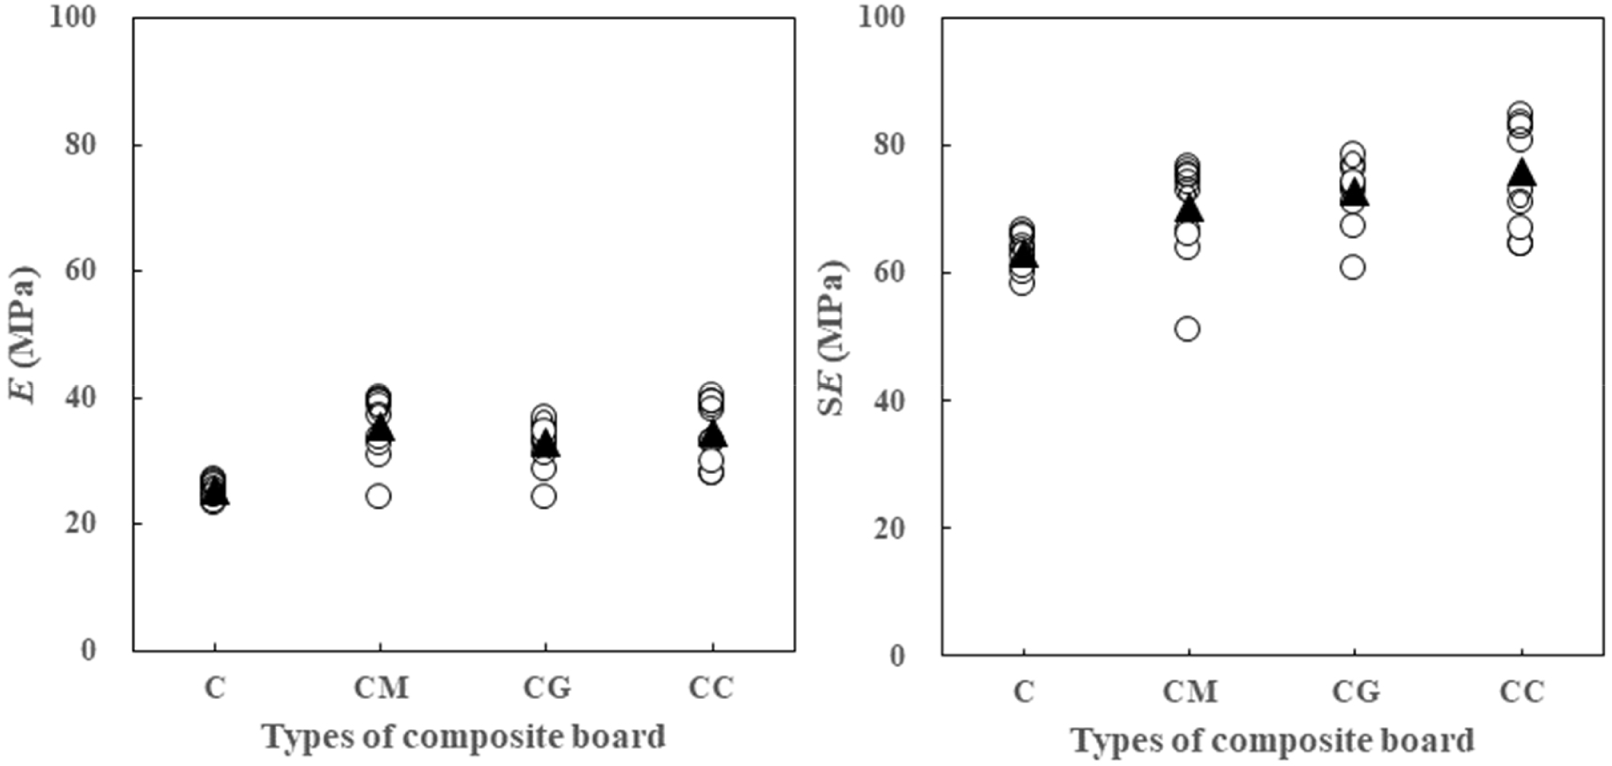
Table 2 shows the results of the static bending test for the three types of cork composite boards that were reinforced with metal, glass fiber, and carbon fiber. The effects of the reinforcing materials on the static bending moduli of elasticity (MOE) of the cork composite boards are shown in Fig. 2.
ρ: density, E: bending modulus of elasticity, SE: specific bending modulus of elasticity, σ: bending strength, Sσ: specific bending strength, IB: internal bond, SIB: specific internal bond, C: cork board, CM: cork-metal composite board, CG: cork-glass fiber composite board, CC: cork-carbon composite board.

As for the static bending MOE of the cork composite boards, the cork-metal composite board (CM) exhibited the highest value with an average of 35.9 MPa, followed by the cork-carbon fiber composite board (CC) with an average value of 35.0 MPa, while the cork-glass fiber composite board (CG) exhibited the lowest average value, at 32.7 MPa. On average, the bending MOEs were improved by 29%–41%, compared with the 25.4 MPa value for cork boards manufactured only with cork granules. These values were 45%–77% higher than the bending MOE value of 20.25 MPa for the a cork density of 120 kg/m3, tested based on ASTM D-790 and reported by Soares et al. (2011) but were 10%–15% lower than the bending MOE value of 39.1 MPa for the cork density of 200 kg/m3. It was confirmed that the bending MOE of a cork board could be effectively improved by simply reinforcing its middle layer with a thin mesh material composed of metal, glass fiber, or carbon fiber. However, the obtained values were quite low, 0.17%–0.19% compared with the oak cork (Byeon et al., 2016), and it also exhibited very low values of 0.48%–0.53% for oriented strand board (OSB), 0.98%–1.07% for medium density fiberboard (MDF), and 1.11%–1.21% for particleboard (PB; Park et al., 2009).
The specific bending MOE (the ratio of the MOE to the specific gravity) values of the studied cork composite boards are shown in Fig. 2. As for the specific bending MOE values of the cork composite boards, the CC exhibited the highest value (at 75.8 MPa), and the CM, which had the highest density among the three cork composite boards, exhibited the lowest value (at 70.4 MPa). These values for the cork composite boards improved by 12%–20% compared with those for the cork boards made only of cork granules. However, these values were approximately 96% higher than the MOE of the CM and approximately 117%–123% higher than the MOE values of the CG and CC.
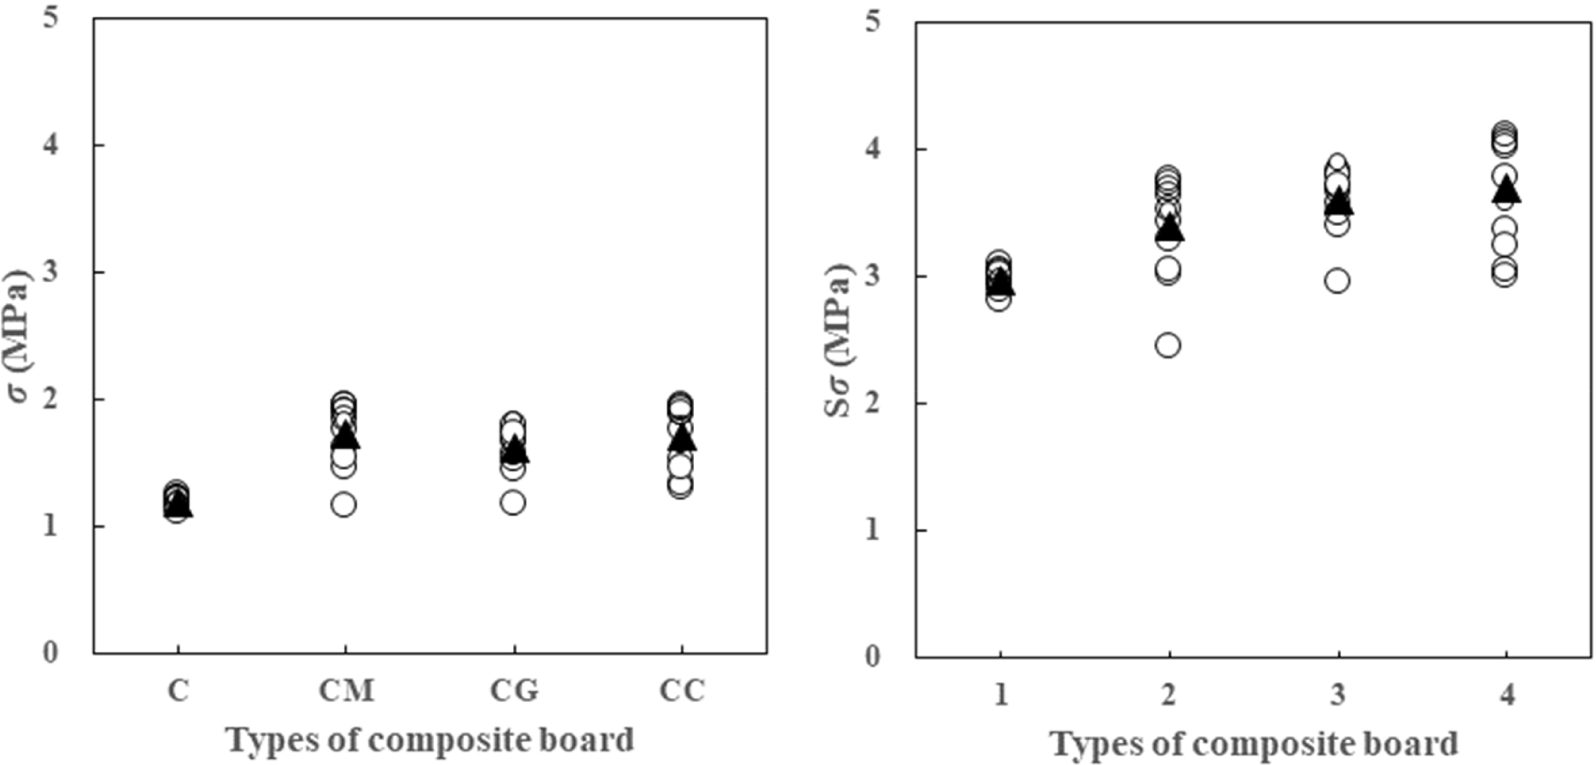
The effect of the reinforcing materials on the static bending strengths of the cork composite boards is illustrated in Fig. 3. As for the static bending strength, the CM exhibited the highest average value (at 1.73 MPa), followed by the CC with the average value of 1.71 MPa, while the CG exhibited the lowest value (at 1.62 MPa). However, on average, this result constituted a 35%–45% improvement in the bending strength, compared with the cork boards manufactured only with cork granules, and this improvement was higher than the improvement of the bending MOE. These values were 166%–184% higher than the bending strength (0.61 MPa) for the cork density of 120 kg/m3 tested based on ASTM D-790 by Soares et al. (2011), and were 31%–40% higher than the bending strength (1.24 MPa) for the cork density of 200 kg/m3. The bending strength of the cork board was more substantially improved by reinforcing the cork board’s middle layer with three types of thin mesh materials, similar to the bending MOE. However, it was found that this value exhibited a very low value of 1.40%–1.50%, compared with that for oyster oak (Byeon et al., 2016), and was lower than 6.71%–7.20% for OSB, 5.07%–5.44% for MDF, and 11.8%–12.7% for PB (Park et al., 2009).

As shown in Fig. 3, the specific bending strength (the ratio of the bending strength to the specific gravity) of the cork composite boards was the highest for the CC (at 3.71 MPa), whereas the CM, which had the highest density of the three cork composite board types, exhibited the lowest value (at 3.41 MPa). The specific bending strength was 15%–25% higher than for the cork board made only of cork granules; thus, the improvement was not large compared with that for the bending strength. This value was 97%–123% higher than the bending strength of the cork composite boards, and the degree of increase was confirmed to be similar to that of the bending MOE. The resultant improvement was slightly lower value than 148% for the cork boards manufactured with only cork granules.
The bending strains of the cork composite boards were calculated using Equation (3), as described in the previous section, and the resultant values exceeded 5.8%, significantly higher than 1.1% as reported for oyster oak tree cork boards (Byeon et al., 2016). However, for all specimens, no fractures occurred even for the extreme material-testing loads supported by the measuring instrument; therefore, we reported these values. Based on the above, cork composite boards can be efficiently used in various applications requiring bending or curved plane attachments.
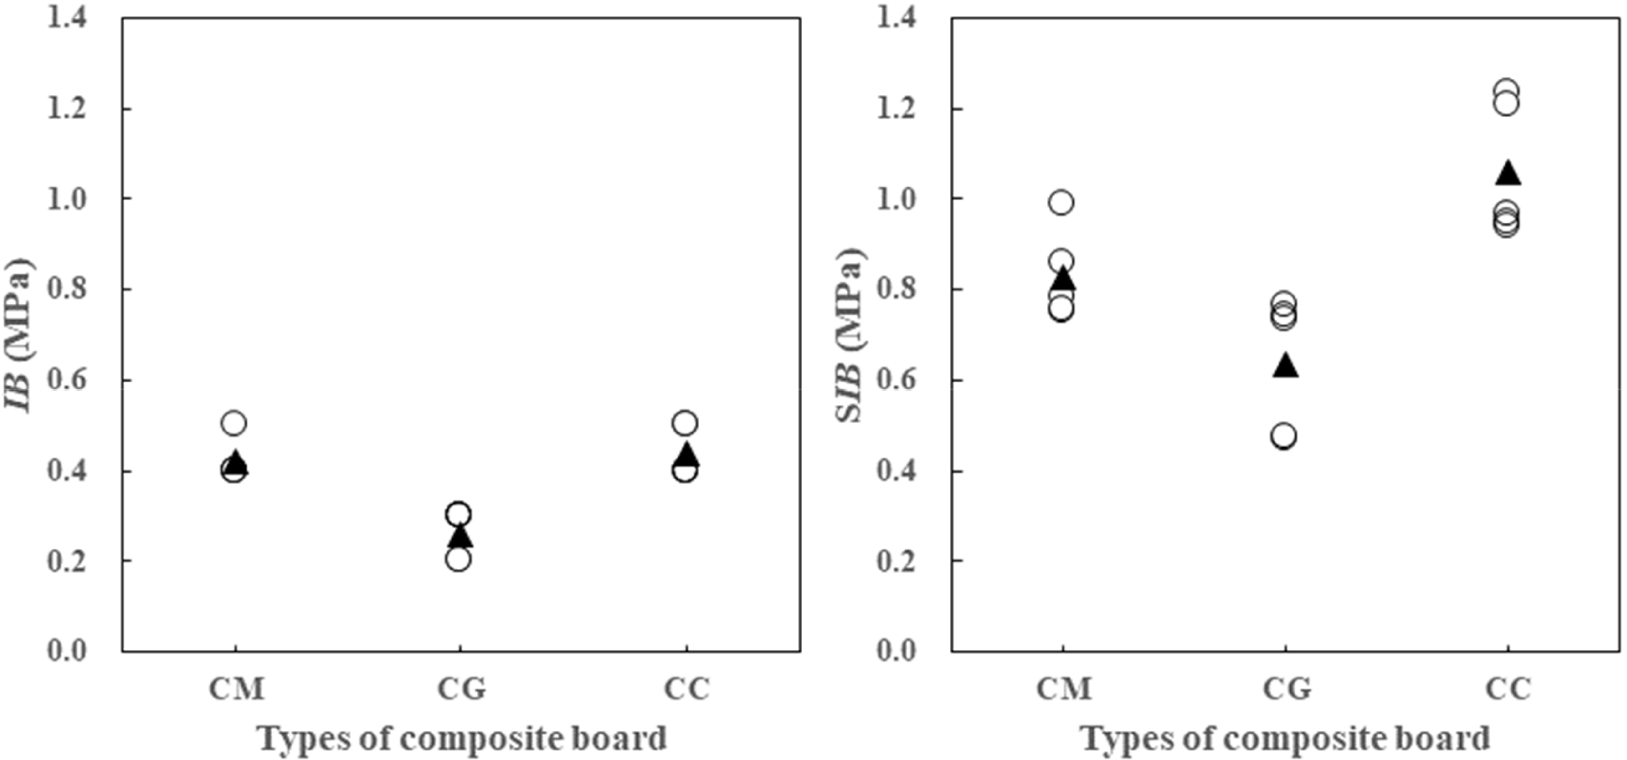
The results of the tensile peel test of the IBs of the three cork composite board types are listed in Table 2, and the effects of the reinforcing materials on the IBs of the cork composite boards are shown in Fig. 4.

The IB value was the highest (at 0.44 MPa) for the CC, followed by 0.42 MPa for the CM, while the CG exhibited the lowest value (at 0.26 MPa). The CM:CG:CC ratios were 1.00:0.62:1.05. These values were 13%–23% of that for OSB (Seo et al., 2018), 42%–72% of that for MDF (Park et al., 2013), and 52%–88% of that for PB (Seo et al., 2018). However, these values were similar to the value of 0.49 MPa, for boards manufactured using sawdust, rice husk, and charcoal, at 700 kg/m3, as previously reported (Hwang and Oh, 2020a).
As shown in Fig. 4, specific IB value (ratio of the IB to the specific gravity) of the cork composite boards was the highest for the CC (at 1.06 MPa), while the CG exhibited the lowest value (at 0.64 MPa). The CM:CG:CC ratio was 1.00:0.77:1.28. The specific IB values were higher for lower composite-board densities. Compared with the peel strength results, the obtained values were 98% higher for the CM, 146% higher for the CG, and 141% higher for the CC.
4. CONCLUSIONS
-
1) The static bending MOE values of the studied cork composite boards were in the 32.7–35.9 MPa range, and in the order CM > CC > CG, higher by 29%–41% compared with the value for non-reinforced cork boards.
-
2) The bending strengths of the cork composite boards were in the 1.62–1.73 MPa range, and in the order CM > CC > CG, higher by 35%–45% compared with the value for non-reinforced cork boards.
-
3) The specific bending MOE and specific bending strengths of the cork composite boards were in the 70.4–75.8 MPa and 3.41–3.71 MPa ranges, respectively, higher by 97%–123% than static bending MOE and strength values. The CC exhibited the highest values.
-
4) The IB values of the cork composite boards were in the 0.26–0.44 MPa range, and in the CC > CM > CG. The values were somewhat lower than those of general wood-based boards, such as MDF.


