1. INTRODUCTION
Carbon materials are attractive electrode materials because of their relatively low cost, high surface area, and availability (Tiwari et al., 2021). Since the discovery of activated carbon (AC), there has been great interest in its synthesis because of its remarkable adsorptive, environmental, thermal, electrical, and mechanical characteristics. Carbon can be obtained from various sources and may have varied surface areas, porosities, and other properties. Therefore, the incorporation of carbon-based materials as particulate fillers in composites should be further researched and developed.
Agricultural-based biomass is an appropriate and inexpensive precursor to produce AC. AC is a predominantly amorphous solid with a large internal surface area and pore volume. Numerous attempts have been made to produce AC (with well-developed pore structures and high internal surface area) from various types of agricultural waste, such as wood, sawdust, bagasse, coconut shells (CSs), rice husks, oil palm shells, oil palm fronds, bamboo, and coir pith (Hwang and Choi, 2018; Maulina et al., 2020; Naihi et al., 2021; Park et al., 2018; Rahmawati et al., 2021; Ramirez et al., 2017; Saputro et al., 2020). Researchers have reported the production of AC from agricultural wastes, such as pistachio shells using KOH potassium hydroxide agent (Lee et al., 2021; Nazem et al., 2020), coconut husk using KOH treatment, and coffee endocarp using KOH (Yuliusman et al., 2019). AC has also been produced from corn stover through thermogravimetric analysis (Thithai and Choi, 2020); sengon wood wastes, corn hulls, and corn stover through carbonization (Gale et al., 2021; Hendrawan et al., 2019; Ko et al., 2018); and sunflower shells, pinecones, rapeseed, cotton, and olive residues through pyrolysis (Dorado et al., 2020). Hesas et al. (2013) used apple waste to produce AC through microwave-assisted phosphoric acid (H3PO4) activation.
These criteria helps produce AC with very different properties (Bergna et al., 2018). AC has been used since the prehistoric age and plays an important role in various fields. Recent developments in modern technologies have resulted in various novel applications for AC; however, simultaneously, the requirements with regard to AC have become rigorous, requiring a large surface area and a narrow pore size distribution of appropriate sizes. To meet these requirements while considering energy usage and the environment, various precursors and their activation processes have been proposed. The activation process using KOH resulted in a surface area as large as 3,554 m2/g at 800°C and an impregnation ratio of 1:4 (Dwiyaniti et al., 2020). Various processes without any activation procedure have also been proposed, such as template methods to obtain microporous or mesoporous carbons (Ediati et al., 2020) and the defluorination of polytetrafluoroethylene (Rahman et al., 2021) to obtain mesoporous carbons.
Recently, a great deal of waste has been produced owing to increased activity in the modern agricultural sector, including shells of coconut dry fruits. Annually, approximately 33 billion coconuts are harvested worldwide, with only 15% utilized for fibers and chips (Faridul Hasan et al., 2021). CS is an abundant agricultural solid waste in several countries, including Indonesia, Malaysia, and Thailand. This bio-agricultural waste shell, which is a source of siliceous material, is produced after the extraction of coconut oil in a coconut oil mill. CS is a lignocellulosic material and has potential applications in various composites (BaniHani et al., 2021). However, the intensive but below-optimal use of CS results in low economic value, whereas CS can play an important supplementary role, especially in the form of particles.
Recent developments in modern technologies have resulted in various novel applications of AC, including polymer composite materials. Interfacial interactions and interphases play a key role in the characterization of particulate-filled polymers, polymer blend fiber-reinforced advanced composites, and biomimetic materials, and help in the development of principles and techniques for various applications of these materials (Maghami et al., 2020).
The use of composite materials has been increasing because of their adaptability to different situations and ease of combination. Recently, different biocomposites have been fabricated using natural fiber biomass as a filler in a polymer matrix such as epoxy, polyester, and polypropylene, and which indicated that these materials have the potential to replace traditional wood and non-wood products (Abdul Khalil et al., 2010; Jawaid and Abdul Khalil, 2011). Composites are used in diverse fields such as heavy transport vehicles, structural applications, and electrical, electronic, and industrial applications. The potential applications of composites in electrical and electronic devices include switch gear frames, power pole cross-arms, power line insulators, and lightening poles.
The filler particle-filled resin matrix of the composite exhibited enhanced aesthetic, optical, and mechanical properties such as tensile strength and resistance to fracture, as well as reduced polymerization shrinkage (Kundie et al., 2018). Moreover, particles enhance the wear resistance and gloss retention and improve the fatigue properties of composites (Tsujimoto et al., 2018). However, composite properties are significantly affected by various factors, including the degree of conversion of the polymer matrix and the interphase, which require a high level of salinization because of the high surface area of the particles (Qi et al., 2019; Shalygina et al., 2021). However, the effects of the particle/matrix interface adhesion and particle loading on the mechanical properties of polymer composites are not discussed here. Fracture toughness strongly depends on toughening mechanisms, such as crack deflection, crack pinning, matrix-filler interactions, and crack bridging, which increase crack propagation resistance.
Particle size is an important parameter that can be measured using various methods. The properties of a composite can be significantly affected by its particle size (Kwon et al., 2008). Another study (Nezbedova et al., 2016) suggested that particle size plays a significant role in the development of composite properties. The distribution of fine minerals or powders is mostly in terms of the equivalent spherical diameter based on cumulative sediment data (Nosonovsky and Bhushan, 2009).
Fillers with smaller particle sizes can improve the flexural strength because of the increased particle surface area, which results in high surface energy at the filler matrix interface. Hardness is readily improved by adding either micro-or nanoparticles because rigid inorganic particles generally have considerably higher stiffness than polymer matrices. Thus, this study reports warious AC obtained at different scales of CS particles ground into 80, 100, and 200 mesh AC particles. The ground CSs were characterized using various particle scales. The resulting scale-particle material can be further studied and used as reinforcement in the fabrication of biocomposites.
2. MATERIALS and METHODS
CSs were collected in the form of chips from a coconut oil processing mill in Ciamis, Indonesia. The biomass was dried, cut into small pieces, crushed, and sieved to a particle size of 250–500 μm. H3PO4 (approximately 85% acidimetric) was purchased from the Bratachem Company, Indonesia. All the chemicals used in this investigation were of analytical grade.
The CSs were washed several times with hot distilled water to remove impurities. All samples were dried at 105°C for 24 h in an oven to remove excess water. Subsequently, the raw materials were crushed and sieved to particle sizes of 250–500 μm. Dried samples (200 g) of 250–500 μm was impregnated with 85% H3PO4 at a ratio of 1:4 to the desired raw material (Abdul Khalil et al., 2010; Firoozian et al., 2011). The mixture was then impregnated at 85°C for 24 h in a water bath. Thereafter, the samples were rinsed several times with distilled water (i.e., pH 7) to remove any residual acid. The product was subsequently oven-dried at 110°C, cooled, and weighed until a consistent weight was obtained. The temperature was raised to 350°C from the ambient temperature within 60 min. Thereafter, the temperature was raised to 700°C over 70 min and maintained 180 min upon completion. Then, the temperature was slowly decreased to room temperature. The produced activated carbon (CS-AC) was cooled to room temperature and washed three times with distilled water to remove ash. The CS-AC was dried in an oven at 105°C for 4 h, cooled in a desiccator, and weighed until a consistent weight was obtained.
CS-AC was ground in a Wiley mill (RETSCH, Haan, Germany) to obtain granular particles, followed by sieving through an 80-mesh sieve to separate the sands, stones, and other impurities. The sieved CS-AC was then dried at 110°C for 24 h to reduce its moisture content. The dried CS-AC was then crushed and sieved using a sieve size of 100 mesh to obtain powdered samples. The CS-AC powder sample was ground again using a grinder/refiner (Bacco Industry Group, Hongkong), followed by a 200-mesh sieve. All CS-AC samples on various scales were dried at 105°C in a drying oven for 24 h to prevent agglomeration and kept in a dry place to avoid contact with moisture.
The particle size distribution of the CS-AC particles was measured using a MALVERN Zetasizer Ver. 6.11 (MAL 1029406, Malvern Panalytical, Malvern, UK) with dynamic light scattering measurements with a 532 nm laser. The average particle size measurement was automatically repeated thrice based on the internal setting of the equipment.
The morphology of CS-AC was investigated using a scanning electron microscope (SEM; Leo Supra, 50 VP, Carl Zeiss, SMT, Jena, Germany). Each CS-AC sample was mounted onto an SEM holder using double-sided electrically conducting carbon adhesive tape to prevent surface charge on the specimens when exposed to the electron beam. The surface microstructured CS-AC was sputtered with a 20 nm thick layer of gold using a Polaron Equipment (Hertfordshire, UK) model E500 set at a voltage of 1.2 kV (10 mA), and a vacuum of 20 Pa for 10 min prior to their morphological observation. SEM micrographs were captured under conventional secondary electron imaging conditions, with an acceleration voltage of 5 kV. SEM micrograph and energy dispersion of the X-ray (EDX) analyses were performed using a Leica Cambridge S-360 SEM (Leica Cambridge Instrument, Cambridge, UK).
The X-ray diffraction patterns of the CS-AC were obtained using a Philips PW1050 X-pert diffractometer (Westhorst, Germany) with Cu-Ka1 radiation and operating at 40 kV, 25 Ma, and λ = 1.54 Å. The diffractograms were scanned from 2.5° to 90° (2θ) in steps of 0.02° at a scanning rate of 0.5°C/min. The average crystallite size was determined from the broadening of the peak using the Debye-Scherrer formula:
where k is a constant taken as unity, λ wavelength of the radiation is the full width at half maximum (FWHM) in radiance of the XRD peak obtained at 2θ, and D is the crystallite size in nm.
Furthermore, the crystallinity index (CI) was determined as the ratio of the area of all crystalline peaks (Acr) to the total area (Atotal) (Park et al., 2010), as follows:
Fourier-transform infrared spectroscopy was performed using a Nicolet Avatar 360 spectrometer (Woodland, CA, USA). The nanostructured carbon black was pounded in a mortar cooled with liquid nitrogen, and 1–2 mg of the obtained powder was dispersed in 100 mg of potassium bromide (KBr). The samples with KBr were carefully dried before disk preparation and immediately subjected to FT-IR analysis.
The specific surface area, pore volume, and pore size distribution of the AC were determined from the adsorption isotherms using the Brunauer–Emmett–Teller (BET) equation and a Quantachrome Nova Win2 1994–2002 instrument (Quantachrome Instruments, Boynton Beach, FL, USA). The cross-sectional area of the nitrogen molecules was assumed to be 0.162 nm2. The Dubinin-Radushkevich (DR) equation was used to calculate the micropore volume. The total pore volume was estimated as the liquid volume of the adsorbate (N2) at a relative pressure of 0.985. The pore size distribution was determined using the Barrett–Joyner–Halenda (BJH) model. The average pore diameter was calculated as four times the total pore volume over the BET surface area.
3. RESULTS and DISCUSSION
The results of the CS-AC particle analyzer on various scales are shown in Fig. 1. The three particle size distributions after being ground in the Wiley mill to become granular particles, followed by sieving with 80, 100 and 200 meshes, are also shown in Fig. 1. Fig. 1(a) shows the particle size distribution of 80 mesh particles by frequency, which covers a wide range of particles with symmetric behavior of the curve. The diameter of the major portion of the particle ranged between 218.6–3,205.35 nm. Meanwhile, the small range or narrow particle size distribution compared with 80 mesh, 92% of particles at 100 mesh, is shown in Fig. 1(b). Most of the particles (56.45%) have diameters ranging from 218.6–315.27 nm, while the rest (43.55%) have diameters of 3,205.35–5,222.96 nm, with an average diameter of 1,020.3 nm [Fig. 1(b)]. Fig. 1(c) shows the particle size distribution of 200 mesh particles by frequency which covers a wide range of particles with symmetric behavior of the curve. The diameter of the major portion of the particles ranged between 218.6–4,622.81 nm. Table 1 presents the particle size distributions obtained from particle analyzer analysis.
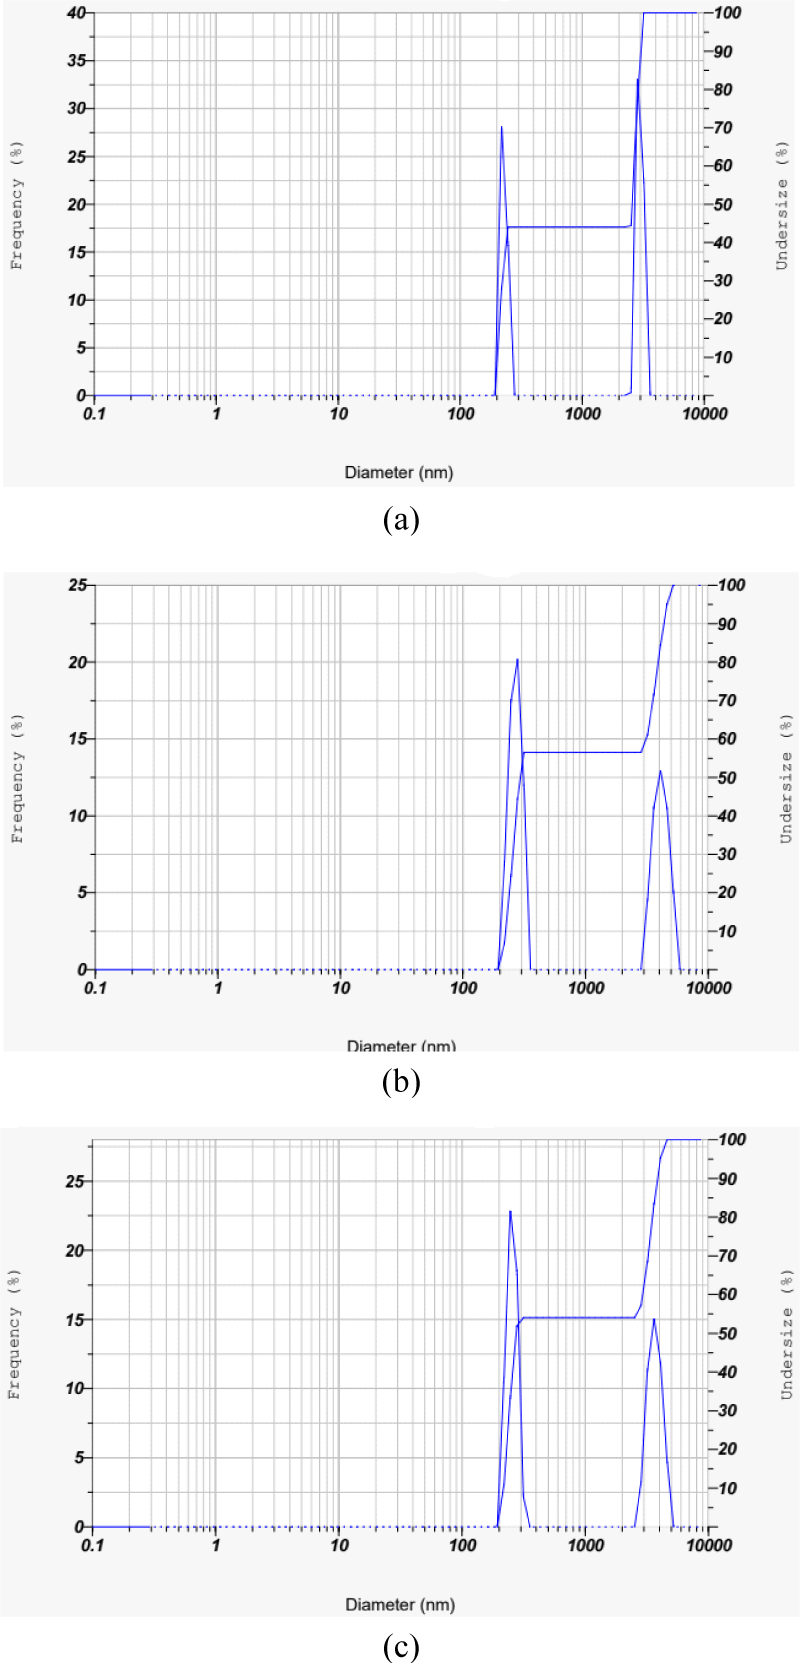
Generally, CS-AC with a smaller particle size and a uniform distribution of particle-size filler is observed. Smaller or finer particles may have a greater impact on the matrix and can result in uniform filler dispersion in composites (Prachayawarakorn et al., 2008). Abdul Khalil et al. (2013) mentioned that the incorporation of H3PO4 reactive agent-based AC in epoxy resin substantially lowered the viscoelastic damping factor because the fillers carried stress to a greater extent. The improvement in the mechanical performance of the epoxy composites was mainly due to the particle size dimensions of the fillers (Ahmed, 2018).
The SEM images of the three-CS-AC scales showed that the external surface was full of cavities and quite irregular because of the milling treatment. The CS-AC was subjected to ball milling, and the particles became irregular and crushed. As shown in Fig. 2(a), the rough surface of the CS-AC-80 mesh is due to process impurities, as mentioned by Liu et al. (2021). The surface textures of the CS-AC-100 and CS-AC-200 meshes were smooth, uneven, and undulating. The vesicles and spaces within these micrographs showed no pores demonstrating (Müller, 2010). The microstructures of the CS-AC-80, CS-AC-100, and CS-AC-200 meshes prepared at 700°C are shown in Fig. 2. CS-AC shows the development of a clear pore structure. There are many thin layers within the structure, between which are rudimentary pores owing to the release of volatiles. A system of advanced pore network was formed in the case of the CS-AC-200 mesh as compared to the CS-AC-80 and CS-AC-100 mesh fibers, as there were no more lignocellulosic structures on the surface of the CS-AC-80 mesh, but many small cavities across the surface. Because of these well-developed pores, the AC possesses a high surface area.
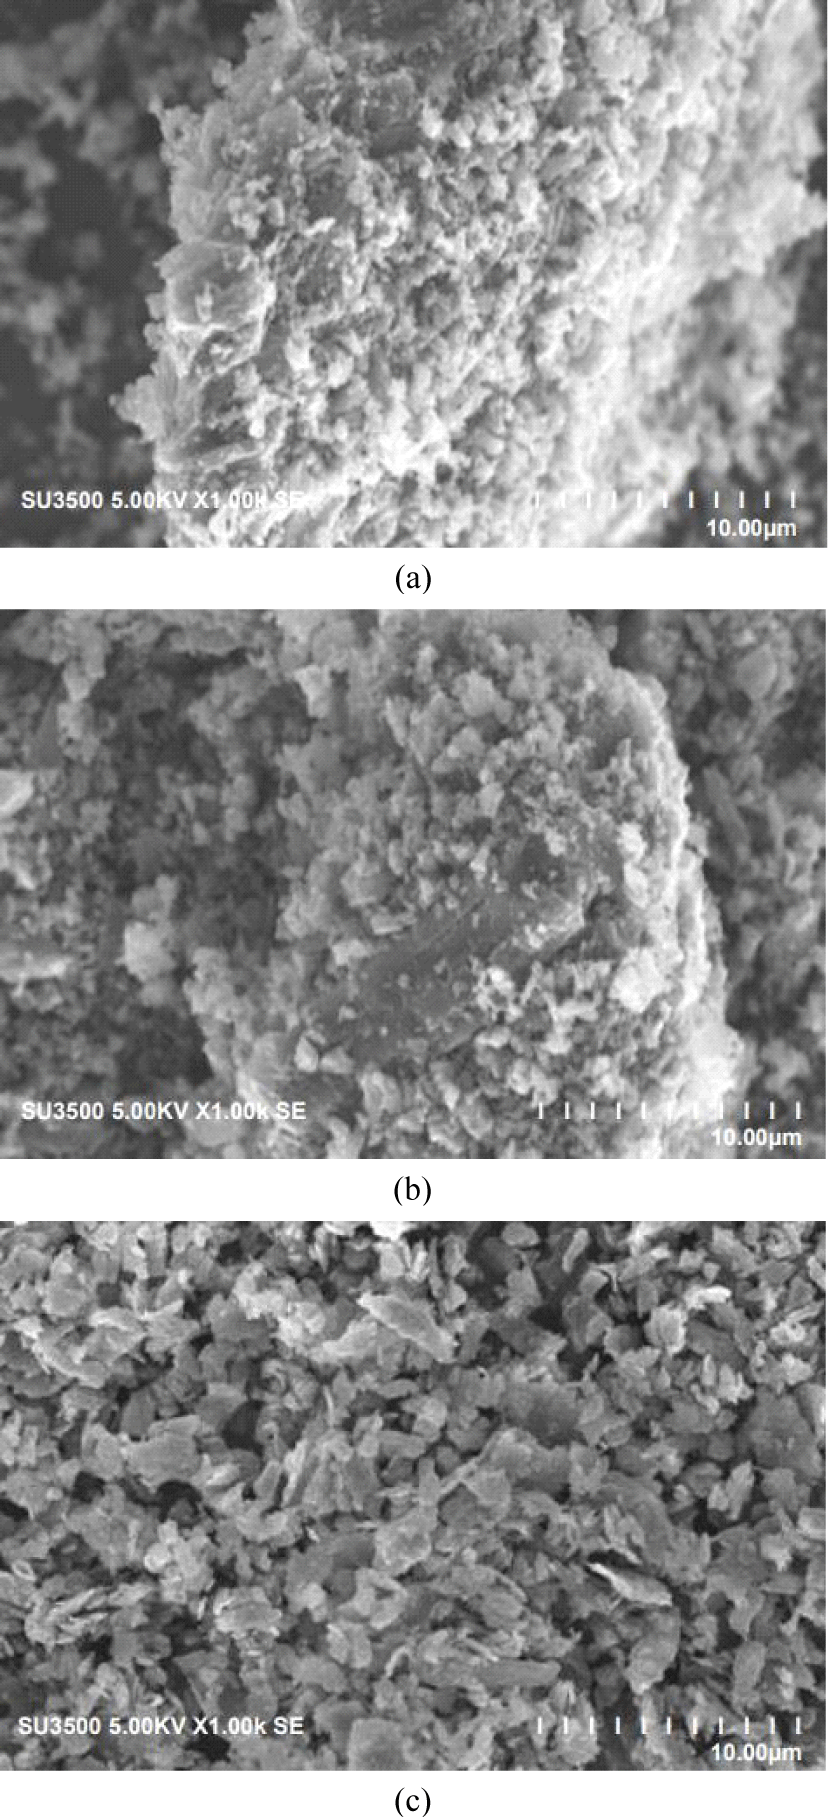
The result of the SEM in Fig. 2 shows that there are a few particles larger than 1 mm. This was especially surprising, given the results from a range of milled materials, indicating enhanced reactivity after extended milling (Welham et al., 2002). The external surface area seems to have slightly improved after ball milling; although the particle size decreased, it changed the ratio of physiosorbed gas to chemisorbed gas, which is in agreement with a study by Ruiz et al. (2007). The longest milling time led to the agglomeration of smaller particles into larger particles. The SEM image in Fig. 2 shows that it consists of smaller and substantially more rounded particles. Evidently, the formation of the smallest particles (200 mesh) was greatly enhanced during this period of grinding in the Wiley mill. Ruiz et al. (2007) mentioned that grinding in a Wiley mill causes a decrease in the size of the carbon particles, which, in turn, increases the electrode resistance. A few researchers have reported that nanocomposites can be produced using Wiley mill grinding (Alamolhoda et al., 2009; Sherif El-Eskandarany et al., 2021).
The pore size distributions of different CS-AC samples are shown in the micrographs in Fig. 3. This indicates a pore diameter greater than 2 μm, which indicates that mesopores were developed in all three scales of AC. However, this does not prove that all the pores developed in these AC were mesopores because the image also showed the presence of micropores, thereby showing a mixed porous morphology. Small, transitional, and large pores with different shapes can be clearly identified from these micrographs. These pores result from the evaporation of the chemical reagent (H3PO4) during carbonization, leaving the space previously occupied by the reagent (Anisuzzaman et al., 2015).
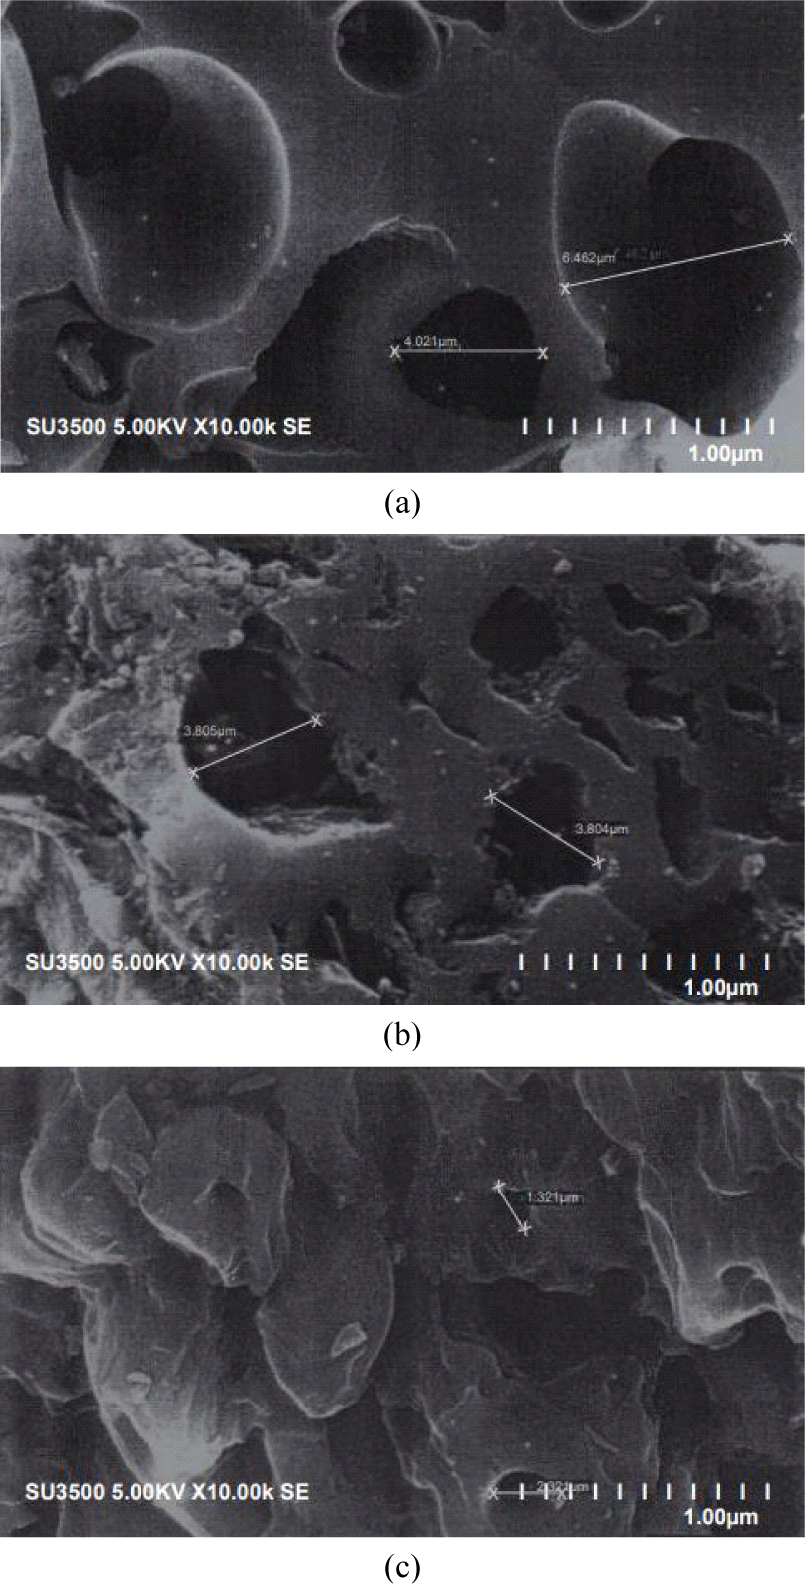
Voids of several microns, which may have formed in the original boundaries of the mesopore pitch grains with H3PO4 particles, can be clearly observed. Thus, the sample showed extensive microporosity, with high accessibility due to interparticle voids (Ruiz et al., 2009).
In the EDX analysis, the spots from the structure of the CS-AC-80, CS-AC-100, and CS-AC-200 mesh samples were highlighted, as shown in Fig. 4(a–c). These results show that all AC contained a relatively high percentage of carbon. The percentage of carbon in the AC samples can be described as follows: CS-AC-80 mesh > CS-AC-100 mesh > CS-AC-200 mesh. The elemental percentages determined by EDX are shown in Table 1. The carbon content of the CS-AC-80 mesh showed the carbon content was higher. These results are comparable to those of Wang et al. (2019) for commercial AC from CSs, wherein a similar carbon content higher than 79% was reported after several modifications. CS-AC contained a comparatively small amount of oxygen after pyrolysis. The CS-AC also showed the presence of phosphorus, as shown in Table 2. The presence of phosphorus may be the residual of phosporic acid during impregnation of the AC.
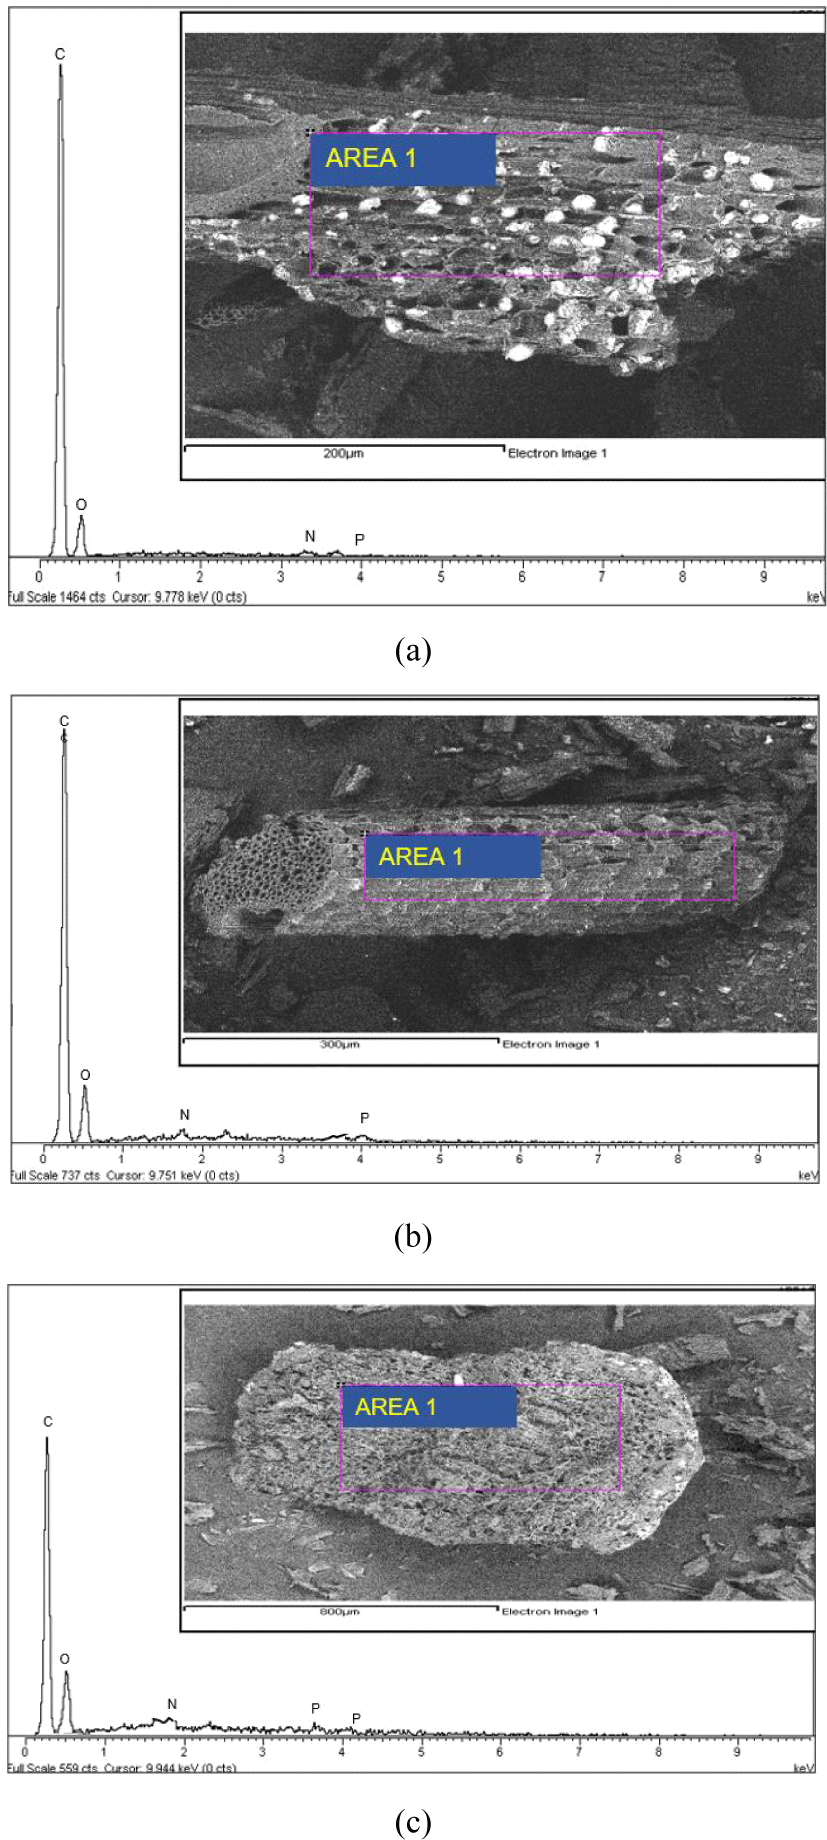
The SEM images of the CS-AC-80, CS-AC-100, and CS-AC-200 meshes showed that the external surfaces of these carbons were full of cavities and irregular because of activation. Numerous cracks and small pits were distributed over the surface, indicating the strong interaction of the H3PO4 with CS during carbonization (El-Hendawy et al., 2008). The presence of micropores and mesopores in the CS-AC-80, CS-AC-100, and CS-AC-200 meshes illustrates the difference between AC originating from the particle scale. The AC obtained using H3PO4 showed fewer mesopores.
Fig. 5 shows that the functional groups of CS-AC from three different particle scales. A broad band centered at 3,431 cm–1, 3,740 cm–1, and 3,735 cm–1 were assigned to the v(OH) stretching vibrations of hydroxyl groups, including hydrogen bonding in CS-AC obtained from 80, 100, and 200 meshes, respectively. The location of the hydrogen-bonded OH groups is usually in the range of 3,200–3,650 cm–1 for alcohols and phenols (Lua and Yang, 2005). The bands observed at 3,700–3,584 cm–1 were attributed to O-H stretching vibrations. The bands at 1,634–1,635 cm–1 indicated C=O stretching of carboxyl or carbonyl groups. The band around 1,590–1,500 cm–1 was assigned to ring vibration in a large aromatic skeleton generally found in carbonaceous material, such as AC.
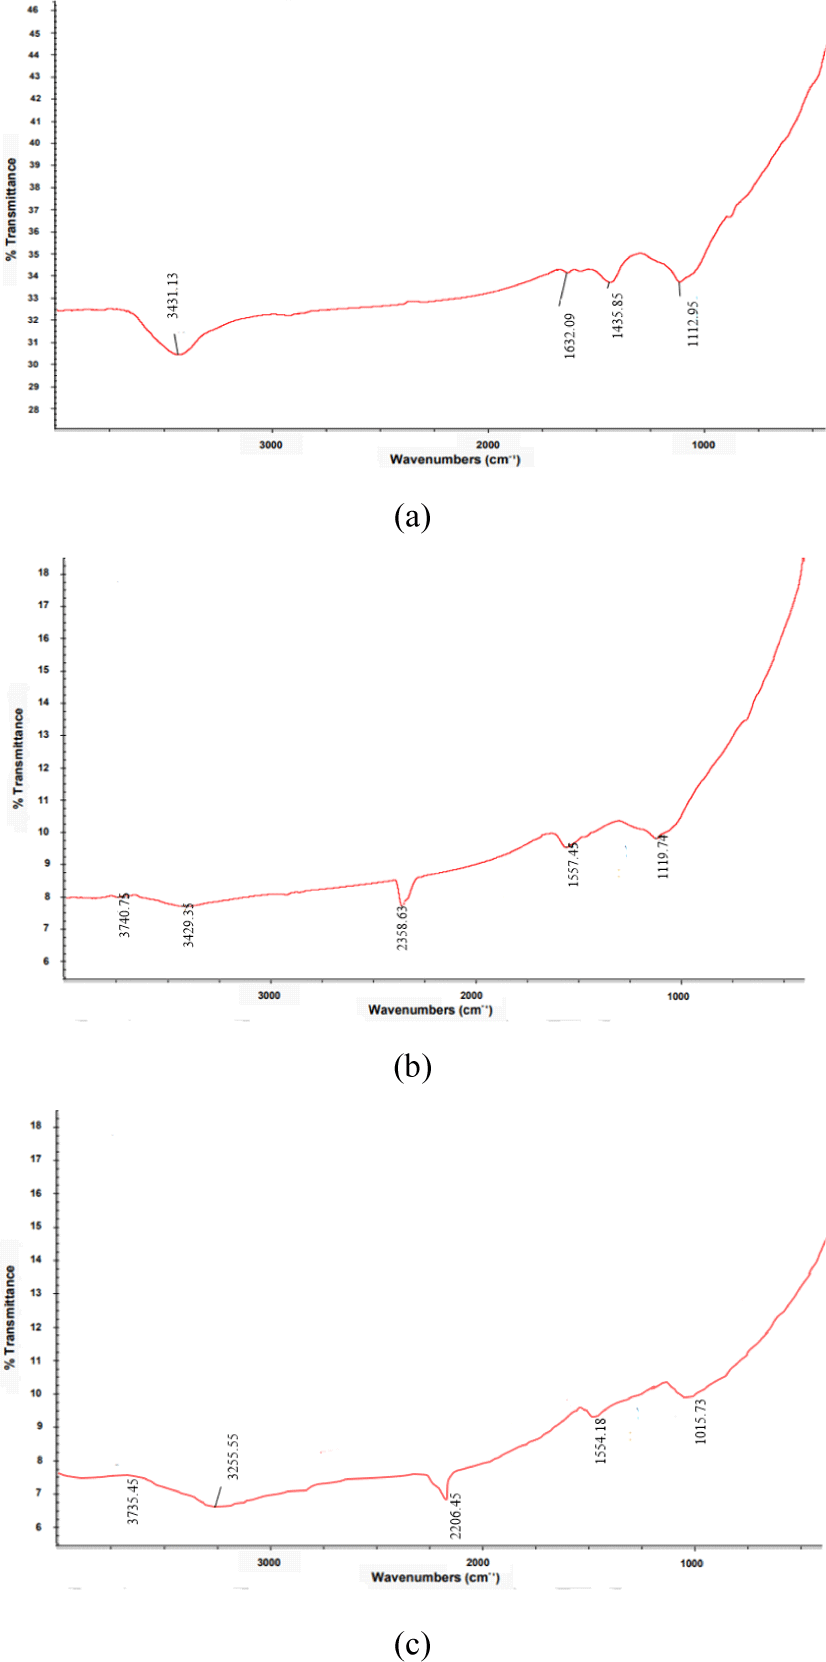
O-H stretching functional groups have been detected in most AC, including commercial-grade AC (Budinova et al., 2006; Jung et al., 2001; Lua and Yang, 2005). C-H out-of-plane bending in benzene derivatives is commonly found on the surfaces of various AC (Hameed et al., 2009). There is a broad band shown in the region of 1,350–1,670 cm–1, which has been observed in AC by many researchers, but has not been interpreted accordingly (Hamamoto et al., 2006). In this study, the frequencies in the range of 1,107–1,164 cm–1 were attributed to the C-H bending vibrations of the benzene derivatives. This band indicates the presence of phosphorus and oxygen compounds in the samples. Adsorption in this region is typically observed in carbon activated with H3PO4 (Budinova et al., 2006).
Table 3 shows that the surface area of the CS-AC-200 mesh was larger than those of the CS-AC-100 and CS-AC-80 meshes. The CS-AC produced with the 200 mesh had a higher specific surface area and microporosity percentage than the 80 and 100 meshes. This may be because of the smaller particle size of CS-AC, which influences the specific area and porosity owing to the differences in particle size (80, 100, and 200 meshes). The pore size distribution Table 2 was calculated based on the value of the (SLANG) surface area. In this study, using H3PO4, the SBET surface area of CS-AC with the 200 mesh was 350 m2/g, whereas the SLANG surface area was 534 m2/g with a mass recovery yield of 23.28%. The smallest SBET surface area was in the CS-AC-80 mesh (approximately 130 m2/g, and the SLANG surface area was 242 m2/g). Lutfi et al. (2021) also reported using H3PO4 as an activator on carbon from CSs, where the presence of an H3PO4 activator reduced the pore diameter and expanded the pore volume and surface area. Furthermore, the SBET surface area is also affected by milling time (Baheti et al., 2015).
| SBET (m2/g) | SLANG (m2/g) | Yield (%) | |
|---|---|---|---|
| AC-80 mesh | 130 | 242 | 19.3 |
| AC-100 mesh | 240 | 394 | 20.6 |
| AC-200 mesh | 350 | 534 | 23.3 |
The values of SBET surface area are in agreement with the findings of other research studies, which found an SBET surface area higher than 350 m2/g after carbonization of lignin even above 700°C (Baklanova et al., 2003). This phenomenon has been reported in several publications and may be explained by the fact that activation not only forms pores but also widens the size of the existing pores (Olivares-Marín et al., 2007). A comparison of the apparent specific surface areas of AC-80, AC-100, and AC-200 meshes showed that in the AC-80 mesh, chemical activation seems to improve the development of porosity (Ismail et al., 2010).
During chemical activation by H3PO4, a chemical agent is introduced into the raw material, where it undergoes physical and chemical changes that modify the thermal degradation process. The agent functions through two metchanisms: First, as an acidic catalyst in promoting bond cleavage reactions and the formation of crosslinks; and second, by combining with organic-specific species to form phosphate linkages, such as phosphate and polyphosphate esters, which can connect and crosslink biopolymer fragments (Jagtoyen and Derbyshire, 1998). These different mechanisms indicate that chemical activation results in a larger yield of AC with microporosity, a larger mesopore volume, and a lower macropore volume in a single step (Molina-Sabio and Rodríguez-Reinoso, 2004). AC produced from 200-mesh particles have a higher specific surface area and microporosity percentage (and a lower macropore concentration) than those produced from the 80 and 100 meshes. This may be because the lignocellulosic composites of the raw materials influence the char yield and porosity owing to the differences in the thermal stability of the major components (lignin, cellulose, and hemicellulose) after being ground in a Wiley mill several times (Cagnon et al., 2009).
The CI of the CS-AC-80 mesh is 54.34% [Fig. 6(a)]. The CS-AC-80 mesh exhibited the lowest degree of crystallinity, as indicated by the number of crystalline peaks in the diffractogram. The peaks at 26.5°, 43.1°, and 44.1° were significant and indicated a crystalline form. The CI of the CS-AC-100 mesh was 58.25% [Fig. 6(b)]. CS-AC-100 exhibited a slightly higher degree of crystallinity than the CS-AC-80 mesh. The crystalline peaks in the diffractogram at 26.4°, 43.6°, and 45.1° were significant and indicated a crystalline form. Peaks of the amorphous hump were observed between 60°–70°.
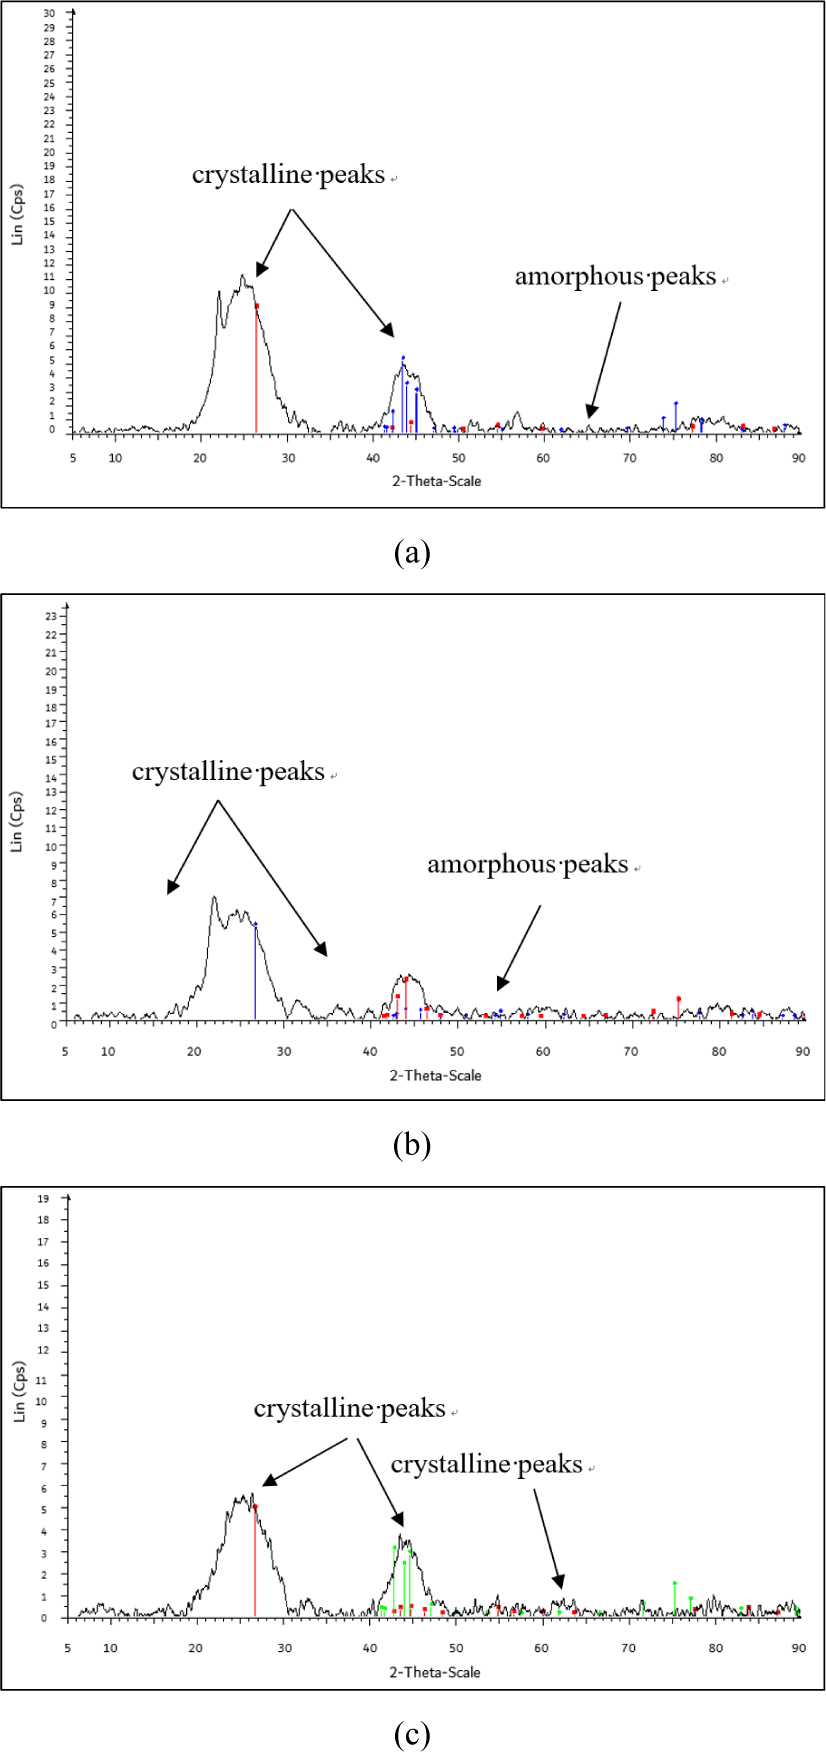
Fig. 6(c) shows that the CI of the CS-AC-200 mesh in the diffractogram at peaks 26.7°, 42.9°, and 44.9° were significant and showed crystalline form which was found to be 69.65%. Peaks of the amorphous hump were observed between 49°–80°. The process of grinding in a Wiley mill decreases the crystallinity of the AC, thus increasing its amorphous domains in it (Lee et al., 2019). This change is beneficial for applications, such as particulate nanofillers in polymer matrices. The enhanced amorphous content is encouraging, as it may lead to better compatibility with various polymer matrices.
4. CONCLUSIONS
The particle size diameter average of CS-AC obtained from particle analyzer analysis was found to be 1,064.4 nm for the 80 mesh, 1,020.3 nm for the 100 mesh, and 965.8 nm for the 200 mesh. The percentage carbon content of the AC is described as follows: CS-AC-80 mesh > CS-AC-100 mesh > CS-AC-200 mesh, using EDX analysis. The SEM micrograph of CS-AC showed clear fine pores within the microstructure of 200 mesh scales. The morphological images of CS-AC on various scales showed that the external surfaces of these carbons were full of cavities and irregular because of activation. CS-AC exhibited fewer mesopores and higher micropore structures.


