
1. INTRODUCTION
These days, “Carbon neutral” is became one of the hottest key words in the world. With carbon sequestration, the role of the forests is becoming more important. Carbon can be captured by tree, and the captured carbon can be stored for long periods by utilizing the wood resources. By this social need, many wood products have been developed for tall timber buildings, furniture and so on (Jang and Lee, 2019; Hendrik et al., 2019; Lee et al., 2019; Park et al., 2020; Kang et al., 2019a, 2019b, 2019c; Song and Kim, 2020). Also, many studies are being conducted to improve its properties and manufacturing efficiency (Park et al., 2020; Kim and Kim, 2020; Ahn et al., 2020; Kang et al., 2019a, 2019b, 2019c; Chang et al., 2019; Park et al., 2020; Yunianti et al., 2019; Lee et al., 2020). For harvesting the raw material of these products, wood, an effective forest infrastructure is required.
The urgent need for the forestry industry in the many-forested regions of Russia and a number of other countries is the need to create an effective forest infrastructure.
Turning to theoretical research in this area, it should be noted that many Russian and foreign scientists have been engaged in various aspects of forest infrastructure design. Thus, the work (Chernykh, 2018) is devoted to the development of alternative options for the forest road network, taking into account the economic availability of resources, which depends largely on the level of development of transport infrastructure.
According to the author's opinion, the key problem that was not solved in the methodology proposed in this study is the lack of accounting for the dynamics of the forest fund. This does not allow to properly planning further infrastructure development in more and more distant territories from already developed forest areas. Scientific researches by Tretyakov (2015a, 2015b) are aimed at studying the issue of transport accessibility of forest resources. Also, this issue is raised by other authors. For example, Efremov (Karakchieva and Chumachenko, 2016) studies the methodology for assessing the economic profitability of forest wood resources. Sokolov et al. (2015; 2016) highlight the ecological availability of wood resources as a paramount factor of forest infrastructure.
Considering these and other works, the authors' team comes to the conclusion that in modern conditions the problematic of designing forest infrastructure in the scientific literature is revealed in fragments; there is no complexity and consistency in research; many provisions of developments require due justification, especially for establishing links and dependencies between various factors and aspects of forest infrastructure development.
The creation of a mathematically justified effective forest infrastructure will allow dispersing logging across the territories that are somewhat remote from the forest industry centres, thereby creating prerequisites for organizing effective continuous and sustainable use of the forest.
Among the Russian researchers who have devoted their works to the mathematical solution of this problem we should single out Shegel'man et al. (2005; 2010) A number of his works, which represent the results of research by a large scientific group, present mathematical models of the processes of harvesting, transportation, and processing of wood that are recognized in the scientific community.
Another area of research should be highlighted - the use of graphic-analytical modeling. Based on its results, it is possible to build an optimal and logically justified chain of all logging operations (Sushkov et al., 2015). Despite the relevance and importance of these studies, an obvious drawback should be noted - their use is limited by the static environment (Ra, 2017; 2018). At the same time, the forest area is a dynamically changing environment. The constantly changing environmental conditions also influence the efficiency of the logging process (Kim and Ra, 2014; Ra, 2017; 2018). Thus, there is a need to develop theoretical research precisely taking into account the dynamics of environmental change.
Actual researches in the field of methods for finding shortest paths in a graph are described in Moore’s (Moore, 1969), Floyd’s (Floyd, 1962), Dijkstra’s (1967), Bellman’s (Bellman, 1958), and other researches. They can be used to find rational flows in transport systems (Belyakov et al., 2014, Mokhirev et al., 2019). The research results of these authors can be used to represent the technological operations of the logging process in the form of a dynamic network. At the same time, the specifics of the solutions they proposed are such that the selected optimal solutions do not take into account the possibility of developing several cutting areas and transporting different flows of wood and other resources, which usually happens in practice. Thus, there is a significant dissonance between theoretical developments and logging practices, which is unacceptable. The need for simultaneous consideration of several cutting areas leads to the fact that the resources of machines and equipment involved in the performance of works on one of the logging sites will be reduced while performing the same operations on another site in the analysed time interval.
The noted researches allow us to analyse only the graphs with independent from each other throughput capacity of separate parallel arcs of analyzed time ranges. Thus, they can not always be used when finding the optimal technological chain of work at logging enterprises. The factors considered above determine the relevance of solving the problem of designing a logging infrastructure taking into account the dynamically changing environment using graphic-analytical modeling tools.
2. MATERIALS and METHODS
The research presented in this paper is based on the results previously obtained by the authors' team. In the paper by Mokhirev and Rukomojnikov (2019) the authors consider and propose graphical models of the sequence of logging process operations. The study details the complexity of logging processes using graph theory. The resulting graphs clearly demonstrate the variability in the implementation of activities in the forest area.
The development of these theories was carried out in the works of Rukomojnikov and Mokhiev (2019) and Rukomojnikov et al. (2021). For the proposed graphic-analytical model, a mathematical model and a methodological basis for solving the declared class of problems have been developed. The key goal of the results obtained is to determine the maximum flow of the minimum cost in the dynamic structure of the technological process of logging operations.
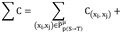
Each arc (process) in the graphic-analytical model is characterized by a set of technical and economic indicators calculated on the basis of the proposed mathematical tools. Determination of optimal supply chains (technological scheme of logging) is carried out by comparing all possible options for their implementation and identifying the most effective. The key criterion is to determine the economic effect. The purpose of this study is to develop an algorithm for finding an effective technological chain of logging operations in dynamic natural production conditions based on previously developed mathematical and graphic-analytical tools.
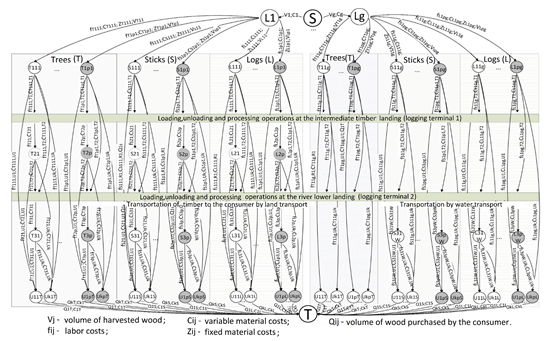
In Fig. 1 vertex S is a fictitious source, and vertex T is a fictitious drain. From the fictitious source, the arcs go to the LN vertices that denote the cutting areas. The arcs between the fictitious source and the cutting areas characterize the flow capacity and are determined by the volume of wood removal (VN) from the corresponding cutting area. The entire technological chain is represented on the graph by intermediate vertices located between the vertices denoting cutting areas LN and consumers U. From the vertices LN, the arcs go to the vertices MHθN. Here M is the name of the wood exported from the cutting area (trees (T), stick (S), logs (L)); H is the stage of transportation; θ is the number of the period; N is the number of the cutting area. So, for example, the vertices T111, ..., T1p1 characterize the tree transport operations performed at the first stage in each of the p periods for the first analyzed cutting area. At the subsequent stages of transportation, the number of the cutting area is not specified in the vertex designation, since it does not affect the operation characteristics. For example, the vertices T21, …, T2p characterize the operation of transportation of assortments at the second stage (after the intermediate warehouse) in each of the p periods. At the third stage, after the lower warehouse, the symbol W may appear in the vertex characteristic. This designation symbolizes the analysis of options for further transportation of timber by water or rail. Arcs are characterized by throughput in the form of labor costs f. Arcs are also characterized by variable C and constant Z costs. Fixed costs are taken into account when storing wood between periods. The vertices of the graphoanalytic model that characterize operations in different periods of the year are marked with different colors. The  indicator is present in the arcs included in the fictitious vertex T from the vertices characterizing the wood consumers. This indicator symbolizes the maximum volume of products M that can be purchased by consumer A. Also, this arc is characterized by the cost of products sold C.
3. RESULTS and DISCUSSION
As a result of the research, the claimed algorithm was developed. It consists of the following steps:
1) А part of the time-stretched graph  , related to a certain situation of the technological process of wood removal from logging sites, corresponding to the first period of the technological process θ=1, is considered.
2) Taking into account the values of the flow  and
and  moving along arcs of a graph
  , a residual network
  is constructed. At the same time, each arc of the new network connecting the «vertex-time» pair
  with the «vertex-time» pair
  , along which a flow is started up at the first stage of calculation, has an inverse arc connecting
  with
with  with the residual throughput
  and cost
  . If the value of the transported flow
  is equal to the throughput of the arc, so
  .
.
The movement of the reverse flow along any of the reverse arcs of the residual network leads to the possibility of increasing the throughput of any of the arcs characterizing the same operation of the technological process in the analyzed time interval by the value of:
The residual throughput of arcs connecting the «vertex-time» pair  with the «vertex-time» pair
  equals to

 –
– . Residual throughput of corresponding reverse arcs
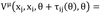
 , cost -
 .
.
The residual network initially coincides with the original graph.
The path  of the minimum cost in the constructed residual network is determined using the Ford-Bellman algorithm.
If there is no such path and the analysis of all analyzed p periods is performed, then it is possible to draw a conclusion about the correspondence of the previously found path variant to the optimal one and proceed to step 9.
If there is no such path only within the analyzed periods (at the time moment  ) and it is possible to make a transition to the next period
  , then add the vertices and arcs of this period to the graph.
Since the throughput capacities of the arcs of each of the periods, connecting the vertices of the graph with the dummy source and dummy effluent, depend on the flow started up along similar arcs of the previous periods, then carry out the calculation of the throughput capacities of arcs connecting a «vertex- time» pair  with the «vertex-time» pair
  , and «vertex-time» pair
  with the «vertex-time» pair
  , according to: If the path is found, then proceed to the next step.
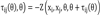
3) The maximum throughput of the identified path  is determined.

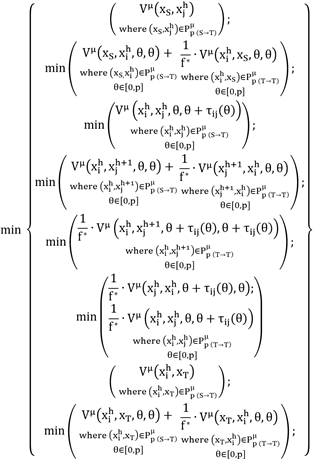
where  - labor costs characterizing the analyzed saturated arc of a narrow production site as part of the selected path, directed at a time point
  to a dummy effluent, machine-shifts;
 - labor costs characterizing the response to the analyzed saturated arc of a narrow production area, the reverse arc at the time point
  , machine-shifts.
4) The values of flows along the arcs of the graph  are updated:
a) for arcs, connecting the «vertex-time» pairs  with
with  in the graph
  with cost
  , the flow
  along similar arcs of the graph
  , directed from
  to
to  , is replaced by the value
  ;
;
b) for arcs connecting the «vertex-time» pairs  with
with  in the graph
  , with cost
  , the flow
  along similar arcs of the graph
  , directed from
  to
to  , is replaced by the value
  ; for arcs connecting the «vertex-time» pairs
  with
with  in the graph
  , with cost
 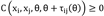 , the flow
  along similar arcs of the graph
  , directed from
  to
to  is replaced by the value
  ;
;
c) for arcs connecting the «vertex-time» pairs  with
with  in the graph
  , with cost
  , the flow
  along similar arcs of the graph
  , directed from
  to
to  is replaced by the value
  ;
;
d) the values of the flows are updated along the arcs connecting:
- «vertex-time» pair  with «vertex-time» pair
  by the value
  ;
;
- «vertex-time» pair  with «vertex-time» pair
  , by the value to
  .
.
5) The cost of the accepted path is determined:
where  - a section of a path consisting of straight arcs going in the direction from a dummy source to a dummy effluent;
 - a section of the path including forward and reverse arcs, directed from the dummy effluent and returning back, creating a cycle;
 - total variable costs on the section of the path from a dummy source to a dummy effluent along straight arcs, m.u.;
 - total variable costs on a cyclic section of the path along the reverse arcs, m.u.;
 - total variable costs on a cyclic section of the path along the straight arcs, m.u.
6) The time  remaining until the end of the period is calculated.
7)
a) the bandwidth and weight of the arcs connecting «vertex-time» pair  with «vertex-time» pair
  are replaced by the value
  ;
;
b) the bandwidth and weight of the arcs connecting «vertex-time» pair  with «vertex-time» pair
  are replaced by the value
  .
.
The weight characteristics of the reverse arcs obtained when the flow passes through the arcs of the graph are equal to  .
.
Replacement of capacities on the arcs corresponding to the same technological operations is carried out:
8) A residual network is constructed and the transition to stage 2 is performed.
9) The transition to the initial dynamic graph is performed by dropping the dummy vertices S and T.
To improve the understanding of the proposed method of solving the problem, we will give an example of choosing a work plan for a logging enterprise. This example demonstrates a variant of work in which logging is carried out on two forest sites, from the territory of which it is possible to transport wood both directly to the consumer, and to the onshore wood warehouse with subsequent transportation to the consumer (Fig. 2).
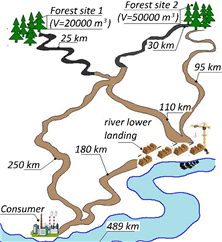
In two forest sites, wood can be harvested in the form of sticks or logs with a volume of up to 20 thousand cubic meters in the first forest sites and up to 50 thousand cubic meters in the second forest sites. It is possible to transport wood by rafting on the river, for this purpose, rafts can be formed on the river lower landing. The consumer is ready to accept wood in any period of the year in the amount of 70 thousand cubic meters. We analyze 2 periods of operation of the enterprise in a year. (Period 1 – winter period; Period 2- summer period).
It is necessary to determine the rational volumes of wood transportation directly to the consumer and to the river lower landing in each of the two periods of operation of the enterprise.
The initial graphical model built to solve the problem is shown in Fig. 3. The arcs of this graphical model indicate the initial data describing the volume of harvested wood, labor costs for performing all operations, fixed and variable material costs, the volume of wood purchased by consumers in different periods of time. The initial data used to solve the problem is as close as possible to the actual production conditions.
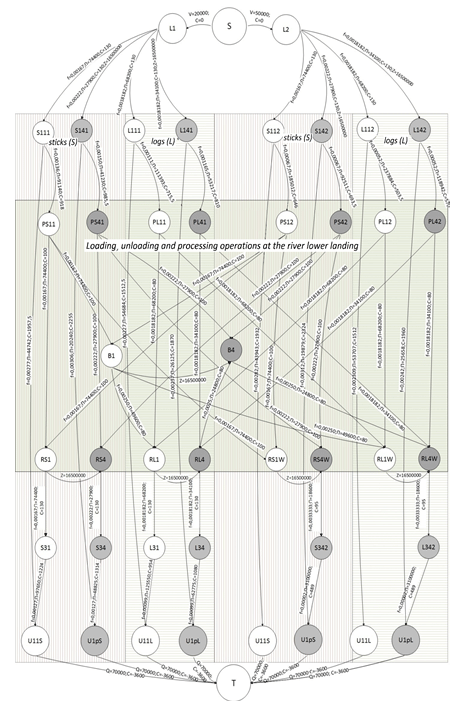
The arc designations on this graphic model are similar to the designations on the graphic model of wood transportation from the cutting area to the consumer. Logging terminal 2 is represented by vertexes that characterize three types of operations: unloading of wood (P), bucking (B) and loading into logging trucks (R).
Fig. 4 shows the results of the last iteration obtained when solving the graphoanalytic problem. The bold arcs in this figure demonstrate the rational volumes of wood transportation in different time periods. To improve the reader's visual perception of the results obtained, Fig. 5 shows a simplified diagram showing the results of the search for rational routes for the delivery of wood to the consumer.
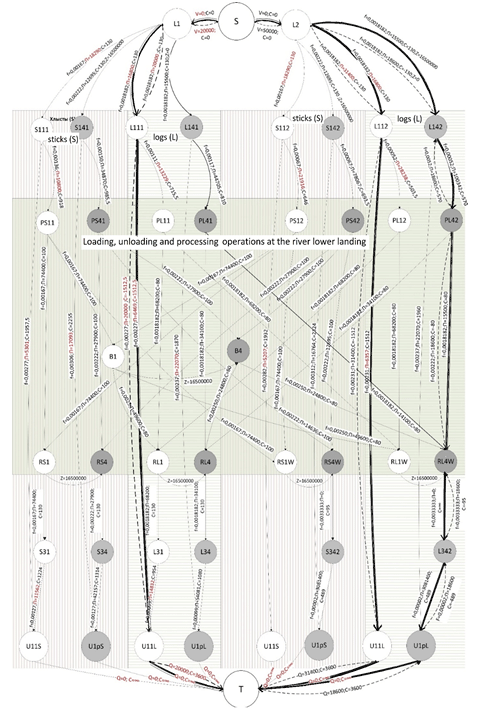
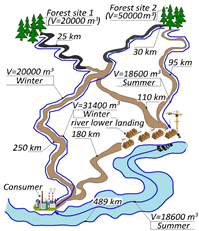
The analysis of the obtained results allows you to choose a rational plan of the company's work for two periods of the year. The timber harvested at the first forest site in the amount of 20000 m3 will be transported to the consumer by road in the first period. From the second forest site, the volume of harvested wood, equal to 31400 thousand m3, will be transported to the consumer by road in the first period. The remaining volume of 18600 m3 will be transported by road to the river lower landing and then by water in the second period of the year.
The cost of performing operations on the proposed technological chain will amount to 126279200 rubles. When selling wood, the profit will be 125720800 rubles.
To compare the indicators, the analysis of other variants of technological work chains was carried out. In the Krasnoyarsk Territory of the Russian Federation, under similar conditions, the most commonly used options are:
1) During the summer period, the wood is transported to the river lower landing with further transportation by water of the maximum possible volume of wood. The remaining volume of wood is transported in the winter by road to the consumer. In this case, taking into account the maximum load of the equipment, a volume of wood equal to 18600 m3 is transported from the second forest site in the summer to the river lower landing. The remaining volume of wood of the second forest site (31400 m3) is transported in winter by road to the consumer. At the same time, from the first forest site, the entire volume of wood (20000 m3) is transported in winter.
Calculations show that the cost of performing operations along this technological chain will amount to 130361200 rubles. When selling wood, the profit will be 121638800 rubles.
2) The entire volume of wood from both forest sites is transported to the consumer by road in winter and summer. In this case, taking into account the maximum load of the equipment, the transportation of the entire volume (50000 m3) from the second forest site is carried out to the consumer in the winter. In addition, during the winter period, a part of the volume (3770 m3) is delivered to the consumer from the first forest site. The remaining part of the wood from the first forest site (16230 m3) is delivered to the consumer by land transport in the summer.
Calculations show that the cost of performing operations along this technological chain will amount to 137252225 rubles. When selling wood, the profit will be 114747775 rubles.
As a result of this comparison, it is possible to note the possibility of reducing the total costs required for the transportation of a given volume of wood by between 3 and 8 percent compared to the other two options of the process chains.
According to the authors, as a result of using the proposed algorithm, it is possible to determine a rational sequence of development of forest areas, performing loading-unloading and processing operations, to justify the need of use forest warehouses, to determine the minimal total costs of the implementation of the work plan for transport and relocation operations and the profit received by selling products to the consumer.
For the wide implementation of the developed algorithm in production, it is advisable to develop software that will increase the degree of process automation of finding an effective sequence of technological operations performed during logging at timber enterprises of the Russian Federation.
4. CONCLUSION
The proposed algorithm allows us to determine the effective technological chain of logging operations in dynamic natural production conditions.
Therefore, it can be considered as a methodological basis for the design of logging infrastructure, taking into account the dynamically changing environment.