Original Article
Analysis of Carbonization Behavior of Hydrochar Produced by Hydrothermal Carbonization of Lignin and Development of a Prediction Model for Carbonization Degree Using Near-Infrared Spectroscopy
Un Taek HWANG2, Junsoo BAE2, Taekyeong LEE3, Sung-Yun HWANG2, Jong-Chan KIM4, Jinseok PARK4, In-Gyu CHOI3,4, Hyo Won KWAK3,4, Sung-Wook HWANG3,†, Hwanmyeong YEO3,4,†
Author Information & Copyright ▼
2Department of Forest Sciences, College of Agriculture and Life Sciences, Seoul National University, 1 Gwanak-ro, Gwanak-gu, Seoul 08826, Republic of Korea
3Research Institute of Agriculture and Life Sciences, Seoul National University, 1 Gwanak-ro, Gwanak-gu, Seoul 08826, Republic of Korea
4Department of Agriculture, Forestry and Bioresources, College of Agriculture and Life Sciences, Seoul National University, 1 Gwanak-ro, Gwanak-gu, Seoul 08826, Republic of Korea
† Corresponding author: Sung-Wook HWANG (e-mail:
dryellow@snu.ac.kr, ORCID: 0000-0001-8265-8700)
† Corresponding author: Hwanmyeong YEO (e-mail:
hyeo@snu.ac.kr, ORCID: 0000-0002-1779-069X)
© The Korean Society of Wood Science & Technology.
Received: Mar 10, 2021; Accepted: Mar 31, 2021
Published Online: May 25, 2021
Abstract
In this paper, we investigated the carbonization characteristics of lignin hydrochar prepared by hydrothermal carbonization and established a model for predicting the carbonization degree using near-infrared spectroscopy and partial least squares regression. The carbon content of the hydrothermally carbonized lignin at the temperature of 200 ℃ was higher by approximately 3 wt% than that of the untreated sample, and the carbon content tended to gradually increase as the heating time increased. Hydrothermal carbonization made lignin more carbon-intensive and more homogeneous by eliminating the microparticles. The discriminant and predictive models using near-infrared spectroscopy and partial least squares regression approppriately determined whether hydrothermal carbonization has been applied and predicted the carbon content of hydrothermal carbonized lignin with high accuracy. In this study, we confirmed that we can quickly and nondestructively predict the carbonization characteristics of lignin hydrochar manufactured by hydrothermal carbonization using a partial least squares regression model combined with near-infrared spectroscopy.
Keywords: hydrothermal carbonization; lignin; near-infrared spectroscopy; partial least squares regression
1. INTRODUCTION
Wood-based biomass consists of cellulose, hemicellulose, and lignin. With growing interest in bioenergy, measures to utilize wood-based biomass have been steadily studied (Ju et al., 2020; Oh et al., 2019). In the biorefinery process where biomass by-products of the agricultural and forest industries are utilized, cellulose and hemicellulose were mainly used and lignin was treated as low-cost fuels. Recently, however, there has been growing interest in utilizing lignin in phenolic compounds, carbon filters, hydrocarbons, and syngases (Park et al., 2020; Kim et al., 2011; Kim et al., 2019; Lee et al., 2019, Luo and Abu-Omar, 2017; Agrawal et al., 2014).
Lignin is one of important materials belonging to lignocellulosic biomass and natural phenolic polymers and is a high-carbon substance with 60-65 wt% carbon content. Over 70 million tons of lignin is produced annually as a byproduct of the paper making and pulping process (Kumar et al., 2009). Wood components, including lignin, decompose during heat treatment, forming new chemical bonds (Yang et al., 2020; Cahyono et al., 2020; Kim and Kim, 2019). The method of converting biomass through this process is largely divided into high-temperature pyrolysis and hydrothermal carbonization (HTC). HTC is the process of treating biomass in a thermochemical process to produce solid carbides (Wang et al., 2008). This is a process where both oxygen and hydrogen content are lowered by dehydration and decarboxylation at 180 to 360 ℃, a lower temperature compared to high-temperature pyrolysis. Coal is less energy efficient than gas or liquid fuels, so previously it was not much researched. However, it has the advantage of being stable and nontoxic as the process is performed on it at a low temperature. Its process is also valuable as a pre-treatment process for the production of functional materials (Lynam et al., 2011; Hoekman et al., 2011).
An elemental analysis is typically performed to measure the degree of carbonization of lignin samples produced in HTC (Kang et al., 2012). However, elemental analysis requires a process of separating gases generated by burning organic samples at a high temperature with gas chromatography, which makes real-time nondestructive testing impossible. To address this problem, near-infrared spectroscopy (NIRS) has been recently applied (Yeon et al., 2019). NIRS can quickly and non-destructively measure the key components of the sample and wood extracts have different optical absorption patterns which enable to predict their chemical properties (Schwanninger et al., 2011). Results have been reported from a number of studies that use NIRS to identify species and to predict physical characteristics (Hwang et al., 2016; Park et al., 2017; Yang et al., 2017).
In this study, we conducted HTC of Kraft lignin as a pre-treatment step for the development of a lignin-based high-performance adsorbent. We investigated change in the carbon content of lignin due to HTC and developed a model to non-destructively predict the carbonization behavior of lignin using NIRS and the least partial squares regression.
2. MATERIALS and METHODS
2.1. Testing Materials
The lignin used in HTC is a Kraft lignin powder produced as a byproduct of the pulping process and was provided by MOORIM P&P Co., Ltd. The pulping process is intended to produce bleached hardwood pulp, in the cooking process of which they use a strong alkaline white liquor consisting of sodium hydroxide (NaOH) and sodium sulfide (Na2S) and in the bleaching process of which they use chlorine dioxide (ClO2).
In order to investigate the difference in the carbonization behavior of lignin sample depending on the input in the HTC process, 140ml of distilled water was mixed with 2.8g, 5.6g and 8.4g of lignin sample, respectively. In other words, HTC was run on the lignin suspensions of solid-to-liquid ratio (S/L) 1/50, 2/50, and 3/50, respectively.
2.2. Hydrothermal Carbonization (HTC)
In order to identify the difference in the carbonization behavior of the lignin samples depending on the input, the lignin-and-distilled-water suspensions of solid-to-liquid ratio (S/L) 1/50, 2/50, and 3/50 were put in a reaction vessel and heated to 200 ℃ in a heating mantle. The heating rate was 3.6 ℃/min and maintained the temperature for 3, 5 and 10 hours after it reached 200 ℃. At the end of heating, the reaction vessel was put in ice water to quickly cool. Then the HTC lignin was filtered and dried for 48 hours in a 60 ℃ oven. The dried samples were pulverized and then humidified at 25 ℃ and 60% relative humidity, and decided the S/L ratio condition to investigate the effect of HTC time by doing elemental analysis of the conditioned lignin sample.
In order to observe the change in the carbonization behavior depending on the change in HTC time, HTC was performed on the lignin suspensions with the S/L ratio decided through the lignin input experiment at 200 ℃ for 1, 2, 3, 5 and 10 hours, respectively. The HTC lignin was cooled, filtered, and humidified in the same way as described before. Elemental analysis, scanning electron microscope (SEM) analysis, near-infrared (NIR) spectral measurement, and predictive model construction using the humidified samples were carried out.
2.3. Elemental analysis
The contents of C, H, and N were determined using an elemental analyzer (Flash 2000, Thermo Fisher Scientific, USA) to look into the carbonization behavior of lignin samples according to the HTC conditions (Hwang and Choi, 2018).
2.4. Surface Analysis
The HTC lignin and untreated samples were imaged at ×10,000 magnification using a scanning electron microscope (JEOL JSM-5300, JAPAN), and the surface changes in lignin samples caused by HTC were visually analyzed.
2.5. Development of Carbonization Behavior Prediction Model using NIRS and PLS Regression
The NIR spectra were acquired from HTC lignin using an NIR spectrometer (NIR Quest, Ocean Optics, USA). The wavelength range of the spectrometer was 869–2515 nm with an optical resolution of 6.6 nm. The measured NIR spectra were pre-processed by the second derivative using the Savitzky-Golay algorithm (Savitzky and Golay, 1964).
A model for predicting carbonization characteristics was developed using PLS regression (Yang et al., 2017). The model that outputs the carbon content (C wt%) using the second derivative NIR spectral data as input variables (256-dimensional vectors) was designed. Furthermore, a partial least squares discriminant analysis (PLS-DA) was performed to determine whether lignin was HTC treated (Hwang et al., 2016). In PLS-DA, the class values of the untreated and HTC lignin samples are assigned as -1 and 1, respectively, so that negative numbers are classified as untreated samples and positive numbers as HTC lignin relative to the reference class value of 0. PLS regression and PLS-DA models were validated by leave-one-out cross-validation (Stone, 1974).
3. RESULTS and DISCUSSION
3.1. HTC Process Analysis
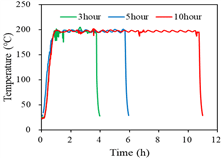
The temperature-time curve during the HTC process is shown in Fig. 1. It took about 50 minutes to reach 200 ℃ at room temperature, and we maintained the temperature within the variation of about 3 ℃ after reaching 200 ℃. The effect of residual heat was eliminated because the temperature was rapidly lowered by quick cooling at the end of the set heating time.
3.2. Elemental Analysis
3.2.1. Effect of S/L ratio on Carbon Content
The results of elemental analysis of HTC lignin manufactured with different S/L ratios is shown in Table 1. Under the S/L ratio conditions (1/50, 2/50, 3/50) investigated in this study, it is shown that the carbon content of lignin is independent of the S/L ratio. The carbon content increased slightly with increase in the heating time, but the difference in carbon content by the S/L ratio did not show a clear tendency to increase or decrease.
Table 1.
Element composition of HTC lignin with different solid-liquid ratios
| Temp. (℃) / Time (h) |
Solid-liquid ratio |
Elemental content (wt%) |
O/C |
H/C |
| C |
O1) |
H |
| Control 1 |
- |
62.86 |
30.84 |
5.94 |
0.37 |
1.13 |
| Control 2 |
- |
61.97 |
31.69 |
5.98 |
0.38 |
1.16 |
| Control 3 |
- |
60.67 |
33.50 |
5.83 |
0.41 |
1.15 |
| 200 ℃ / 3h |
1/50 |
64.81 |
29.73 |
5.45 |
0.34 |
1.01 |
| 2/50 |
65.61 |
28.79 |
5.59 |
0.33 |
1.02 |
| 3/50 |
64.74 |
29.77 |
5.49 |
0.34 |
1.02 |
| 200 ℃ / 5h |
1/50 |
64.73 |
29.85 |
5.41 |
0.35 |
1.00 |
| 2/50 |
64.39 |
30.10 |
5.51 |
0.35 |
1.03 |
| 3/50 |
65.90 |
28.52 |
5.58 |
0.32 |
1.02 |
| 200 ℃ / 10h |
1/50 |
65.09 |
29.53 |
5.37 |
0.34 |
0.99 |
| 2/50 |
65.46 |
28.97 |
5.56 |
0.33 |
1.02 |
| 3/50 |
65.59 |
28.87 |
5.53 |
0.33 |
1.01 |
| 1) O (wt%) = 100 – (C + H + N wt%) |
Download Excel Table
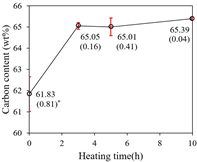
The average carbon content was 61.8 wt% with the untreated (control) sample and it gradually increased with HTC, reaching 65.4 wt% after 10 hours of treatment (Fig. 2). With an increase in the average carbon content, the standard deviation decreased from 0.81 to 0.04 (Fig. 2), which means the samples were homogenized by the HTC process.
The S/L ratio of 2/50 with the smallest standard deviation of the carbon content among the investigated ratios was selected as the optimal condition and based on this condition, and the change in the carbon content with increasing HTC time was investigated.
3.2.2. Analysis of Carbonization Behavior by HTC Time
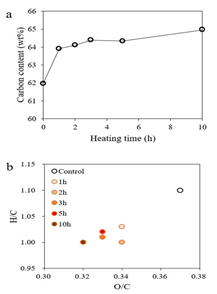
The elemental analysis of HTC lignin with different HTC times is shown in Table 2. The carbon content of the untreated sample was 61.96 wt% and the carbon content of lignin increased to 64.96 wt% after 10 hours of HTC treatment. With increase in HTC time, the carbon content also increased (Fig. 3a). Compared to untreated samples, carbon content increased by approximately 2 wt% after 1 hour treatment and 3 wt% after 10 hours treatment (Table 2). The carbon content of HTC lignin and untreated lignin showed a significant difference, and it was found to increase and converge in logarithmic form with increasing time in the HTC process. In the van Krevelen diagram presented in Fig. 3b, there was a tendency to move down to the left with increasing HTC heating time. From these results, it was shown that the HTC process transforms the lignin into a carbon-intensive structure and produces a more intensive structure as the heating time increases.
Table 2.
Element composition of HTC lignin (S/L ratio of 2/50) with different heating time
| Temp. (℃) / Time (h) |
Elemental content (wt%) |
O/C |
H/C |
| C |
O |
H |
N |
| Control |
61.96 |
30.34 |
5.69 |
0.25 |
0.37 |
1.10 |
| 200 ℃/1h |
63.92 |
28.93 |
5.47 |
0.27 |
0.34 |
1.03 |
| 200 ℃/2h |
64.10 |
28.81 |
5.36 |
0.27 |
0.34 |
1.00 |
| 200 ℃/3h |
64.38 |
28.50 |
5.43 |
0.26 |
0.33 |
1.01 |
| 200 ℃/5h |
64.34 |
28.38 |
5.45 |
0.30 |
0.33 |
1.02 |
| 200 ℃/10h |
64.96 |
28.05 |
5.40 |
0.26 |
0.32 |
1.00 |
Download Excel Table
Fig. 3.
Carbonization behavior of HTC lignin. (a) Changes in carbon content of lignin with increasing heating time and (b) their van Krevelen diagram.
Download Original Figure
From Kraft lignin, chemically bound water and hydroxyl groups break away at 105–210 ℃. Lignin, which went through the HTC process, showed a tendency of overall reduction in hydrogen and oxygen content and increase in carbon content, which is believed to be due to the drop-out of phenol groups and acetyl groups (Titirici et al., 2007).
3.3. Analysis of Degree of Heat Treatment
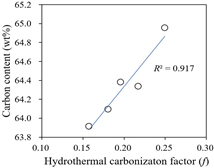
Ruyter (1982) presented the thermochemical conversion model ( f ) of HTC relative to heating time t and temperature T using the Arrhenius equation as follows.
where, f : hydrothermal carbonization (coalification) factor, t: time (sec), and T: temperature (K).
The HTC temperature of 200 ℃ and heating times set in this study were substituted in the above equation to calculate the value of f . A linear relationship with the coefficient of determination (R2) value 0.917 from the plot of carbon content relative to f values was observed, confirming a possibility that carbon content can be estimated using the degree of heat treatment values in the f -value range of 0.15 to 0.30 (Fig. 4).
Fig. 4.
Relationship between conversion value f of hydrothermal carbonization and carbon content of HTC lignin.
Download Original Figure
3.4. Surface Analysis
SEM imaging was conducted to investigate surface shape changes before and after the HTC process. Although the untreated sample surface was covered with a large amount of microparticles (Fig. 5a), a smooth surface with microparticles removed in HTC lignin was observed. These results visually support the homogenization of samples by HTC mentioned in Fig. 2.
Fig. 5.
SEM images of untreated lignin (a) and HTC lignin heated for 3 hours (b) and 10 hours (c). Scale bars = 5 μ m
Download Original Figure
3.5. Prediction of Carbonization Degree using NIRS
3.5.1. NIR Spectrum of HTC Lignin
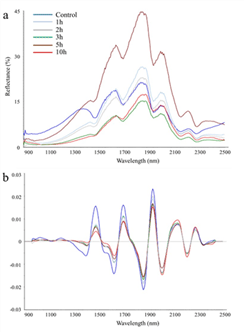
Fig. 6 showed that the NIR spectrum of lignin samples varies significantly due to the difference in heating time in the HTC process. In the original NIR spectrum (Fig. 6a), the difference in spectral properties between samples depending on heating time was observed, but direct comparison was somewhat difficult due to different baseline of the spectrum. On the other hand, in the NIR spectra when pretreated with second derivative, the difference in the baseline was eliminated, the peak was amplified and definite spectral differences between the samples were observed (Fig. 6b).
Carbon content was shown to increase with decreasing peaks in the 1400 nm to 1500 nm wavelength range as in Fig. 6b. In particular, heat treated lignin samples showed a very distinct difference compared to untreated samples. This NIR spectral range is assigned to the phenolic OH group and phenolic group (Schwanninger et al., 2011). As the heating time increases, the phenolic group decreases, which appears to have had the carbon content increase. Other studies have reported about the phenomenon that aromatic structures decrease with increasing carbonization degree in natural coal or HTC coal (Sugimoto et al., 1997).
3.5.2. Determining whether HTC has been applied and predicting carbon content using PLS regression model
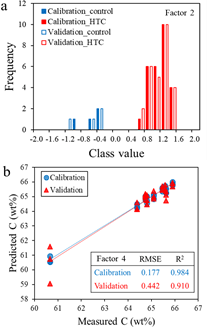
In the PLS-DA model to check whether HTC has been applied, the untreated sample and HTC lignin could be clearly distinguished (Fig. 7a). In the discriminant histogram of the PLS-DA model, the untreated materials all had negative values and the HTC lignin all represented positive values, differentiating them with 100% accuracy. As shown in Fig. 6b’s NIR spectrum pretreated with second derivatives, the spectrum of untreated samples has a significantly higher peak than that of HTC lignin not only in the 1400–1500 nm region with phenolic groups assigned but also in the range around 1700 nm with aromatic rings and C-H bonding of lignin assigned. It was considered that HTC is clearly verified in the PLS-DA model due to these differences in the NIR spectrum.
Fig. 7.
Histogram of class value computed by PLS-DA model (a) and regression plot of PLS model for carbon content prediction (b).
Download Original Figure
In the PLS regression model, A strong linear relationship was confirmed between a measured value of carbon content and the predicted value from the established model. The coefficient of determination (R2) values of the calibration and validation sets were 0.984 and 0.910, respectively, precisely predicting the carbon content of lignin (Fig. 7b). Therefore, it was believed that the carbonization behavior of HTC lignin can be quickly predicted in a non-destructive manner using NIRS.
4. CONCLUSION
Using NIRS and PLS regression, a model to predict the carbonization behavior of HTC lignin was established. Depending on the application of the HTC process, the carbon content of the samples differed significantly and it was confirmed that lignin changed to a more carbon-intensive structure with the increase in heating time. It was considered that the 1400-1500 nm NIR spectral range with the phenolic group of lignin assigned to be an important range in explaining the carbonization behavior of lignin. The PLS-DA model perfectly identified whether lignin is HTC treated or not and the PLS regression model predicted carbon content with high accuracy. The results of this study show that the PLS regression model combined with NIRS is a promising tool to quickly and nondestructively predict the carbocation behavior of HTC lignin.
ACKNOWLEDGMENT
This study was supported by the R&D Program for Forest Science Technology (Project No. 2020215D10- 2122-AC01) provided by Korea Forest Service and the BK21 FOUR (Fostering Outstanding Universities for Research) funded by the Ministry of Education (MOE, Korea) and National Research Foundation of Korea (NRF)
Appendices
APPENDIX (Korean Version)
열수 탄화 공정을 거친 리그닌 하이드로차(hydrochar)의 탄화 거동 분석과 근적외선 분광법을 이용한 예측 모델 개발
초록: 본 논문에서는 열수 탄화(hydrothermal carbonization)에 의해 제조된 리그닌 하이드로차의 탄화 특성을 조사하였고, 근적외선 분광법과 부분 최소 제곱(partial least squares) 회귀를 이용하여 탄화 거동을 예측하기 위한 모델을 수립하였다. 온도 200℃에서 열수 탄화된 리그닌의 탄소 함량은 무처리 시료 보다 약 3 wt% 높았으며 가열 시간이 증가할수록 탄소 함량도 서서히 증가하는 경향이 나타났다. 열수 탄화는 리그닌을 더욱 탄소 집약적으로 변화시키고 마이크로 파티클을 제거하여 더욱 균질한 특성을 부여하였다. 근적외선 분광법과 부분 최소 제곱 회귀를 이용한 판별 및 예측 모델은 수열 탄화의 적용 여부를 완벽히 구분했으며 높은 정확도로 열수 탄화 리그닌의 탄소 함량을 예측하였다. 본 연구로부터 근적외선 분광법과 결합된 부분 최소 제곱 회귀 모델을 이용하여 열수 탄화에 의해 제조된 리그닌 하이드로차의 탄화 특성을 빠르고 비파괴적으로 예측할 수 있다는 것이 확인되었다.
1. 서론
목질계 바이오매스는 셀룰로오스(cellulose), 헤미셀룰로오스(hemicellulose), 리그닌(lignin)으로 구성되어 있다. 바이오 에너지에 대한 관심이 높아지면서 목질계 바이오매스를 활용하기 위한 방안이 꾸준히 연구되어 왔다(Ju et al., 2020; Oh et al., 2019). 농산업 바이오매스 부산물이 활용되는 바이오리파이너리(biorefinery) 공정에서는 주로 셀룰로오스와 헤미셀룰로오스가 이용되었고 리그닌은 부산물로 취급되었다. 그러나 최근 들어 페놀 화합물, 탄소 필터, 탄화 수소, 합성 가스(syngas) 등 리그닌을 활용하는 방안에 대한 관심이 증가하고 있다(Park et al., 2020; Kim et al., 2011; Kim et al., 2019; Lee et al., 2019, Luo and Abu-Omar, 2017; Agrawal et al., 2014).
리그닌은 lignocellulosic biomass와 천연 페놀 폴리머 중에서 중요한 물질 중 하나이며, 60 - 65 wt% 탄소 함량을 갖고 있는 고탄소 물질로 제지 및 펄핑 공정의 부산물로서 매년 7000만 톤 이상 생산되고 있다(Kumar et al., 2009). 리그닌을 포함한 목재 성분은 열처리 과정에서 분해되면서 새로운 화학 결합이 형성된다(Yang et al., 2020; Cahyono et al., 2020; Kim and Kim, 2019). 이 과정을 통해 바이오매스를 전환하는 방법은 크게 고온 열분해(pyrolysis)와 열수 탄화(hydrothermal carbonization, HTC)로 구분되며, HTC는 바이오매스를 열화학적 공정으로 처리하여 고체 탄화물을 생성하는 과정이다(Wang et al., 2008). 이는 고온 열분해에 비해 낮은 온도인 180 – 360℃에서 탈수 및 카르복실기 이탈(decarboxylation)에 의해 산소와 수소 함량을 모두 낮추는 공정을 의미한다. 이전에는 석탄류가 기체나 액체 연료에 비해 에너지 효율이 낮아 연구가 잘 이루어지지 않았으나 낮은 온도에서 수행되는 공정의 특성 상 안정적이고 무독성이라는 이점이 있다. 또한 기능성 물질 생산을 위한 전처리 과정으로 가치가 있다(Lynam et al., 2011; Hoekman et al., 2011).
HTC를 통해 생성된 리그닌 시료의 탄화도를 측정하기 위해 일반적으로 원소분석이 수행되고 있다(Kang et al., 2012). 그러나 원소분석은 유기물 시료를 고온으로 연소시켜 발생된 가스를 가스 크로마토그래피(gas chromatography)로 분리하는 공정을 수행해야 하므로 실시간 비파괴검사가 불가능하다. 이러한 문제를 해결하기 위해 근적외선 분광분석법(near-infrared spectroscopy, NIRS)이 최근 적용되고 있다(Yeon et al., 2019). NIRS는 시료의 주요 성분을 빠르고 비파괴적으로 측정할 수 있으며 목재 추출물은 서로 다른 광학적 흡수 패턴을 가지고 있어 화학적 성질을 예측할 수 있다(Schwanninger et al., 2011). NIRS를 이용하여 수종 식별 및 물리적 특성 예측이 가능하다는 결과들이 다수의 연구로부터 보고되었다(Hwang et al., 2016; Park et al., 2017; Yang et al., 2017).
본 연구에서는 리그닌 기반의 고성능 흡착제를 개발하기 위한 전처리 단계로서 크라프트 리그닌을 HTC하였다. HTC에 의한 리그닌의 탄소 함량 변화를 조사하였으며, NIRS와 최소 부분 제곱(partial least squares, PLS) 회귀를 이용하여 리그닌의 탄화 거동을 비파괴적으로 예측하기 위한 모델을 개발하였다.
2. 재료 및 방법
2.1. 공시 재료
HTC에 사용된 리그닌은 펄핑(pulping) 공정의 부산물로 생성된 분말상의 크라프트 리그닌(kraft lignin)이며 무림 P&P ㈜ (MOORIM P&P Co., Ltd.)로부터 제공받았다. 해당 펄핑 공정은 활엽수 표백 펄프를 생산하기 위한 것으로 증해 공정에서는 수산화나트륨(sodium hydroxide, NaOH)과 황화나트륨(sodium sulfide, Na2S)으로 구성된 강알칼리성의 백액(white liquor)을 사용하고 표백 공정에서는 이산화염소(chlorine dioxide, ClO2)를 사용한다.
HTC 공정에서 리그닌 시료의 투입량에 따른 탄화 거동의 차이를 알아보기 위해 2.8g, 5.6g, 8.4g의 리그닌 시료를 각각 증류수 140 ml와 혼합하였다. 즉 고액비(solid-to-liquid ratio, S/L) 1/50, 2/50, 3/50의 리그닌 현탁액을 각각 HTC하였다.
2.2. 열수 탄화 (HTC)
리그닌 시료의 투입량에 따른 탄화 거동의 차이를 확인하기 위해 고액비 1/50, 2/50, 3/50의 리그닌과 증류수의 현탁액을 각각 반응 용기에 넣고 히팅 맨틀에서 200℃까지 가열하였다. 승온 속도는 3.6℃ /min이었으며, 200℃ 도달 후 3, 5, 10 시간 동안 유지하였다. 가열 종료 후 반응 용기를 얼음물에 넣어 급속 냉각하였다. 이후 HTC 리그닌(hydrothermal lignin)을 감압 여과한 후 60℃ 오븐에서 48시간 동안 건조하였다. 건조된 시료는 분말상으로 분쇄한 후 25°C, 상대 습도 60%의 조건에서 조습하였으며, 조습된 리그닌 시료를 원소 분석하여 HTC 시간의 영향을 조사하기 위한 고액비 조건을 선정하였다.
HTC 시간의 변화에 따른 탄화 거동의 변화를 관찰하기 위해 리그닌 투입량 실험을 통해 선정된 고액비의 리그닌 현탁액을 200℃에서 1, 2, 3, 5, 10시간 동안 각각 HTC하였다. HTC 리그닌은 이전과 동일한 방식으로 냉각, 여과, 조습하였다. 조습이 완료된 시료를 이용하여 원소 분석, 주사전자현미경(scanning electron microscope, SEM) 분석, 근적외선 (near-infrared, NIR) 스펙트럼 측정, 예측 모델 구축이 수행되었다.
2.3. 원소 분석 (Elemental analysis)
HTC 조건에 따른 리그닌 시료의 탄화 거동을 조사하기 위해 원소 분석기(Flash 2000, Thermo Fisher Scientific, Germany)를 이용하여 C, H, N 성분의 함량을 조사하였다(Hwang and Choi, 2018).
2.4. 표면 분석
주사전자현미경(JEOL JSM-5300, JAPAN)을 이용하여 HTC 리그닌과 미처리 시료를 10,000 배율로 촬영하였다. HTC에 의한 리그닌 시료의 표면 변화를 시각적으로 분석하였다.
2.5. NIRS 와 PLS 회귀를 이용한 탄화 거동 예측 모델 개발
NIR 분광기(NIR Quest, Ocean Optics, USA)를 이용하여 HTC 리그닌으로부터 NIR 스펙트럼을 측정하였다. 분광기의 파장 영역은 869 - 2515 nm이었으며 해상도는 6.6 nm이다. 측정된 NIR 스펙트럼은 Savitzky-Golay 알고리즘에 의해 2차 미분(second derivative)으로 전처리 하였다(Savitzky and Golay, 1964).
PLS 회귀를 이용하여 탄화 거동을 예측하기 위한 모델을 구축하였다(Yang et al., 2017). 2차 미분 NIR 스펙트럼 데이터를 입력 변수(256차원 벡터)로 사용하여 탄소 함량(C wt%)이 출력되는 모델이 설계되었다. 또한 리그닌의 HTC 여부를 판단하기 위해 부분 최소 제곱 판별 분석(partial least squares discriminant analysis, PLS-DA)이 수행되었다(Hwang et al., 2016). PLS-DA에서 무처리재와 HTC 리그닌의 클래스 값(class values)을 각각 -1과 1로 할당하여 클래스 값 0을 기준으로 음수는 무처리 시료, 양수는 HTC 리그닌으로 분류한다. PLS 회귀 및 PLS-DA 모델들은 leave-one-out cross-validation으로 검증(validation)되었다(Stone, 1974).
3. 결과 및 고찰
3.1. HTC 공정 분석
HTC 공정 중의 온도-시간 곡선이 Fig. 1에 제시되어 있다. 상온에서 200℃까지 도달하는 데 약 50분이 소요되었으며, 200℃ 도달 후 약 3℃의 진폭으로 온도가 유지되었다. 설정된 가열 시간 종료 후 급속 냉각에 의해 온도는 급격히 감소되었기 때문에 잔열(residual heat)에 의한 영향은 제거되었다.
3.2. 원소 분석
3.2.1. 고액비가 탄소 함량에 미치는 영향
다른 고액비로 제조된 HTC 리그닌의 원소 분석 결과가 Table 1에 제시되어 있다. 본 연구에서 조사된 고액비 조건(1/50, 2/50, 3/50)에서는 리그닌의 탄소 함량이 고액비와 무관함을 보여준다. 가열 시간 증가에 따라 탄소 함량은 조금 증가하였지만 고액비에 따른 탄소 함량의 차이는 일정한 증감의 경향이 명확히 나타나지 않았다.
평균 탄소 함량은 무처리 시료(control)의 61.8 wt%에서 시작하여 HTC에 의해 점차 증가하여 10시간 처리 후에는 65.4 wt%에 도달하였다(Fig. 2). 평균 탄소 함량의 증가와 함께 표준 편차는 0.81에서 0.04까지 감소되어 HTC 공정에 의해 시료가 균질화되었다.
조사된 고액비들 중 탄소 함량의 표준 편차가 가장 작았던 2/50 비율을 최적 조건으로 선정하였고, 이 조건을 기반으로 HTC 시간 증가에 따른 탄소 함량의 변화를 조사하였다.
3.2.2. HTC 시간에 따른 탄화 거동 분석
HTC 시간을 달리한 HTC 리그닌의 원소 분석 결과가 Table 2에 제시되어 있다. 무처리 시료의 탄소 함량은 61.96 wt%이었으며 10시간 동안 수열 처리 후 리그닌의 탄소 함량은 64.96 wt%로 증가하였다. HTC 시간의 증가와 함께 탄소 함량도 함께 증가하였다(Fig. 3a). 무처리 시료와 비교하여 1시간 처리 시 탄소 함량은 약 2 wt% 증가하였으며 10시간 처리 시에는 3 wt% 증가하였다(Table 3). HTC 리그닌과 무처리 리그닌의 탄소 함량은 뚜렷한 차이가 나타났고 HTC 공정에서의 시간이 증가함에 따라 탄소 함량은 로그 형태로 증가 수렴하는 모습을 보여주었다. Fig. 3b에 제시된 van Krevelen diagram에서는 HTC 가열 시간이 증가할수록 좌하향하는 경향이 나타났다. 이러한 결과로부터 HTC 공정에 의해 리그닌은 탄소 집약적인 구조로 변화되며 가열 시간이 증가할수록 더욱 집약적 구조가 생성된다는 것을 알 수 있었다.
크라프트 리그닌은 105 - 210°C에서 화학적으로 결합된 물과 수산기(hydroxyl group)의 이탈이 발생한다. HTC 공정을 거친 리그닌은 전반적으로 수소, 산소 함량이 줄어들었고 탄소 함량이 증가하는 경향을 보였는데 이는 페놀기, 아세틸기 등이 떨어져 나갔기 때문이라 판단된다(Titirici et al., 2007).
3.3. 열처리도 분석
Ruyter(1982)는 아레니우스 식(Arrhenius equation)을 이용하여 가열 시간 t(sec)와 온도 T(K)에 대한 HTC의 열화학적 전환 모델( f )을 다음과 같이 제시하였다.
본 연구에서 설정된 HTC 온도 200°C와 가열 시간들을 위의 수식에 대입하여 f 값을 산출하였다. f 값에 대한 탄소 함량의 플롯으로부터 결정 계수(coefficient of determination, R2) 값 0.917로 선형적 관계가 관찰되어 f 값 범위 0.15에서 0.30 사이일 때 열처리도 값을 이용하여 탄소 함량을 추정할 수 있다는 가능성을 확인하였다(Fig. 4).
3.4. 표면 분석
HTC 공정 전후의 표면 형태 변화를 살펴보기 위해 SEM 촬영을 수행하였다. 무처리 시료는 표면이 다량의 마이크로 파티클에 의해 덮여 있지만(Fig. 5a) HTC 리그닌에서는 마이크로 파티클이 제거된 매끈한 표면이 관찰되었다. 이러한 결과는 Fig. 2에서 언급된 HTC에 의한 시료의 균질화를 시각적으로 뒷받침해준다.
3.5. NIRS을 이용한 탄화 거동 예측
3.5.1. HTC 리그닌의 NIR 스펙트럼
HTC 공정에서 가열 시간의 차이에 의해 리그닌 시료의 NIR 스펙트럼이 크게 달라지는 것을 Fig. 6에서 볼 수 있다. 오리지널 NIR 스펙트럼(Fig. 6a)에서는 가열 시간에 따라 시료 간 스펙트럼 특성의 차이가 관찰되지만 스펙트럼의 베이스라인이 모두 달라 직접적인 비교는 다소 곤란하였다. 반면 2차 미분으로 전처리한 NIR 스펙트럼에서는 베이스라인의 차이가 제거되고 피크가 증폭되어 샘플간 스펙트럼 차이가 명확히 관찰되었다(Fig. 6b).
Fig. 6b의 1400 nm - 1500 nm 파장 영역에서 피크가 감소함에 따라 탄소 함량이 증가하는 모습이 확인되었다. 특히 무처리 시료와 비교하여 열처리된 리그닌 시료는 매우 뚜렷한 차이를 보여주었다. 이 NIR 스펙트럼 영역은 phenolic OH group 및 phenolic group으로 할당되어 있다(Schwanninger et al., 2011). 가열 시간이 증가함에 따라 phenolic group이 감소하고 이로 인해 탄소 함량이 증가한 것으로 보인다. 자연상태의 석탄이나 HTC 석탄에서 탄화도가 증가함에 따라 방향족 구조가 감소하는 현상은 다른 연구에서도 보고된 바 있다(Sugimoto et al., 1997).
3.5.2. PLS 회귀 모델을 이용한 HTC 여부 판별 및 탄소 함량 예측
HTC 유무를 확인하기 위한 PLS-DA 모델에서 무처리 시료와 HTC 리그닌은 매우 명확히 구분되었다(Fig. 7a). PLS-DA 모델의 판별 히스토그램에서 무처리재는 모두 음수 값을 가졌으며 HTC 리그닌은 모두 양수 값을 나타내어 100%의 정확도로 분류되었다. 그림 6b의 2차 미분으로 전처리된 NIR 스펙트럼에서 볼 수 있듯이 phenolic group이 할당된 1400 - 1500 nm 영역뿐만 아니라 리그닌의 방향족 고리 및 C-H 결합이 할당된 1700 nm 부근 영역에서도 무처리 시험편의 스펙트럼이 HTC 리그닌의 스펙트럼보다 확연히 높은 피크를 가진다. 이러한 NIR 스펙트럼의 차이 때문에 PLS-DA 모델에서 HTC 여부가 명확히 구분된 것으로 판단된다.
PLS 회귀 모델에서는 탄소 함량의 측정 값과 수립된 모델의 예측 값 사이에 강력한 선형 관계가 확인되었다. 검량(calibration)과 검증(validation) 세트의 결정 계수 (R2) 값은 각각 0.984과 0.910으로 리그닌의 탄소 함량을 정밀하게 예측하였다(Fig. 7b). 따라서 NIRS를 이용하여 HTC 리그닌의 탄화 거동을 비파괴적 방식으로 신속하게 예측 가능할 것으로 판단된다.
4. 결론
NIRS와 PLS 회귀를 이용하여 HTC 리그닌의 탄화 거동을 예측하기 위한 모델을 구축하였다. HTC 공정의 적용 여부에 따라 시료의 탄소 함량은 확연히 차이가 났으며 가열 시간의 증가와 함께 리그닌은 더욱 탄소 집약적 구조로 변화된다는 것이 확인되었다. 리그닌의 phenolic group이 할당되어 있는 1400 - 1500 nm의 NIR 스펙트럼 영역이 리그닌의 탄화 거동을 설명하는 중요한 영역이라고 판단되었다. PLS-DA 모델은 리그닌의 HTC 여부를 완벽히 분류했으며, PLS 회귀 모델은 높은 정확도로 탄소 함량을 예측하였다. 본 연구의 결과는 NIRS와 결합된 PLS 회귀 모델이 HTC 리그닌의 탄화 거동을 빠르고 비파괴적으로 예측할 수 있는 유망한 도구임을 보여준다.
REFERENCES
Agrawal A., Kaushik N., Biswas S. Derivatives and applications of lignin–an insight. The SciTech Journal. 2014; 1(7):30-36.

Cahyono T.D., Darmawan W., Priadi T., Iswanto A.H. Flexural Properties of Heat-Treatment Samama (Anthocephalus macrophyllus) Wood Impregnated by Boron and Methyl Metacrylate. Journal of the Korean Wood Science and Technology. 2020; 48(1):76-85.

Hoekman S.K., Broch A., Robbins C. Hydrothermal carbonization (HTC) of lignocellulosic biomass. Energy Fuels. 2011; 25:1802-1810


Hwang H., Choi J.W. Preparation of nanoporous activated carbon with sulfuric acid lignin and its application as a biosorbent. Journal of the Korean Wood Science and Technology. 2018; 46(1):17-28.

Hwang S.W., Horikawa Y., Lee W.H., Sugiyama J. Identification of Pinus species related to historic architecture in Korea using NIR chemometric approaches. Journal of Wood Science. 2016; 62(2):156-167


Ju Y.M., Lee H.W., Kim A.R., Jeong H., Chae K.S., Lee J., Ahn B.J., Lee S.M. Characteristics of Carbonized Biomass Produced in a Manufacturing Process of Wood Charcoal Briquettes Using an Open Hearth Kiln. Journal of the Korean Wood Science and Technology. 2020; 48(2):181-195.

Kang S., Li X., Fan J., Chang J. Solid fuel production by hydrothermal carbonization of black liquor. Bioresource Technology. 2012; 110:715-718


Kim A.R., Kim N.H. Effect of Heat Treatment and Particle Size on the Crystalline Properties of Wood Cellulose. Journal of the Korean Wood Science and Technology. 2019; 47(3):299-310.

Kim K.H., Kim J.Y., Kim C.S., Choi J.W. Pyrolysis of Lignin Obtained from Cinnamyl Alcohol Dehydrogenase (CAD) Downregulated Arabidopsis Thaliana. Journal of the Korean Wood Science and Technology. 2019; 47(4):442-450.

Kim K.H., Moon S.J., Kim T.S., Lee S.M., Yeo H., Choi I.G., Choi J.W. Characterization of pyrolytic lignin in biooil produced with Yellow poplar (Liriodendron tulipifera). Journal of the Korean Wood Science and Technology. 2011; 39(1):86-94


Kumar S., Mohanty A.K., Erickson L., Misra M. Lignin and its applications with polymers. Journal of Biobased Materials and Bioenergy. 2009; 3(1):1-24


Lee H.W., Jeong H., Ju Y.M., Youe W.J., Lee J., Lee S.M. Pyrolysis Properties of Lignins Extracted from Different Biorefinery Processes. Journal of the Korean Wood Science and Technology. 2019; 47(4):486-497.

Luo H., Abu-Omar M.M., Elsevier Amsterdam. Chemicals from lignin. Encyclopedia of Sustainable Technologies. 2017; :573-585.

Lynam J.G., Coronella C.J., Yan W., Reza M.T., Vasquez V.R. Acetic acid and lithium chloride effects on hydrothermal carbonization of lignocellulosic biomass. Bioresource Technology. 2011; 102:6192-6199


Oh S., Ahn S.H., Choi J.W. Effect of Different Zeolite Supported Bifunctional Catalysts for Hydrodeoxygenation of Waste Wood Bio-oil. Journal of the Korean Wood Science and Technology. 2019; 47(3):344-359.

Park S.Y., Kim J.C., Kim J.H., Yang S.Y., Kwon O., Yeo H., Cho K.C., Choi I.G. Possibility of wood classification in Korean softwood species using near-infrared spectroscopy based on their chemical compositions. Journal of the Korean Wood Science and Technology. 2017; 45(2):202-212


Park S.Y., Choi J.H., Cho S.M., Choi J.W., Choi I.G. Structural Analysis of Open-Column Fractionation of Peracetic Acid-Treated Kraft Lignin. Journal of the Korean Wood Science and Technology. 2020; 48(6):769-779.

Ragauskas A.J., Beckham G.T., Biddy M.J., Chandra R., Chen F., Davis M.F., Davison B.H., Dixon R.A., Gilna P., Keller M. Lignin valorization: improving lignin processing in the biorefinery. 2014; 344(6185):1246843


Ruyter H.P. Coalification model. Fuel. 1982; 61:1182-1187


Savitzky A., Golay M.J. Smoothing and differentiation of data by simplified least squares procedures. Analytical Chemistry. 1964; 36(8):1627-1639.

Schwanninger M., Rodrigues J.C., Fackler K. A review of band assignments in near infrared spectra of wood and wood components. Journal of Near Infrared Spectroscopy. 2011; 19(5):287-308


Stone M. Cross-validatory choice and assessment of statistical predictions. Journal of the Royal Statistical Society: Series B (Methodological). 1974; 36(2):111-133


Sugimoto Y., Miki Y. In: Ziegler A., van Heek K.H., Klein J., Wanzl W., editors. Chemical structure of artificial coals obtained from cellulose, wood and peat. Proceedings of the 9th International Conference on Coal Science. 1997; 97:187-190.

Titirici M.M., Thomas A., Antonietti M. Back in the black: hydrothermal carbonization of plant material as an effcient chemical process to treat the CO2 problem?. New Journal of Chemistry. 2007; 31:787-789


Wang M.X., Wang C.Y., Li T.Q., Hu Z.J. Preparation of mesophase-pitch-based carbon foams at low pressures. Carbon. 2008; 46(1):84-91


Yang S.M, Lee H.J., Kang S.G. Analysis of Heat Transfer Characteristics by Materials in Closed Conditions Using Acrylic Hemisphere (Ⅰ): Comparison of Interior Finishing Materials. Journal of the Korean Wood Science and Technology. 2020; 48(2):217-230.

Yang S.Y., Park Y., Chung H., Kim H., Park S.Y., Choi I.G., Kwon O., Cho K.C., Yeo H. Partial least squares analysis on near-infrared absorbance spectra by air-dried specific gravity of major domestic softwood species. Journal of the Korean Wood Science and Technology. 2017; 45(4):399-408.

Yeon S., Park S.Y., Kim J.H., Kim J.C., Yang S.Y., Yeo H, Kwon O., Choi I.G. Effect of Organic Solvent Extractives on Korean Softwoods Classification Using Near-infrared Spectroscopy. Journal of the Korean Wood Science and Technology. 2019; 47(4):509-518.

