1. INTRODUCTION
Charcoal and Agglomerated charcoal, which are wood products designated by the Act on the Sustainable Use of Wood, are defined in ‘Annex 14’ and ‘Annex 15’ of ‘Specifications and Quality Standards for Wood Products’ of National Institute of Forest Science Notice No. 2018-8 (Korea Forest Service, 2018). The charcoal is classified into white charcoal and black charcoal based on the refining method; one is cooled down outside a charcoal kiln (white charcoal) and the other one is cooled down inside a charcoal kiln (black charcoal). Agglomerated charcoal is classified into agglomerated charcoal with charcoal powder, agglomerated charcoal with sawdust, and ignition- type of perforated charcoal based on whether a charcoal contains bonding and ignition agents and the way in which the charcoal is agglomerated (National Institute of Forest Science, 2018).
Charcoal and agglomerated charcoal have the advantage of having higher energy density than wood, burning for a long time, and producing less gas (Kabir et al., 2010; Huang et al., 2016). In addition, they can be produced using a variety of raw materials such as bark, sawdust, and coconut shells, and have the advantage of being relatively low in sulfur and mercury content than coal along with easier storage and maintenance (Jelonek et al., 2020; Vicente et al., 2018). Because of these advantages, the charcoal and agglomerated charcoal are widely used in cooking, especially for barbeques where meat is cooked by charcoal fire and consumed in both indoors and outdoors. However, the process of igniting the charcoal and the exhaustfrom the barbecue through high-temperature charcoal fire can degrade the air quality and be absorbed into the food. As a result, consumers are likely to be exposed to pollutants when consuming the meat or breathing (Kabir et al., 2010; Huang et al., 2016).
The ‘Specifications and Quality Standards for Wood Products’ notice specifies fuel characteristics such as moisture content, ash, higher heating value, and fixed carbon as quality items for charcoal and agglomerated charcoal. In addition, since the agglomerated charcoal contains chemical substances such as bonding and ignition agents, five heavy metals such as lead, arsenic, mercury, and cadmium and elements such as chromium, copper, nickel, and sulfur are included in the quality category (Korea Forest Service, 2018). However, the category for the heavy metals indicate the amount of heavy metals in the product before use, and the standards for the type and hazardousness of the combustion gases generated are insufficient, when a consumer uses the product for roasting.
In the results of international studies that analyzed the emissions of charcoal and agglomerated charcoal combustion, it was reported that the concentration of mercury was relatively high in the flue gas from burning charcoal (Pandey et al., 2009), and carcinogenic substances such as formaldehyde, acetaldehyde and some elements were also reported in some products (Huang et al., 2016). In addition, it has been reported that fine particles, carbon monoxide, carbon dioxide, and nitrogen oxides that can enter a human body during the breathing process are continuously generated during the combustion of charcoal (Kabir et al., 2010).
In short, it is judged that there are various gas components produced from the combustion of charcoal and agglomerated charcoal, and these results are anticipated to be crucial supplement data in judging and evaluating the safety of use of the products. However, for the charcoal and agglomerated charcoal products in Korea, systematic data on the types and concentrations of the flue gas produced during such use is still insufficient.
Therefore, in this study, the condition was limited to an occasion which the charcoal and agglomerated charcoal are used for cooking, and the concentration of flue gas during the combustion (CO, CO2, NOx, O2) is measured in real time to compare and analyze the change in the concentration of the gases according to the ventilation volume, considering the environment of restaurants in Korea using charcoal and agglomerated charcoal.
2. MATERIALS and METHODS
In this study, 3 types of charcoal and agglomerated charcoal each, which are widely used in Korea, were purchased, and used as test materials. The charcoals which were used were 2 types; white charcoal (A1, A2) and 1 type of black coal (A3), and for agglomerated charcoal, 1 type of agglomerated charcoal with charcoal powder (B1), 1 type of Ignition-type of perforated charcoal (B2), and 1 type of agglomerated charcoal with sawdust (B3) were used, and Table 1 shows the characteristics of the product at the time of purchase in the product quality labeling.
Proximate analysis as performed to compare the fuel characteristics of the test materials, and the ultimate analysis and higher heating value are measured. Detailed measurement methods can be found in Ju et al. (2020). The higher heating value of the sample was measured using a bomb calorimeter (6400 Automatic Isoperibol Calorimeter, Parr Instrument company, USA), and a powder sample of about 0.5 g was accurately measured and used as the analysis sample.
Proximate analysis was performed using an Thermogravimetric analyzer (PrepASH229, precisa, Swiss) to analyze the moisture content, volatile content, and ash content of the sample, and the fixed carbon was calculated by using Equation (1).
FC: Fixed carbon (%)
MC: Moisture content (%)
VM: Volatile matter (%)
Ash: Ash content (%)
Standard material 2693 (NIST, USA) was used for ultimate analysis, and the contents of carbon, hydrogen, nitrogen, and sulfur were analyzed using an element analyzer (vario MICRO cube elemental analyzer, elementar, Germany), and the oxygen content was calculated by using Equation (2).
O: Oxygen content (%)
C: Carbon content (%)
H: Hydrogen content (%)
N: Nitrogen content (%)
S: Sulfur content (%)
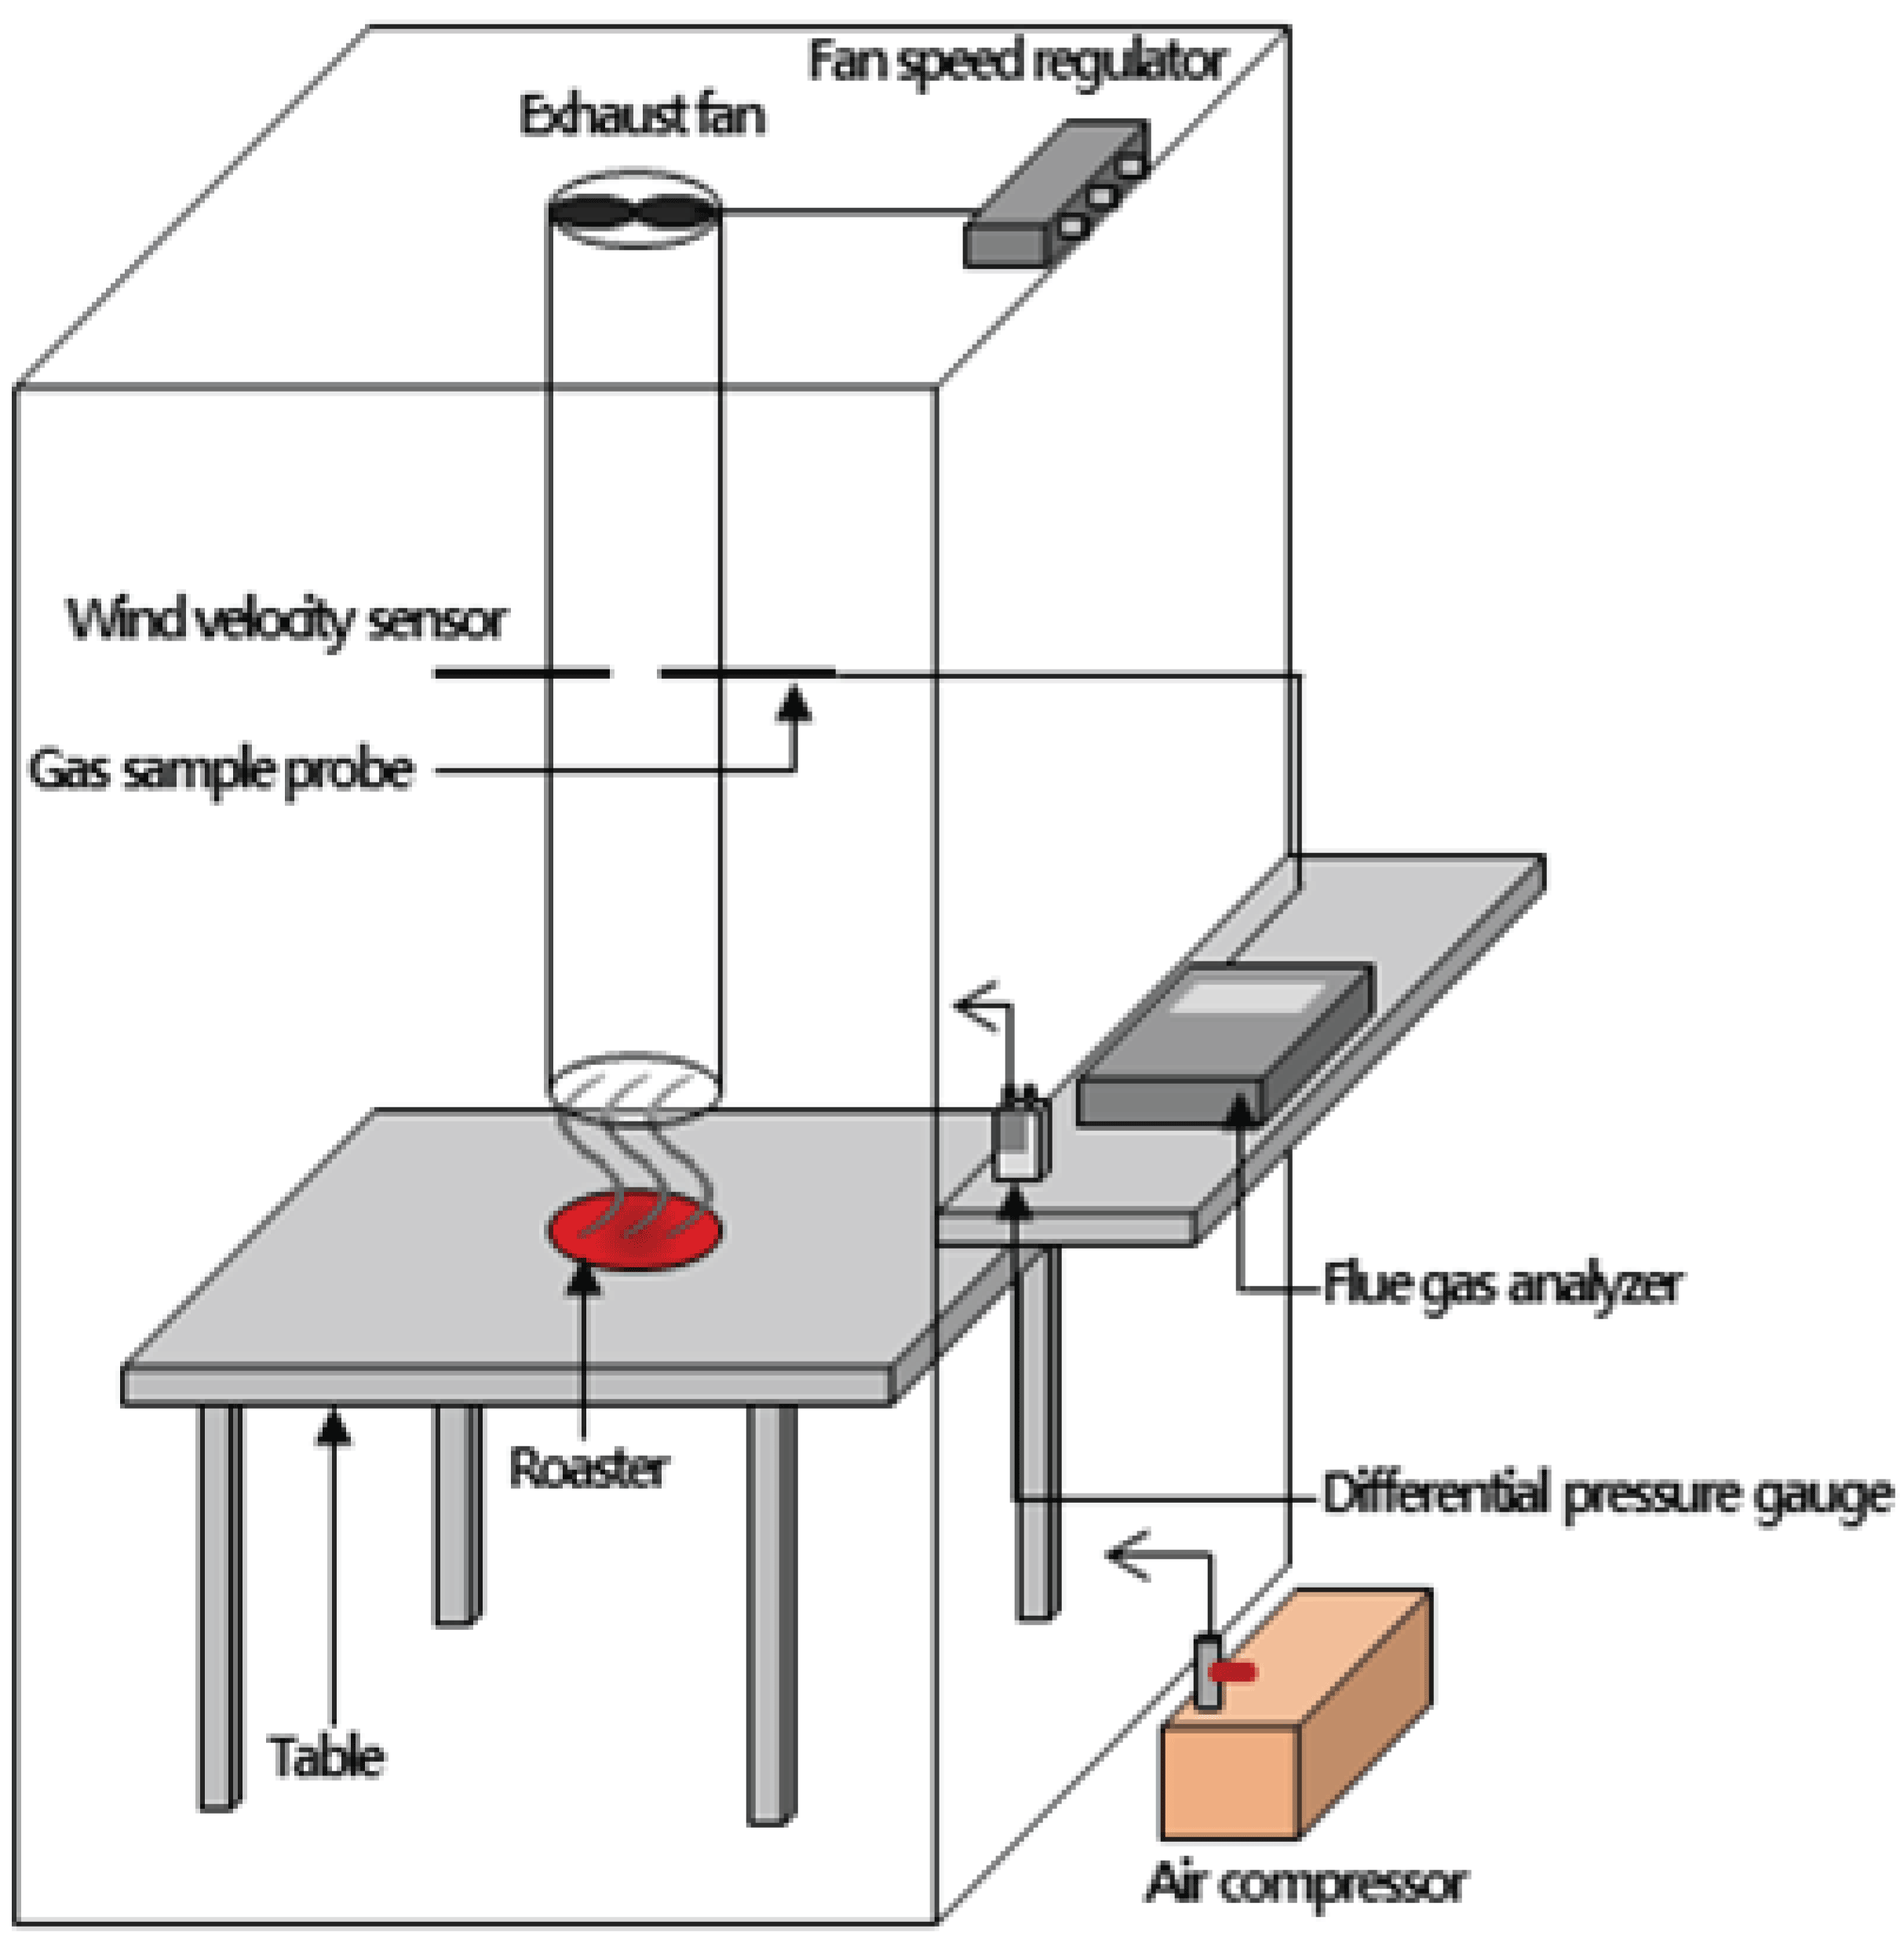
A schematic diagram of a combustion chamber made for the combustion testing of charcoal and agglomerated charcoal is shown in Fig. 1. The combustion combustion chamber was designed as 1.5×1.5×2 m as width×length×height respectively, assuming a table space for 4 people of a typical charcoal restaurant, and the internal volume was about 3.96 m3.
The height of the table is 720 mm, the distance between the roaster and the exhaust port is 120 mm, and the distance between the exhaust port (inner diameter: 95 mm, height: 1 m) and the table is 120 mm. The measuring equipment, an anemometer and gas measurement probe, were installed in the center (height direction) of the exhaust port, and a ventilation fan was installed at the top of the exhaust port, and the speed of the ventilation fan was adjusted through a fan speed controller.
The exhaust velocity measured by the gas measurement probe was 0.3 m/s, and the air volume was 0.008 m3/s. When the ventilation fan was operated, external air was constantly introduced into the air compressor at a rate of 25 L/min through a 6 mm diameter tube for air circulation inside the model chamber. The gas sampling tube was installed in the center of the combustion chamber, 1 m.
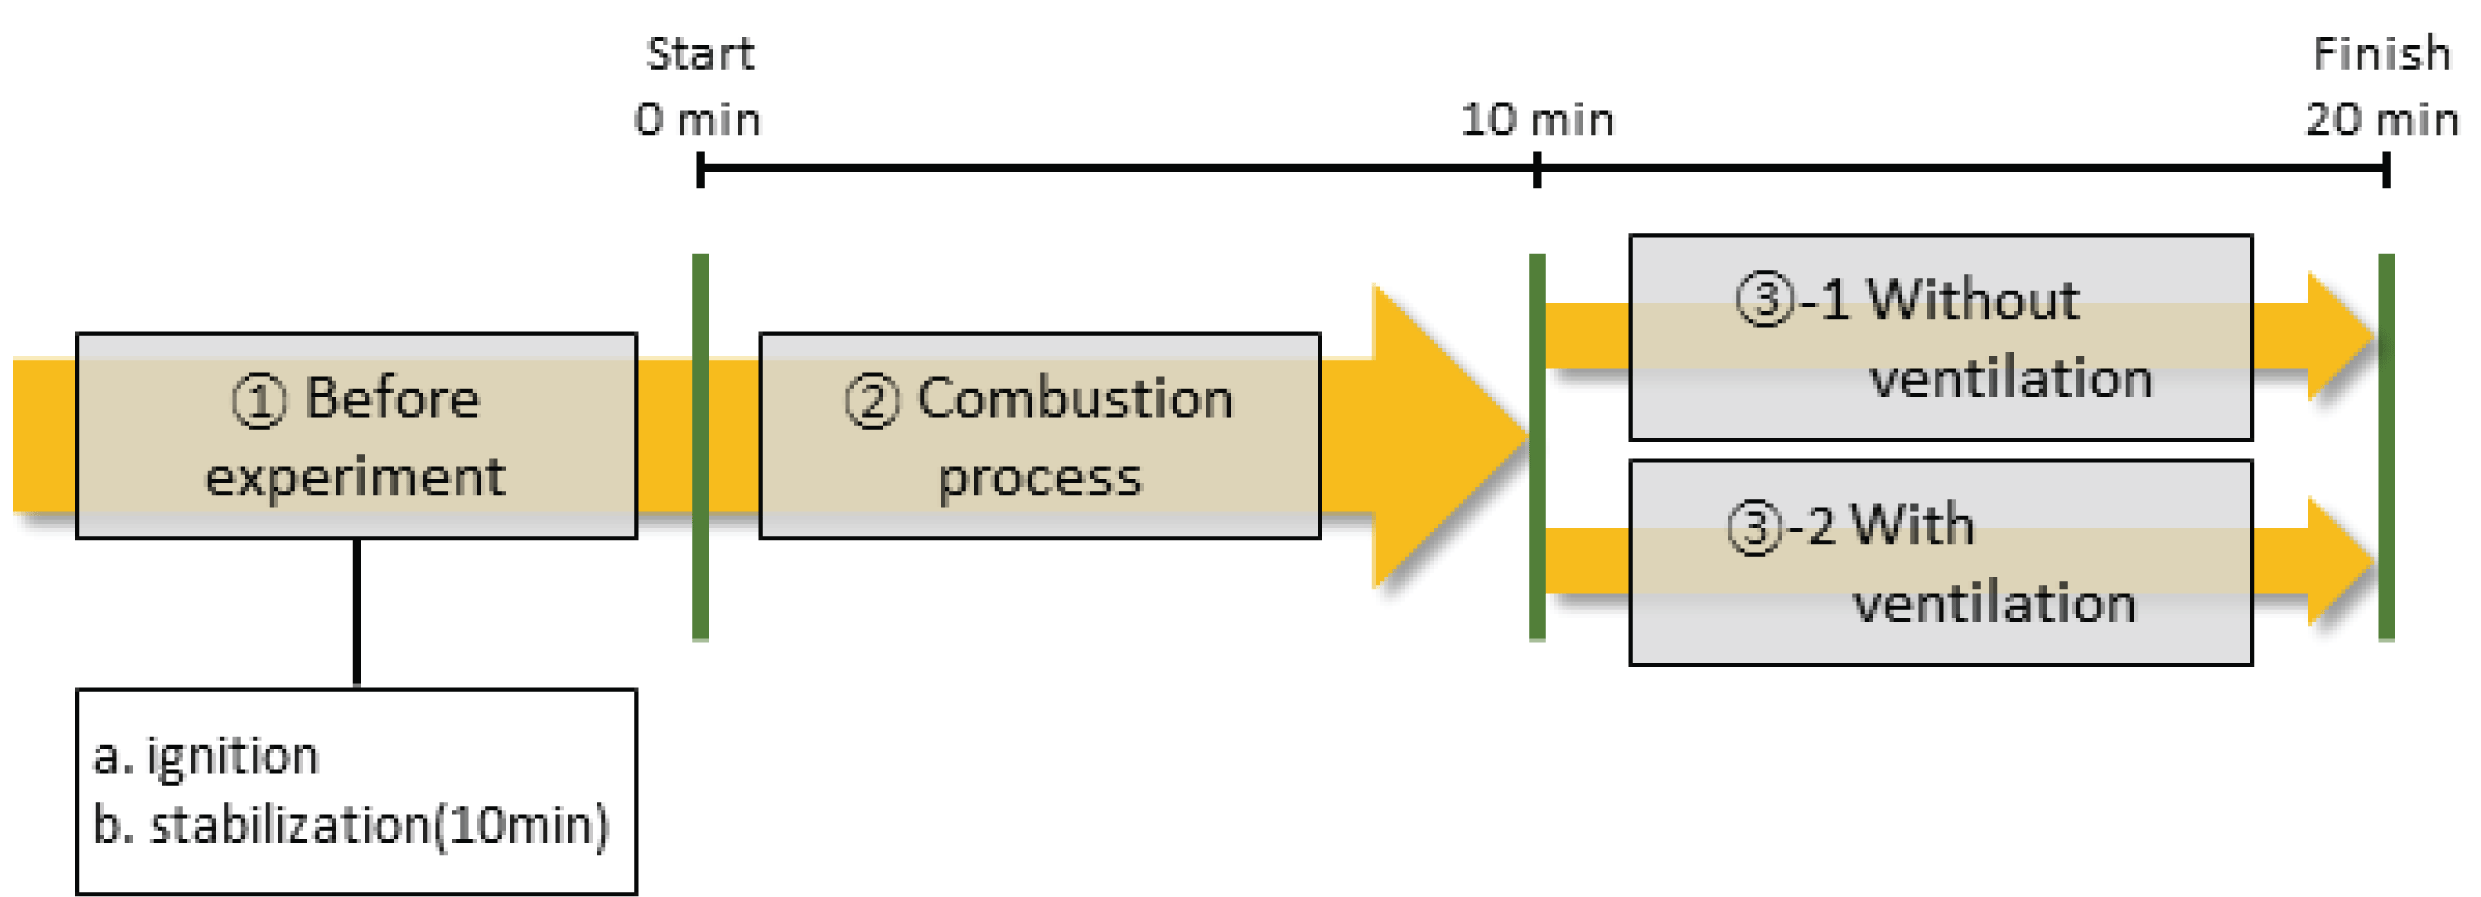
The test process that simulated the environment of a general domestic restaurant using charcoal is shown in Fig. 2. To simulate the situation in which charcoal was ignited by an external igniter and used for roasting, the test sample was first ignited outside the model chamber and then burned for 10 minutes (Fig. 2 ➀).
After that, the test sample was put into the model chamber and sealed, and the gas emissions and temperature were measured. First, the sample was burned for 10 minutes to accumulate flue gas inside the combustion chamber (Fig. 2 ➁). Second, the change in the concentration of exhaust gas with ventilation was measured for 10 minutes with two cases; with and without the ventilation (Fig. 2 ➂-1, 2). After the end of the test, the weight of the test sample, which was burned for 30 minutes, was measured, and the weight of the remaining residue after spontaneous combustion in the atmosphere was measured.
The real-time emissions of exhaust gas generated from the combustion of charcoal and agglomerated charcoal were measured using a flue gas analyzer (Testo 350XL, Testo, Germany). A gas measurement probe installed in the center of the exhaust port was used to measure the yield of CO, CO2, NOx, and O2 at intervals of 15 seconds for 20 minutes.
3. RESULTS and DISCUSSION
The results of analyzing the fuel characteristics of charcoal and agglomerated charcoal are shown in Table 2. As a result of the proximate analysis, in terms of moisture content, charcoal products A1~A3 were 0.9~1.9%, and agglomerated charcoal products B1~B3 were 2.6~3.0%, which all met the standard of Annex 14 (agglomerated charcoal) and Annex 15 (charcoal) of ‘Specifications and Quality Standards for Wood Products’, Notice No. 2018-8 by National institute of forest science (National institute of forest science, 2018). Volatile compounds showed the highest level with 43.3% in B1 and the lowest with 5.4% in A2. As for the ash content, B2 was 39.3%, which was 22.7% higher than the quality standard of 17% of Ignition-type of perforated charcoal, which did not satisfy the quality standard. Such a result may be attributed to the fact that substances which can degrade quality such as soil are included during a raw material processing (Ju et al., 2020; Jeoung et al., 2020). On the other hand, all other products showed results that satisfied the quality standard. In the case of charcoal, there was no quality standard for the fixed carbon content, and A1, A2, and A3 showed 86.0%, 90.4%, and 57.7%, respectively.
In the case of the agglomerated charcoal, B1 and B3 satisfied the quality standard, but B2 was at 26.8%, which was 23.2% lower than the quality standard. Based on a result of ultimate analysis, the carbon content was the highest with 97.4% in A2 and the lowest with 40.6% in B2, and as carbon content increased, the hydrogen, nitrogen and oxygen content decreased. In previous studies, it was reported that hydrogen and oxygen level decreased as carbon in charcoal increased (Jo et al., 2007; Lee et al., 2010). On the contrary, it showed a proportional relationship with the higher heating value, because C-C bonding of high bonding energy increases with the degree of carbonization (Lee et al., 2016).
In case of sulfur, the sulfur content was 0.01% and 0.05% in A2 and B2, respectively. For the higher heating value, B2 did not satisfy the quality standard of 5,500 kcal/kg, similar to the case of Ash and fixed carbon.
The combustion characteristics performed in the chamber according to the ventilation are shown in Table 3. The ignition time was different depending on the type of charcoal and agglomerated charcoal, ventilation, and an igniting agent. On average, the charcoals (A1, A2, A3) showed a longer ignition time than the agglomerated charcoal, which may be attributed to a lack of low molecular compounds that are pronefor ignition due to low volatile compounds (Chia et al., 2014). In particular, among the agglomerated charcoal, the ignition time was the shortest at 3 minutes for B1 and B2 with igniting agents added. However, in the case of B3 without the igniting agent, the ignition time was 15 minutes, which was about 5 times longer than that of B1 and B2. As a result, it was confirmed that the ignition performance of the agglomerated charcoal was greatly improved by the igniting agent.
When the agglomerated charcoal and charcoal were burned without ventilation, the content of volatile matter was relatively higher than that with ventilation in all samples except for the case of B2. In particular, in the case of B1, the content of volatile matter was the highest in both with and without ventilation; 68.9% and 67.8%, respectively. After leaving it in the atmosphere environment, the content of the residue after combustion was generally high without ventilation, but the tendency was different for some products. It is considered that the possibility of incomplete combustion increases as oxygen supply required for combustion is limited without ventilation, and accordingly, the amount of residues after the combustion has increased compared to the ventilated condition. The lowest residual content was 6.1% and 3.2% respectively in A1 and A3 with ventilation.
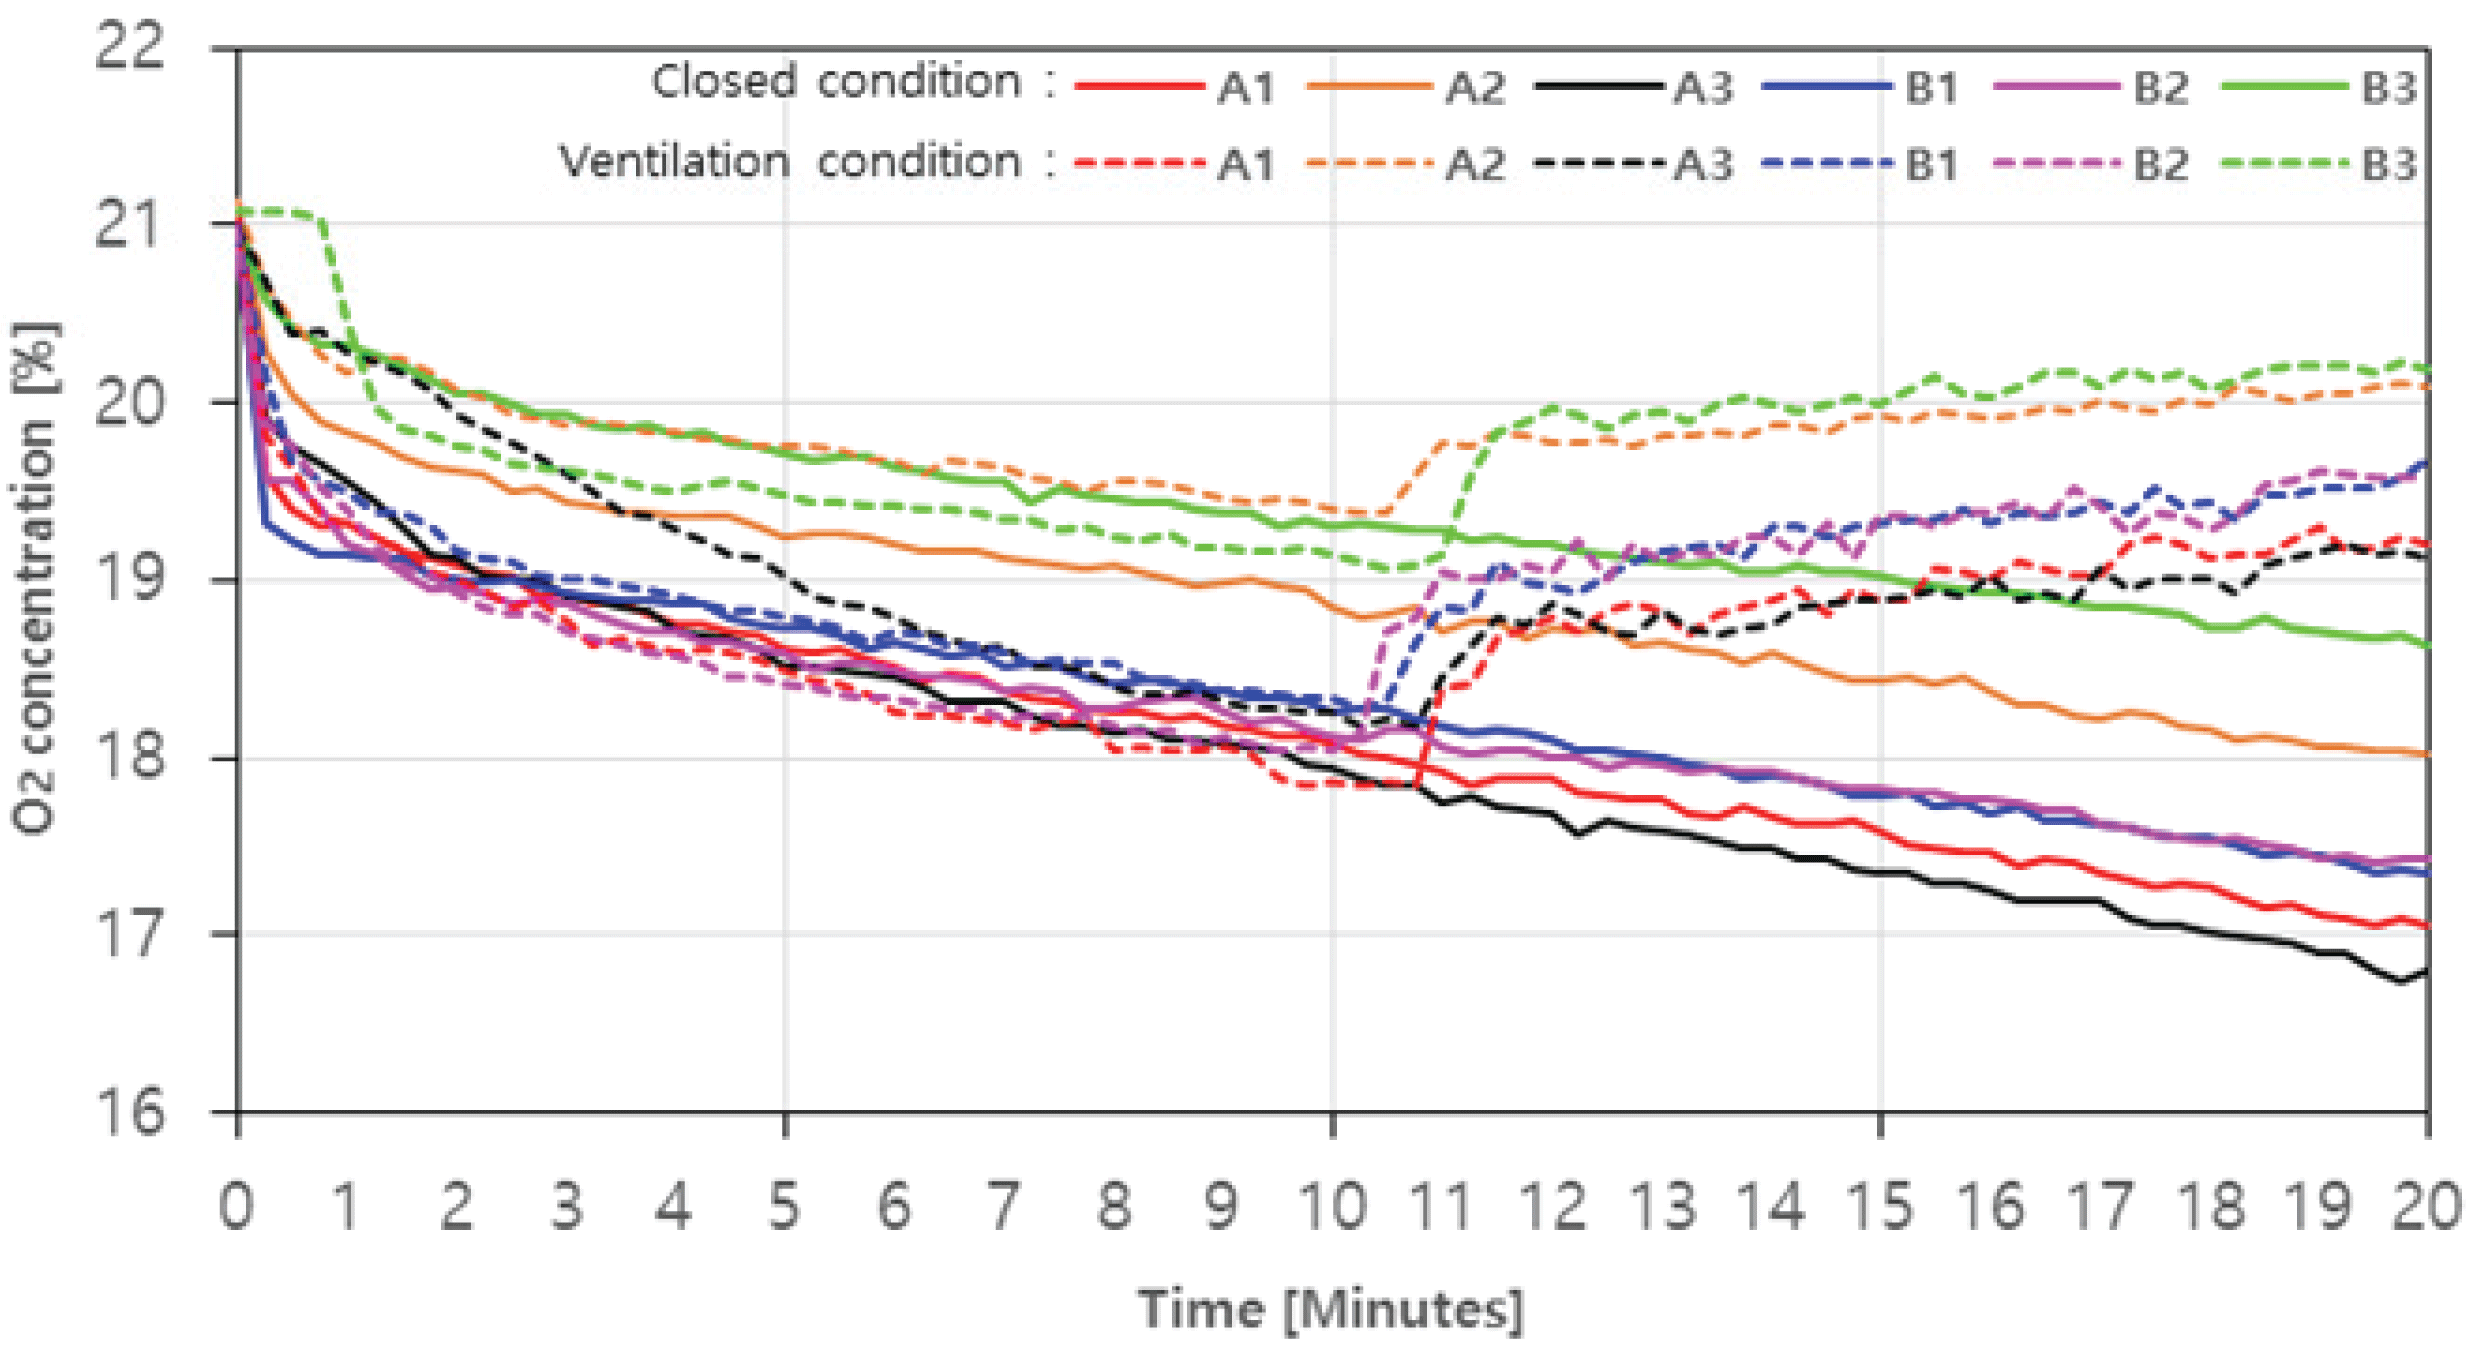
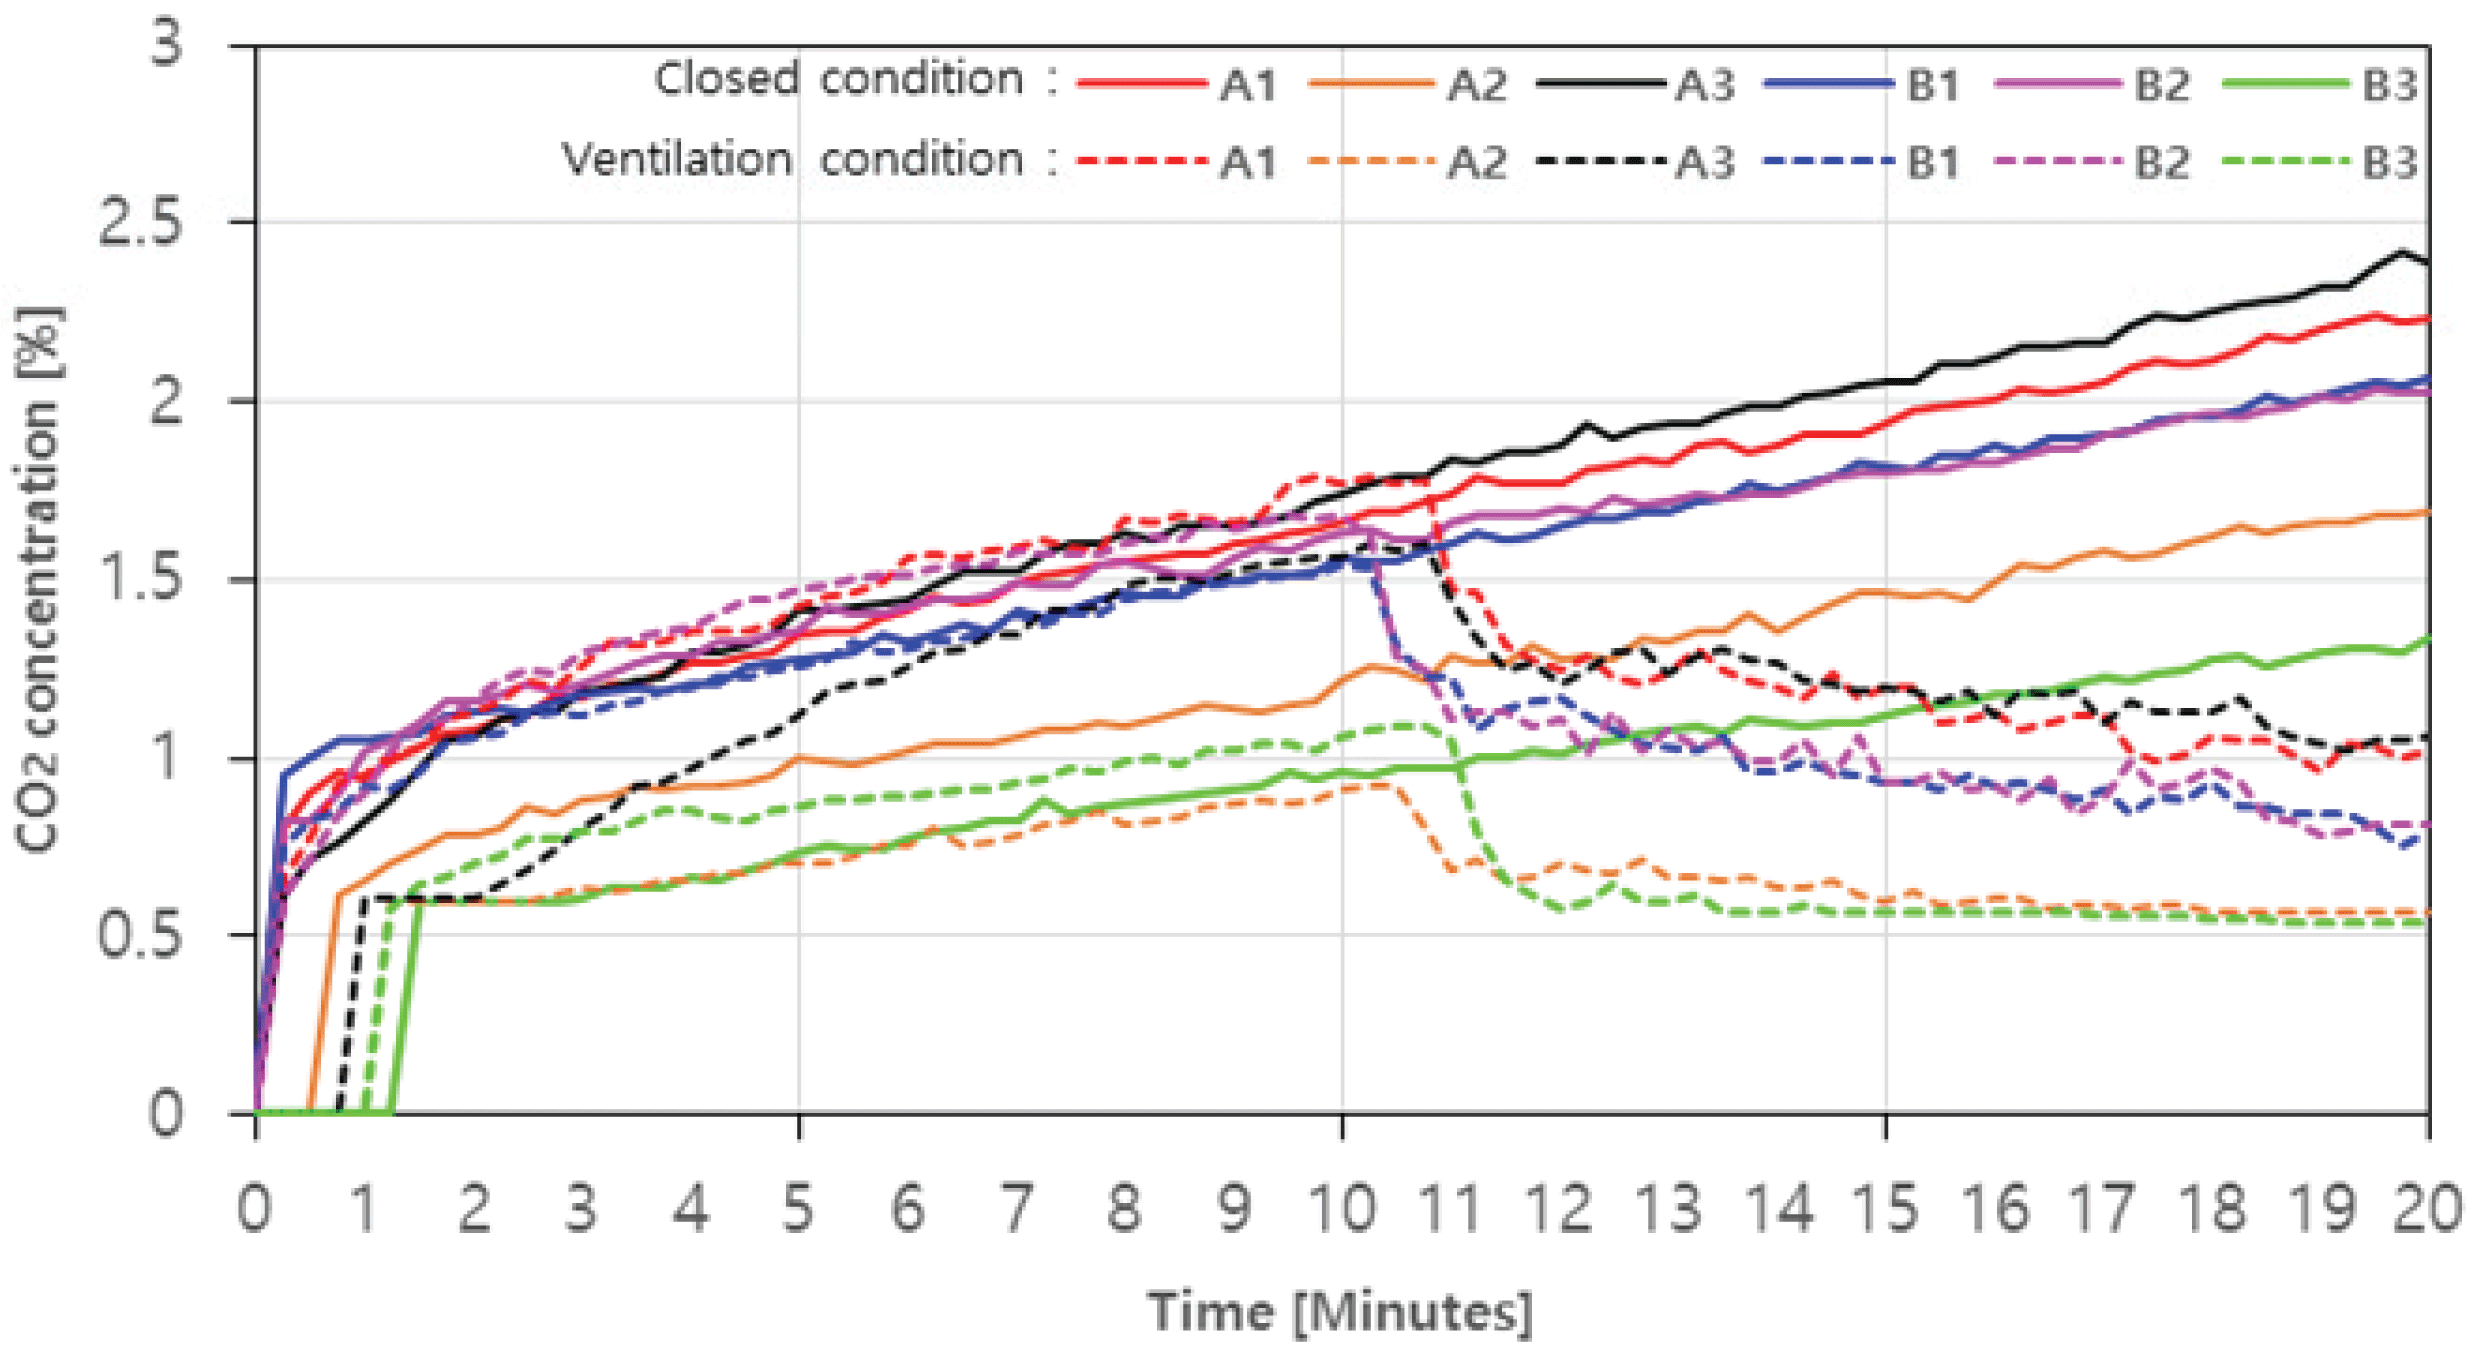
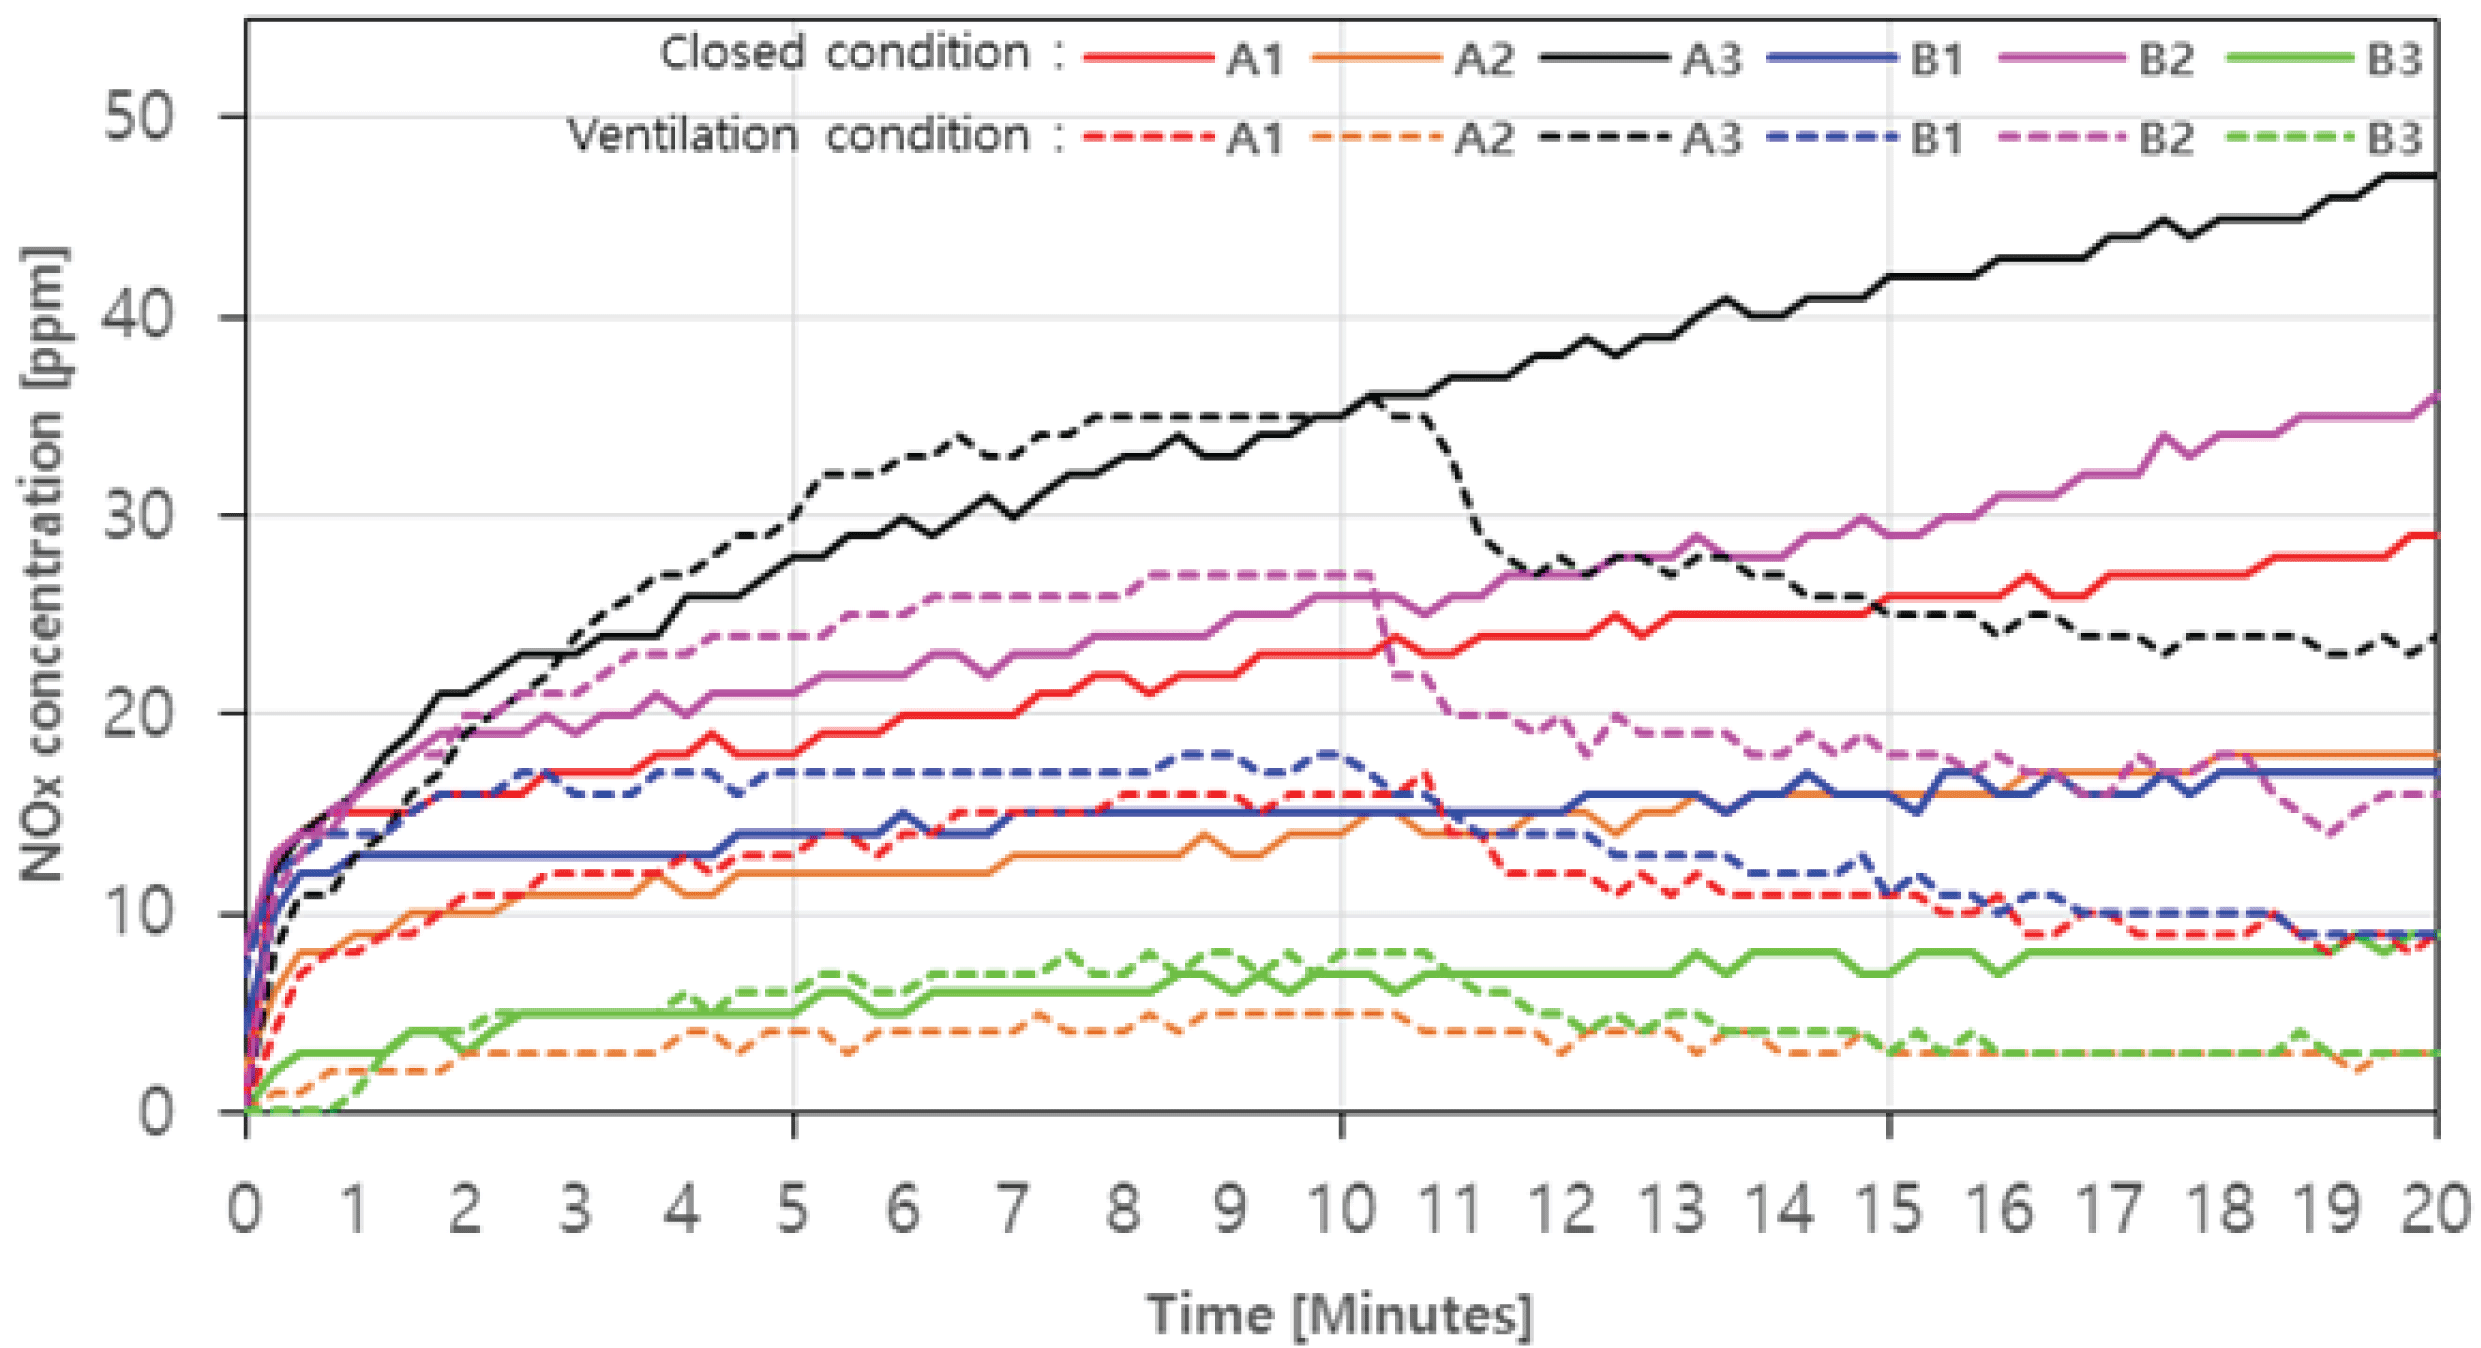
The results of measuring the concentrations of CO, CO2, NOx, and O2 emitted through the combustion of charcoal and agglomerated charcoal in real time are shown in Fig. 3, 4, 5, and 6, and the hazard criteria of each CO and NOx are shown in Table 4. The concentration level of O2 without ventilation is shown in Fig. 3 as a solidline. On average, it decreased from 21.04% (0 minute) to 17.5%. It continued to decrease over time from the beginning, and at 20 minutes, A1, A2, A3, B1, B2, and B3 decreased by up to 18.8%, 14.8%, 20.0%, 17.8%, 17.0%, and 11.4%, respectively (Fig. 3). The O2 concentration level with ventilation is shown in Fig. 3 as a solid line. The O2 concentration level rapidly increased after the ventilation fan was operated, and the level was recovered to 91.2~96.0% of the initial concentration within this experiment range.
| Air pollutant | Facility of air pollutant | Effluent quality standard |
|---|---|---|
| CO | Facility of using biomass of wood pellet | less than 200 ppm |
| NOx | Facility of using biomass of wood pellet | less than 90 ppm |
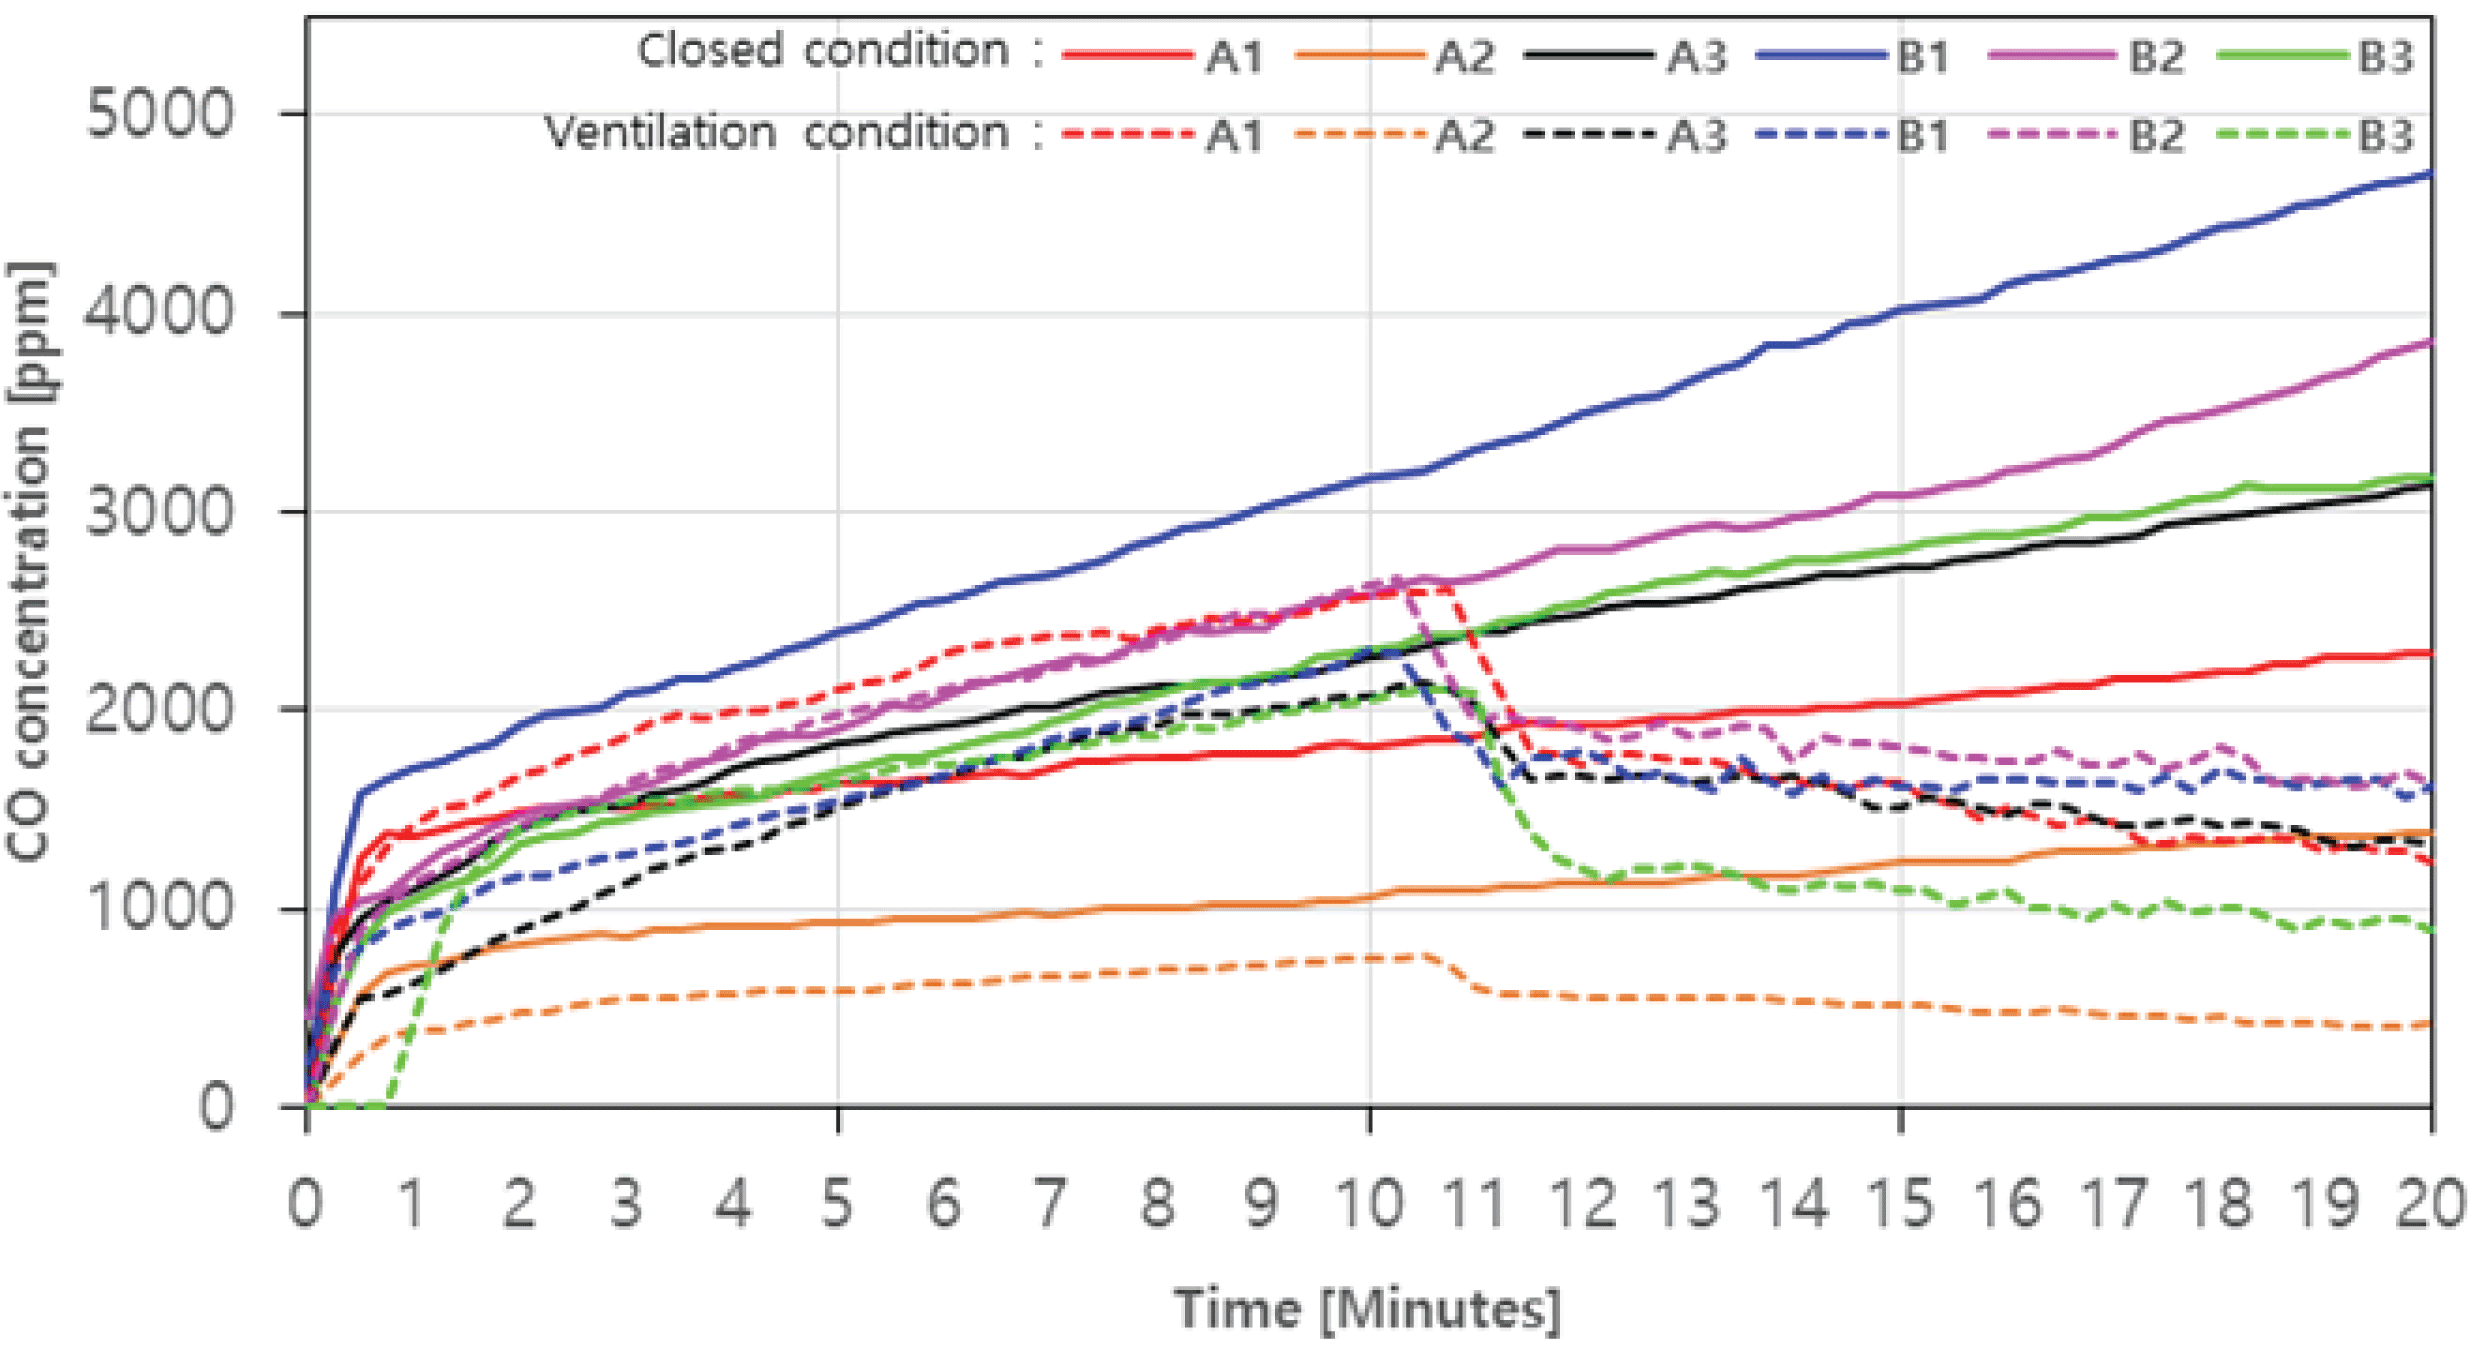
For CO, the concentration without ventilation is shown in Fig. 4 as a solid line. The concentration level showed a tendency to continuously increase as the combustion time elapsed. The agglomerated charcoal (B1, B2, B3) showed relatively higher CO concentration level than the charcoal during the combustion. Especially, B1 showed the highest level of 4703 ppm (20 minutes) among the agglomerated charcoal, and 1390 ppm, the lowest in A2 among the charcoals.
In case with ventialtion, the concentration level of CO decreased rapidly after 10 minutes, which was the starting point of the ventilation fan operation, and then gradually decreased in all samples (Fig. 4. dotted line). It is assumed that as the amount of CO produced decreased as the concentrated CO in the combustion chamber was vented out, and a complete combustion occurred with the inflowed air over time.
Particularly, in the case of B3, the maximum reduction rate (about 57.4%) was shown as the CO concentration level decreased from 2102 ppm to 896 ppm with ventilation, while the reduction of B1 was the lowest at 29.8%. In addition, the average CO concentration was 3092.7 ppm (20 minutes) in closed condition and 1189.2 ppm (20 minutes) with ventilation, which did not satisfy the emission limit of 200 ppm. This indicates that when using charcoal and agglomerated charcoal, a ventilated space is required rather than a closed space, and ventilation should be used with a ventilation volume higher than 0.008 m3/s.
In the case of CO2, the concentration was in the low range of 2.5% or less, but both with and without ventilation were similar to the trend of CO concentration level change (Fig. 5). In case with ventialtion, CO2 production amount of A1, A2, A3, B1, B2, and B3 was 2.23%, 1.69%, 2.42%, 2.07%, 2.03% and 1.34%, respectively (Fig. 5. Solid line), which were proportional to the aforementioned decrease in O2 concentration level. In previous studies, it was reported that the inverse proportion of CO2 generation level and O2 concentration level increased the rate of complete combustion (Choi et al., 2015). Looking at the trend with ventilation, in the case of A1, A3, B1, and B2 where CO2 generation amount was more than about 1.5% at 10 minutes, reduction rates were up to 44.1%, 50.0%, 51.3%, and 53.6% after the ventilation fan was operated (Fig. 5. Dotted line). On the other hand, A2 and B3, in which CO2 generation amount was around 1%, gradually decreased after 12 minutes and then remained constant at about 0.5%. Similar to the aforementioned trend of CO, such a result may be caused by the phenomenon that the rate of complete combustion increased due to the inflow air.
In the case with ventilation, the amount of NOx increased rapidly in all samples until the initial 1 minute. Even after 1 minute, the NOx generation amount of A1, A3, and B2 showed a tendency to increase continuously to a maximum of 29 ppm (20 minutes), 47 ppm (20 minutes), and 36 ppm (20 minutes), respectively (Fig. 6. Solid line). It is judged that the incomplete combustion continues during the combustion process of A1, A3, and B2 (Jeoung et al., 2020). On the other hand, the amount of NOx generated in A2, B1, and B3 appeared relatively constant after 1 minute, with a maximum of 18 ppm (20 minutes), 17 ppm (20 minutes), and 9 ppm (20 minutes), respectively. In the case with ventilation of A1, A3, and B2, the amount of NOx generated continues to increase, similar to the closed condition, showing a maximum of 17 ppm (10 minutes), 35 ppm (10 minutes), and 27 ppm (10 minutes), respectively, and after the ventilation fan was turned on, the reduction rates were up to about 47.1%, 31.4%, and 40.7% (Fig. 6. Dotted line). According to Feng et al. (2010), the higher air inflow in fuel combustion can lower the ratio of NOx. In the case of A2, B1, and B3, the case without ventilation were similar, and the reduction rates were up to about 40.0%, 50.0% and 62.5%. The amount of NOx generated, on average, was 26.0 ppm (20 minutes) without ventilation and 10.7 ppm (20 minutes) with ventilation, which was lower than 90 ppm, which is the emission limit, satisfying the emission limit.
4. CONCLUSION
In this study, the characteristics of fuel were analyzed for the charcoal and agglomerated charcoal available in Korea. A model space that simulated the usage environment was created to measure the amount of flue gas generated during the combustion and to evaluate the ventilation rate by classifying it into the closed conditions and ventilated conditions. As a result of analyzing the fuel characteristics of the charcoal (A1, A2, and A3) and the agglomerated charcoal (B1, B2, and B3), all charcoal products satisfied the quality standard, but the agglomerated charcoal product B2 did not satisfy the quality standard. With the combustion characteristics of closed and ventilated conditions, the charcoal (A1, A2, and A3) had a longer ignition time than the agglomerated charcoal (B1, B2, and B3). In particular, for the ignition time of B1 and B2 containing igniting agents in the agglomerated charcoal, it was confirmed that the agent greatly shortened the time. In addition, in most of the samples, the content of volatile substances was higher in the closed condition than in the ventilated condition.
As a result of the comparison of the flue gas generation, consisted of CO, CO2, NOx, and O2, the concentration of O2 continued to decrease without ventilation, and recovered to about 91.2~96.0% of the initial O2 concentration level with ventilation. In the case of CO, the concentration wasin the range of 1390 to 4703 ppm with ventilation. In the case with ventilation, it was confirmed that the concentration of CO dropped rapidly after the ventilation fan was turned on, and then gradually decreased due to the equilibrium between the amount of CO production and the amount of ventilation.
The amount of CO2 generated was similar to that of CO generated in both with and without ventilation, which was inversely proportional to the amount of O2 generated. In the case of NOx, the amount of flue gas generated in a sample that continued incomplete combustion increased steadily, but the amount of flue gas for the samples with complete combustion showed a constant amount.
Based on the result obtained through this study, the amount of ventilation and the amount of flue gas generated through combustion in a specific space, the amount of ventilation required for cooking food using charcoal and agglomerated charcoal in the future can be identified and can be utilized as basic data for health hazard evaluation.


