1. INTRODUCTION
Interest in reducing greenhouse gas emissions is rising around the world to prevent global warming and climate change. And policies including reduced use of fossil fuels have been proposed as a plan to reduce greenhouse gases (Forsberg et al., 2004; Frank et al., 2005). Since an agreement regarding a new climate regime was adopted at the 21st Conference of the Parties of the UNFCCC for the Paris Agreement in December 2015, most of the participating countries have proposed voluntary greenhouse gas emissions targets; the Republic of Korea has proposed to reduce greenhouse gas emission by 37% below Business As Usual (BAU) levels by 2030 (IPCC, 2007; Kim et al., 2013).
The government of South Korea announced 2030 Expansion Strategies for New Energy Industries in November 2015 to participate in global efforts to achieve greenhouse gas emissions targets and to actively respond to the paradigm shift in the global energy market (Jeong, 2015).
“Zero-Energy Buildings” has been presented as the business model for the construction sector among the 8 primary new energy business areas. Energy consumed in the buildings sector in Korea constitutes 25% of the total energy, and low energy efficient building systems cost 17 trillion Korean won or more annually (Yu et al., 2015; Jang et al., 2019; Chang et al., 2015). As a result, thermal insulation performance criteria for buildings prescribed in “Energy Saving Design Criteria for Buildings” have become stricter and require a heat transfer coefficient of 0.150 W/m2·K (for multi-family housing, exterior walls, Central 1 Region)(Kim et al., 2015).
Following the change in this criterion, insulation materials or construction materials with low thermal conductivity are gaining increasing attention for their energy saving effects in buildings (Pang et al., 2017). Thermal conductivities of stone, bricks, and concrete are 1–2 W/m·K, 0.4–0.8 W/m·K, and 0.15–2.5 W/m·K, respectively; wood has a thermal conductivity of 0.1–0.2 W/m·K and is known to be the structural material used in construction with the lowest thermal conductivity (Park et al., 2012).
The Intergovernmental Panel on Climate Change (IPCC) has stated that the life expectancy for a reinforced concrete building is 50 years, whereas that of a wood building is 75 years, when climate change is considered. Using mature trees as construction materials and planting new trees where the mature trees are removed can maximize the effects of carbon dioxide reduction in the atmosphere (Kang et al., 2010). Wood is becoming a widely utilized construction material for its carbon fixation effects that reduce greenhouse gases and for its low conductivity that improves the insulation performance of buildings (Kang, et al., 2017; Seo, et al., 2017; Özcan et al., 2019; Jang et al., 2017). Additionally, a previous study has shown that the energy consumption of a building decreases by 7% or more when wood with low thermal conductivity is used as the interior finishing material (Kim, 2013), which confirms that the energy consumption of a building is affected by the type of interior finishing material. While a previous study has investigated energy consumption of a building and indoor combustion characteristics of wooden interior finishing materials (Son et al., 2014), this research aims to compare and analyze the heat transfer characteristics of 3 types of widely used interior finishing materials: mortar cement, wood (low density Paulownia coreana), and medium density fiber board (MDF).
2. MATERIALS and METHODS
3 types of interior finishing materials, i.e., mortar cement, Paulownia coreana, and MDF, were selected and used in this research in order to analyze insulation and heat transfer characteristics in closed conditions made by an acrylic hemisphere. Samples with dimensions 18 mm (thickness) × 200 mm (width) × 200 mm (length) were manufactured, and the properties of the materials are shown in Table 1. Moisture content, density when completely dried, and thermal conductivity were measured and used in this research as basic data.
| Moisture content (%) | Density (g/cm3) | Thermal Conductivity (W/m•K) | |
|---|---|---|---|
| Mortar Cement | 1.46 | 2.19 | 0.157 |
| Paulowni a coreana | 6.87 | 0.26 | 0.067 |
| MDF | 9.16 | 0.53 | 0.328 |
Mortar cement powder was obtained from company H located in Gyeongsangnam-do in the Republic of Korea. A cement product designed for household use that does not require mixing with sand was used in this research. A cement piece with dimensions of 18 mm (thickness) × 200 mm (width) × 200 mm (length) was created using a form with the corresponding dimensions, and it was cured for a week before being used in this research.
The density of Paulownia coreana, hereinafter referred to as Korean paulownia, ranges from 0.15 to 0.3, which is lower than other wood products and is responsible for its low thermal conductivity. Its insulation performance is 1.5 times greater than those of other high-density wood products, and it boasts a very low contraction rate in applications and a high resistance to decay and wood-destroying insects (Moon, 2019). Additional advantages of Korean paulownia include a facile painting process due to the lack of resin. Korean paulownia was selected for its significantly lower density than that of mortar cement and MDF. Glued laminated wood made of Korean paulownia was obtained from a domestic company, W, and cut into an 18 mm (thickness) × 200 mm (width) × 200 mm (length) piece and used in this research.
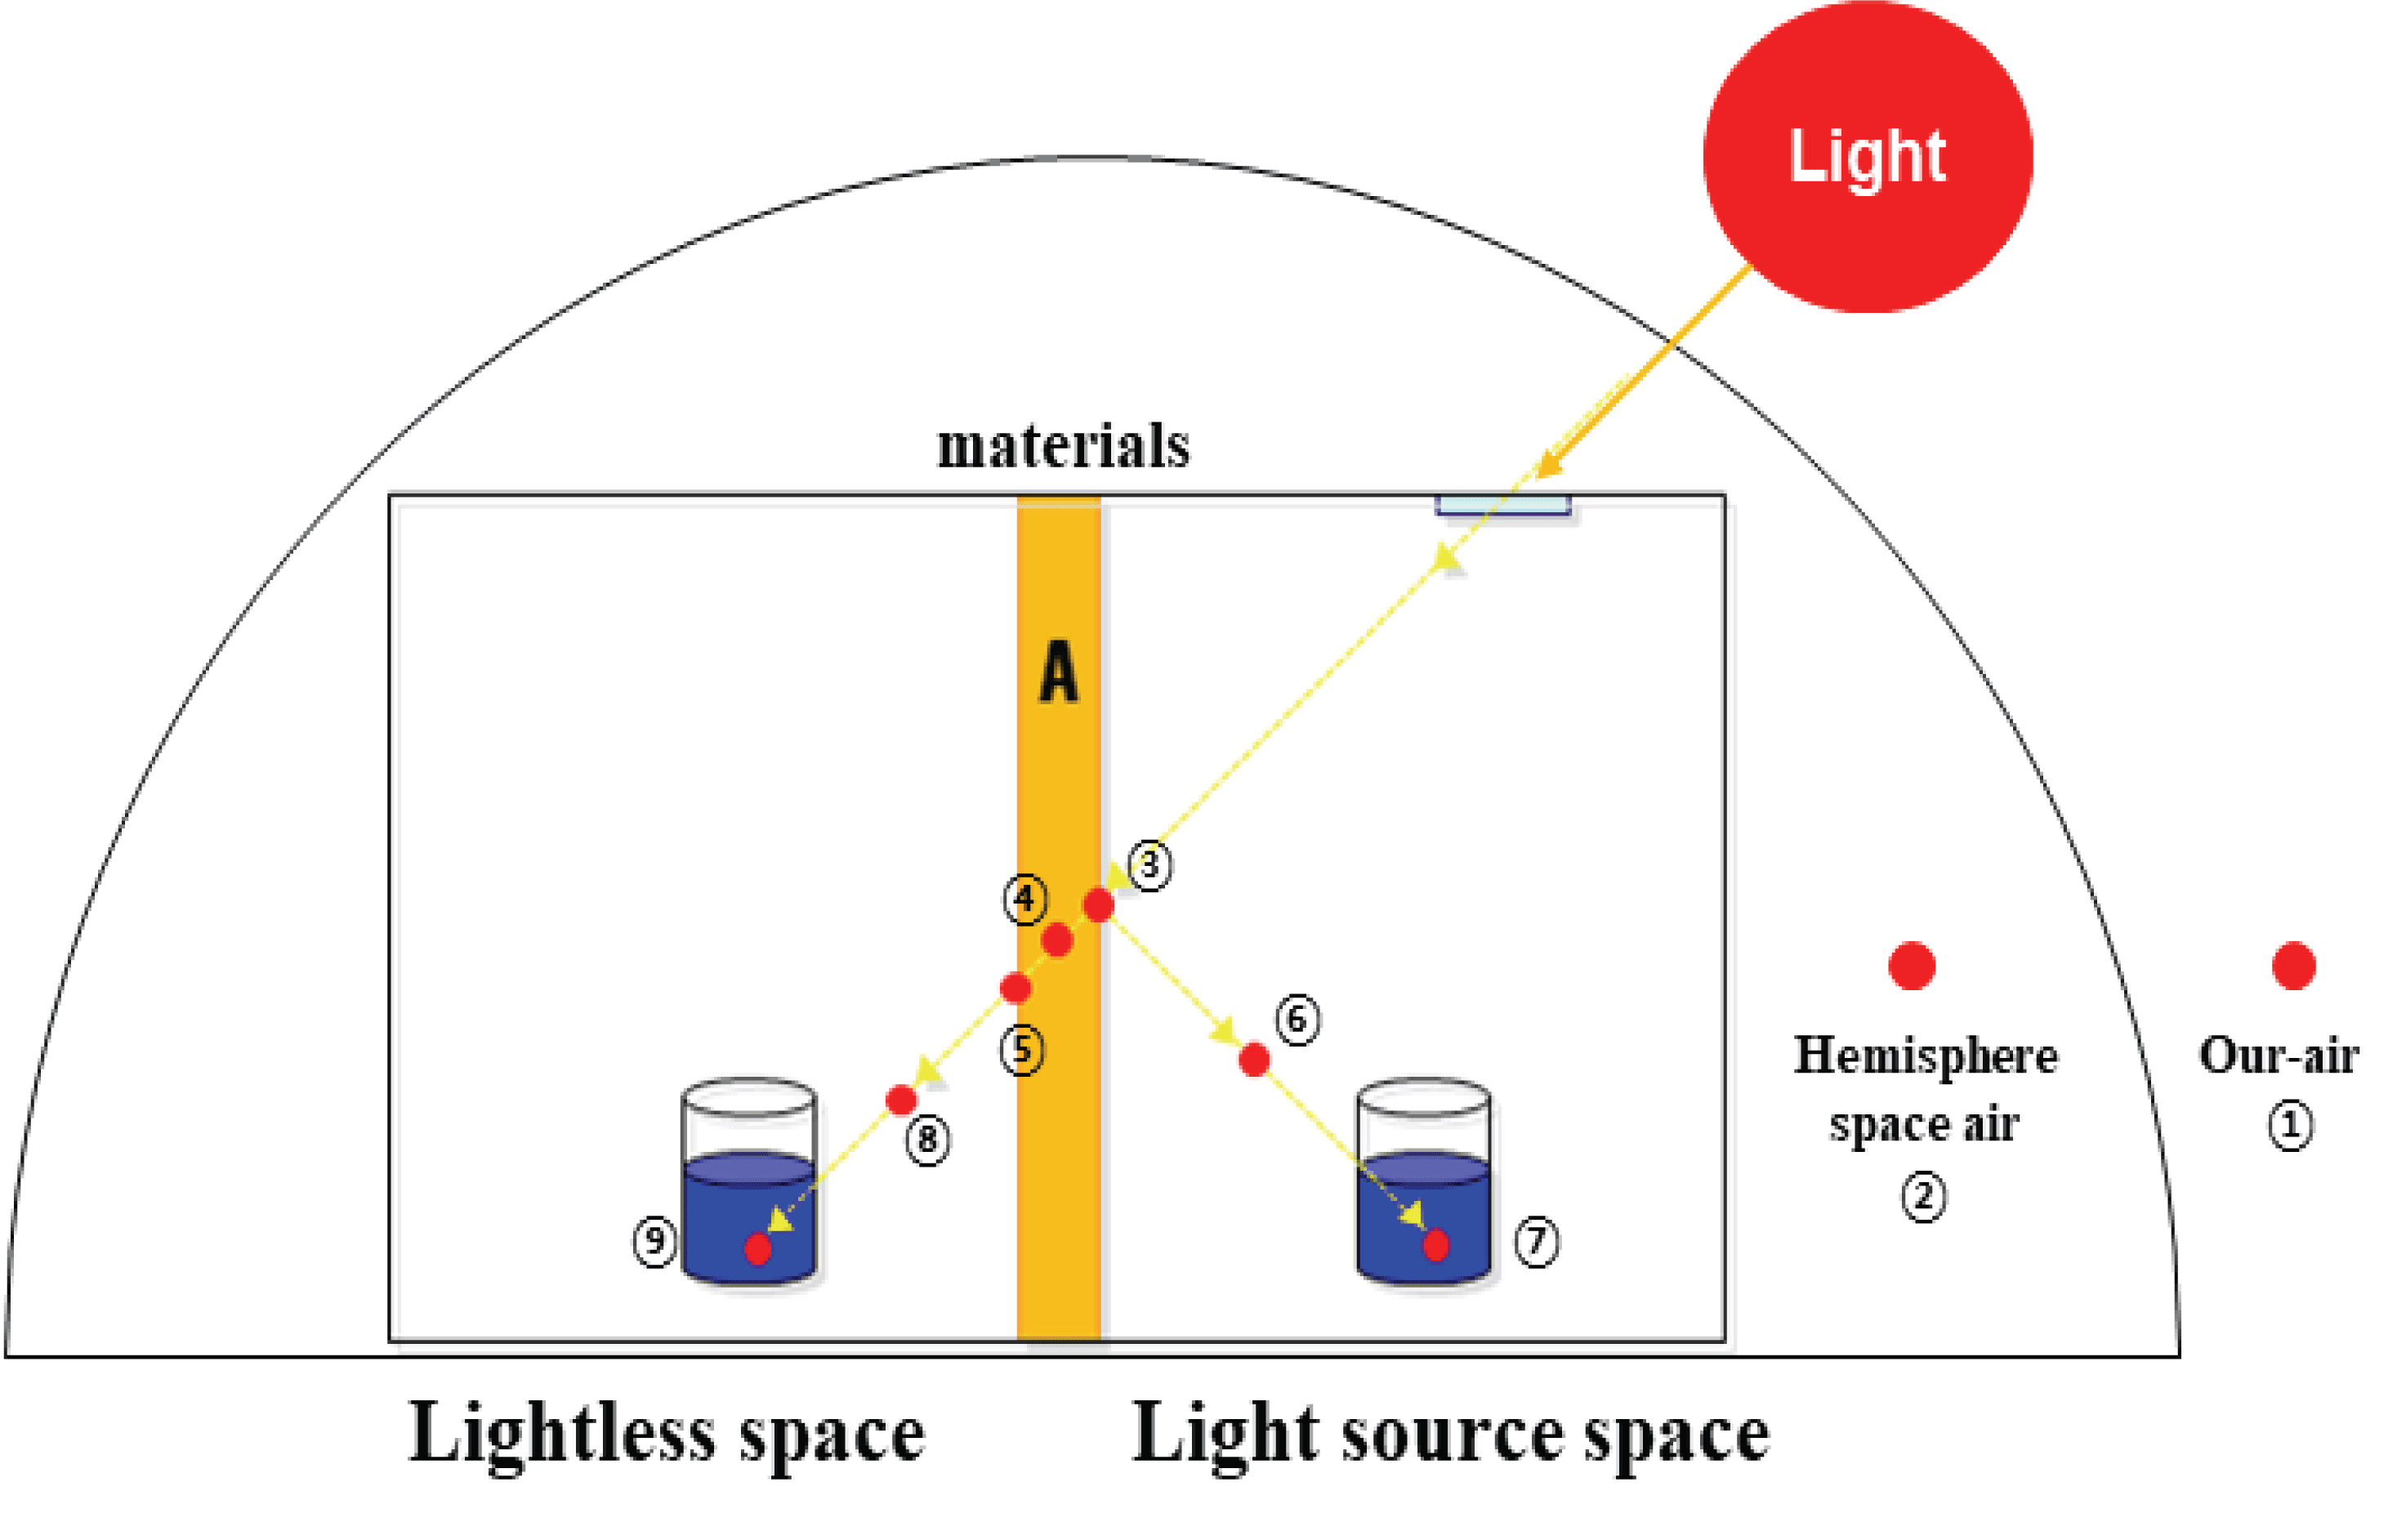
A mock-up was created to analyze heat transfer characteristics of different interior finishing materials. The mock-up contained two compartments: a closed space where the sunlight was the sole light source (hereinafter referred to as “light source space”) and another closed space without a light source where the heat that passed through the interior finishing material was transferred to the indoor air (hereinafter referred to as “lightless space”). An 18 mm (thickness) × 200 mm (width) × 200 mm (length) piece made of mortar cement, MDF, or glued laminated Korean paulownia, manufactured as described in Section 2.1, was installed at the center of a mock-up as shown in Fig. 1 to represent an interior finishing material. Birch plywood with a thickness of 3 mm was used to create a space with dimensions of 200 mm (length) × 200 mm (width) × 200 mm (height) on each side of the interior finishing material. The mock-up was fully enclosed and had overall dimensions of 424 mm (length) × 260 mm (width) × 260 mm (height). A 30 mm × 30 mm square hole was cut on top of the light source space and covered with a 3 mm thick transparent acrylic sheet to allow penetration of sunlight into the space. In order to prevent heat loss through the exterior walls, the birch plywood box was insulated using Isopink compressed Styrofoam with 20 thickness and a polyurethane foam adhesive.
A glass beaker (diameter: 60 mm, height: 70 mm, weight: 63.7 g, and thermal conductivity: 1.022 W/m·°C) containing 200 g of water was sealed with Parafilm and placed in each space. The beakers were positioned at a height of 5 cm above the floor of the mock-up using an insulation material. K-type thermocouple temperature sensors were installed using adhesive tapes in a total of 9 locations as shown in Fig. 1 to measure temperature changes in the mock-up: the outside air (➀), the air inside the dome (➁), a point exposed to the sunlight on the surface of the interior finishing material (➂), the midpoint of the finishing material (➃), a point on the opposite surface of the material along the light path (➄), the air within each space (two locations-➅, ➇), and the water (two locations-➆, ➈). In order to minimize potential effects of the outside air, the mock-up was placed inside a transparent acrylic dome with a diameter of 900 mm and a thickness of 9 mm.
The mock-up was installed outdoors in Chungnam National University such that the light source space faced towards the south. Temperature changes were measured as a function of elapsed time for 2 days, starting from 10 a.m. on September 2, 2018, and measurements were made every 10 minutes using a thermal data logger (BTM-4208SD, Lutron). The amount of heat transferred through the interior material sample via conduction was calculated based on the surface temperatures measured on both sides of the sample; the amount of heat transferred from the sample surface to the air (through conduction, convection, and radiation) was calculated using the equations shown in Table 2 based on the measured temperatures (Lee, et al., 2009).
The convection heat transfer coefficient was calculated according to
The water placed inside the mock-up is to simulate the human body, which is consisted of at least 70% water. Temperature changes in the water based on a function of elapsed time were measured to evaluate the effects on a human body residing inside a building. The heat capacities of water and a glass beaker were calculated using the equation shown below.
m : mass of water and glass beaker
c : heat capacity (water: 4.18 kJ/kg, beaker: 0.84 kJ/kg)
ΔT : temperature change of water and glass beaker
3. RESULTS and DISCUSSION
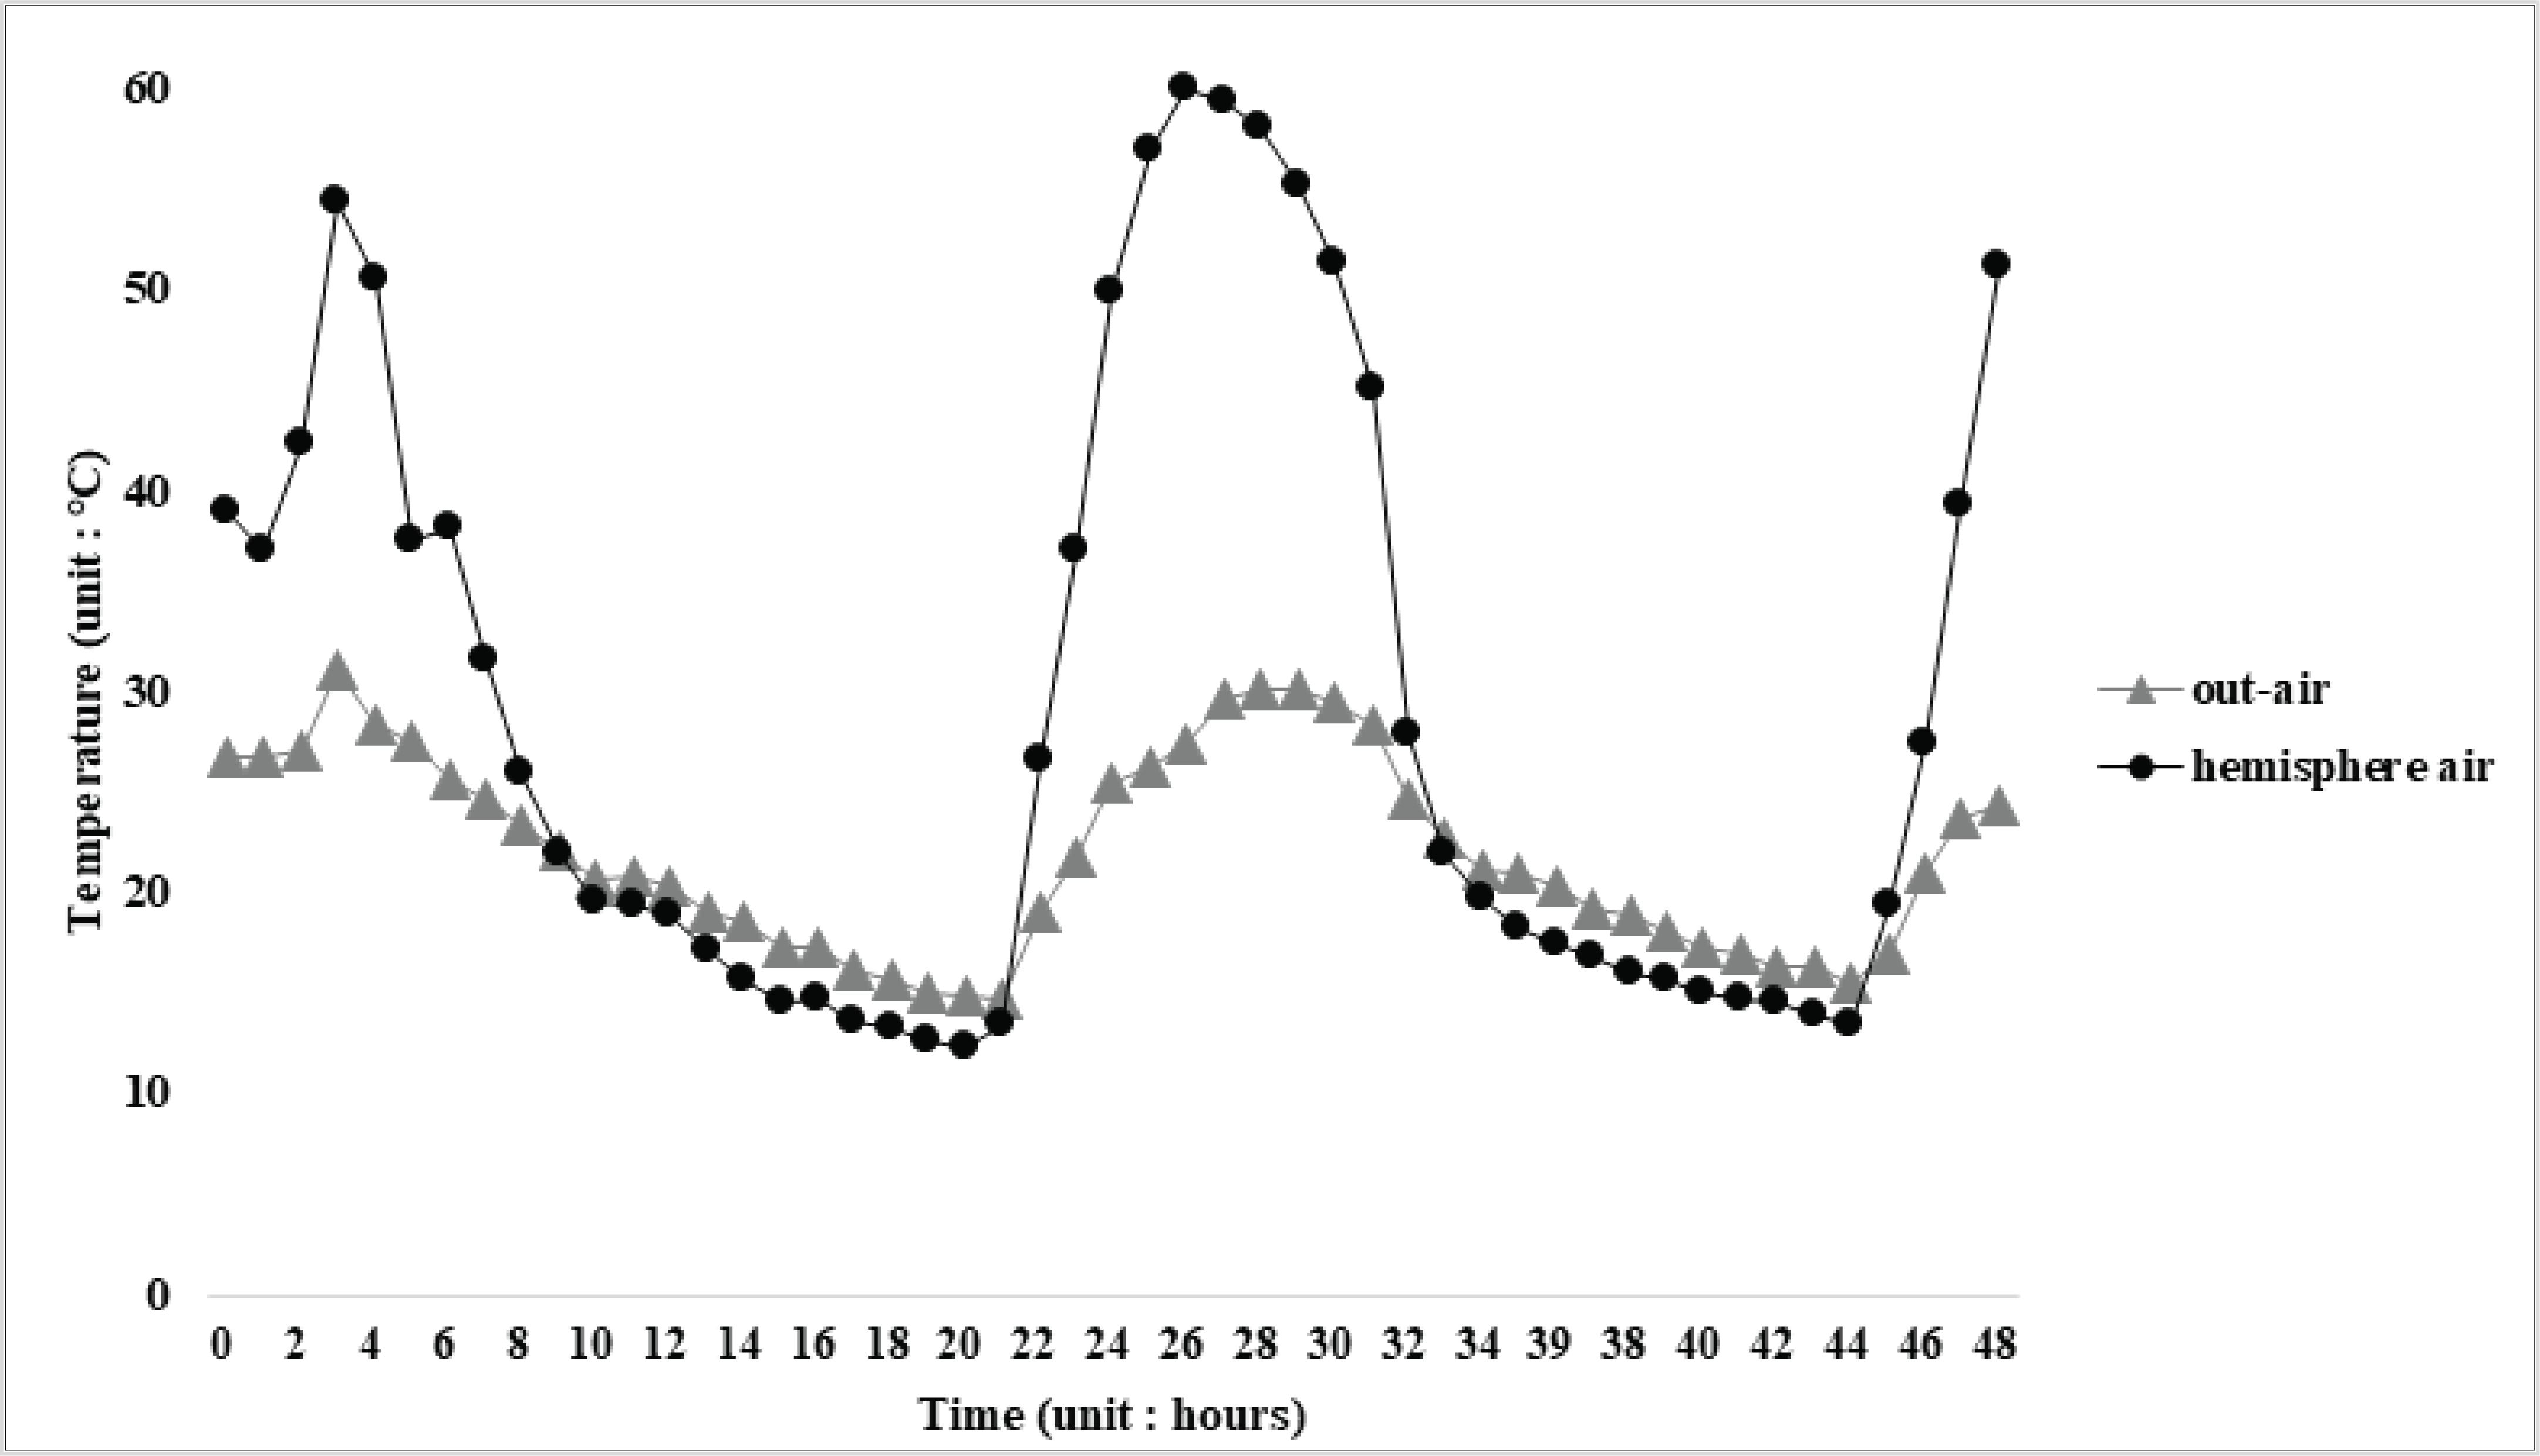
In this research the greenhouse effect is simulated using an acrylic hemisphere, and differences in heat capacities based on the type of interior finishing materials had been made through heat transfer modes and changes in water temperature. The temperatures of the ambient air and the air inside the acrylic dome during the exposure of the mock-up are shown in Fig. 2.
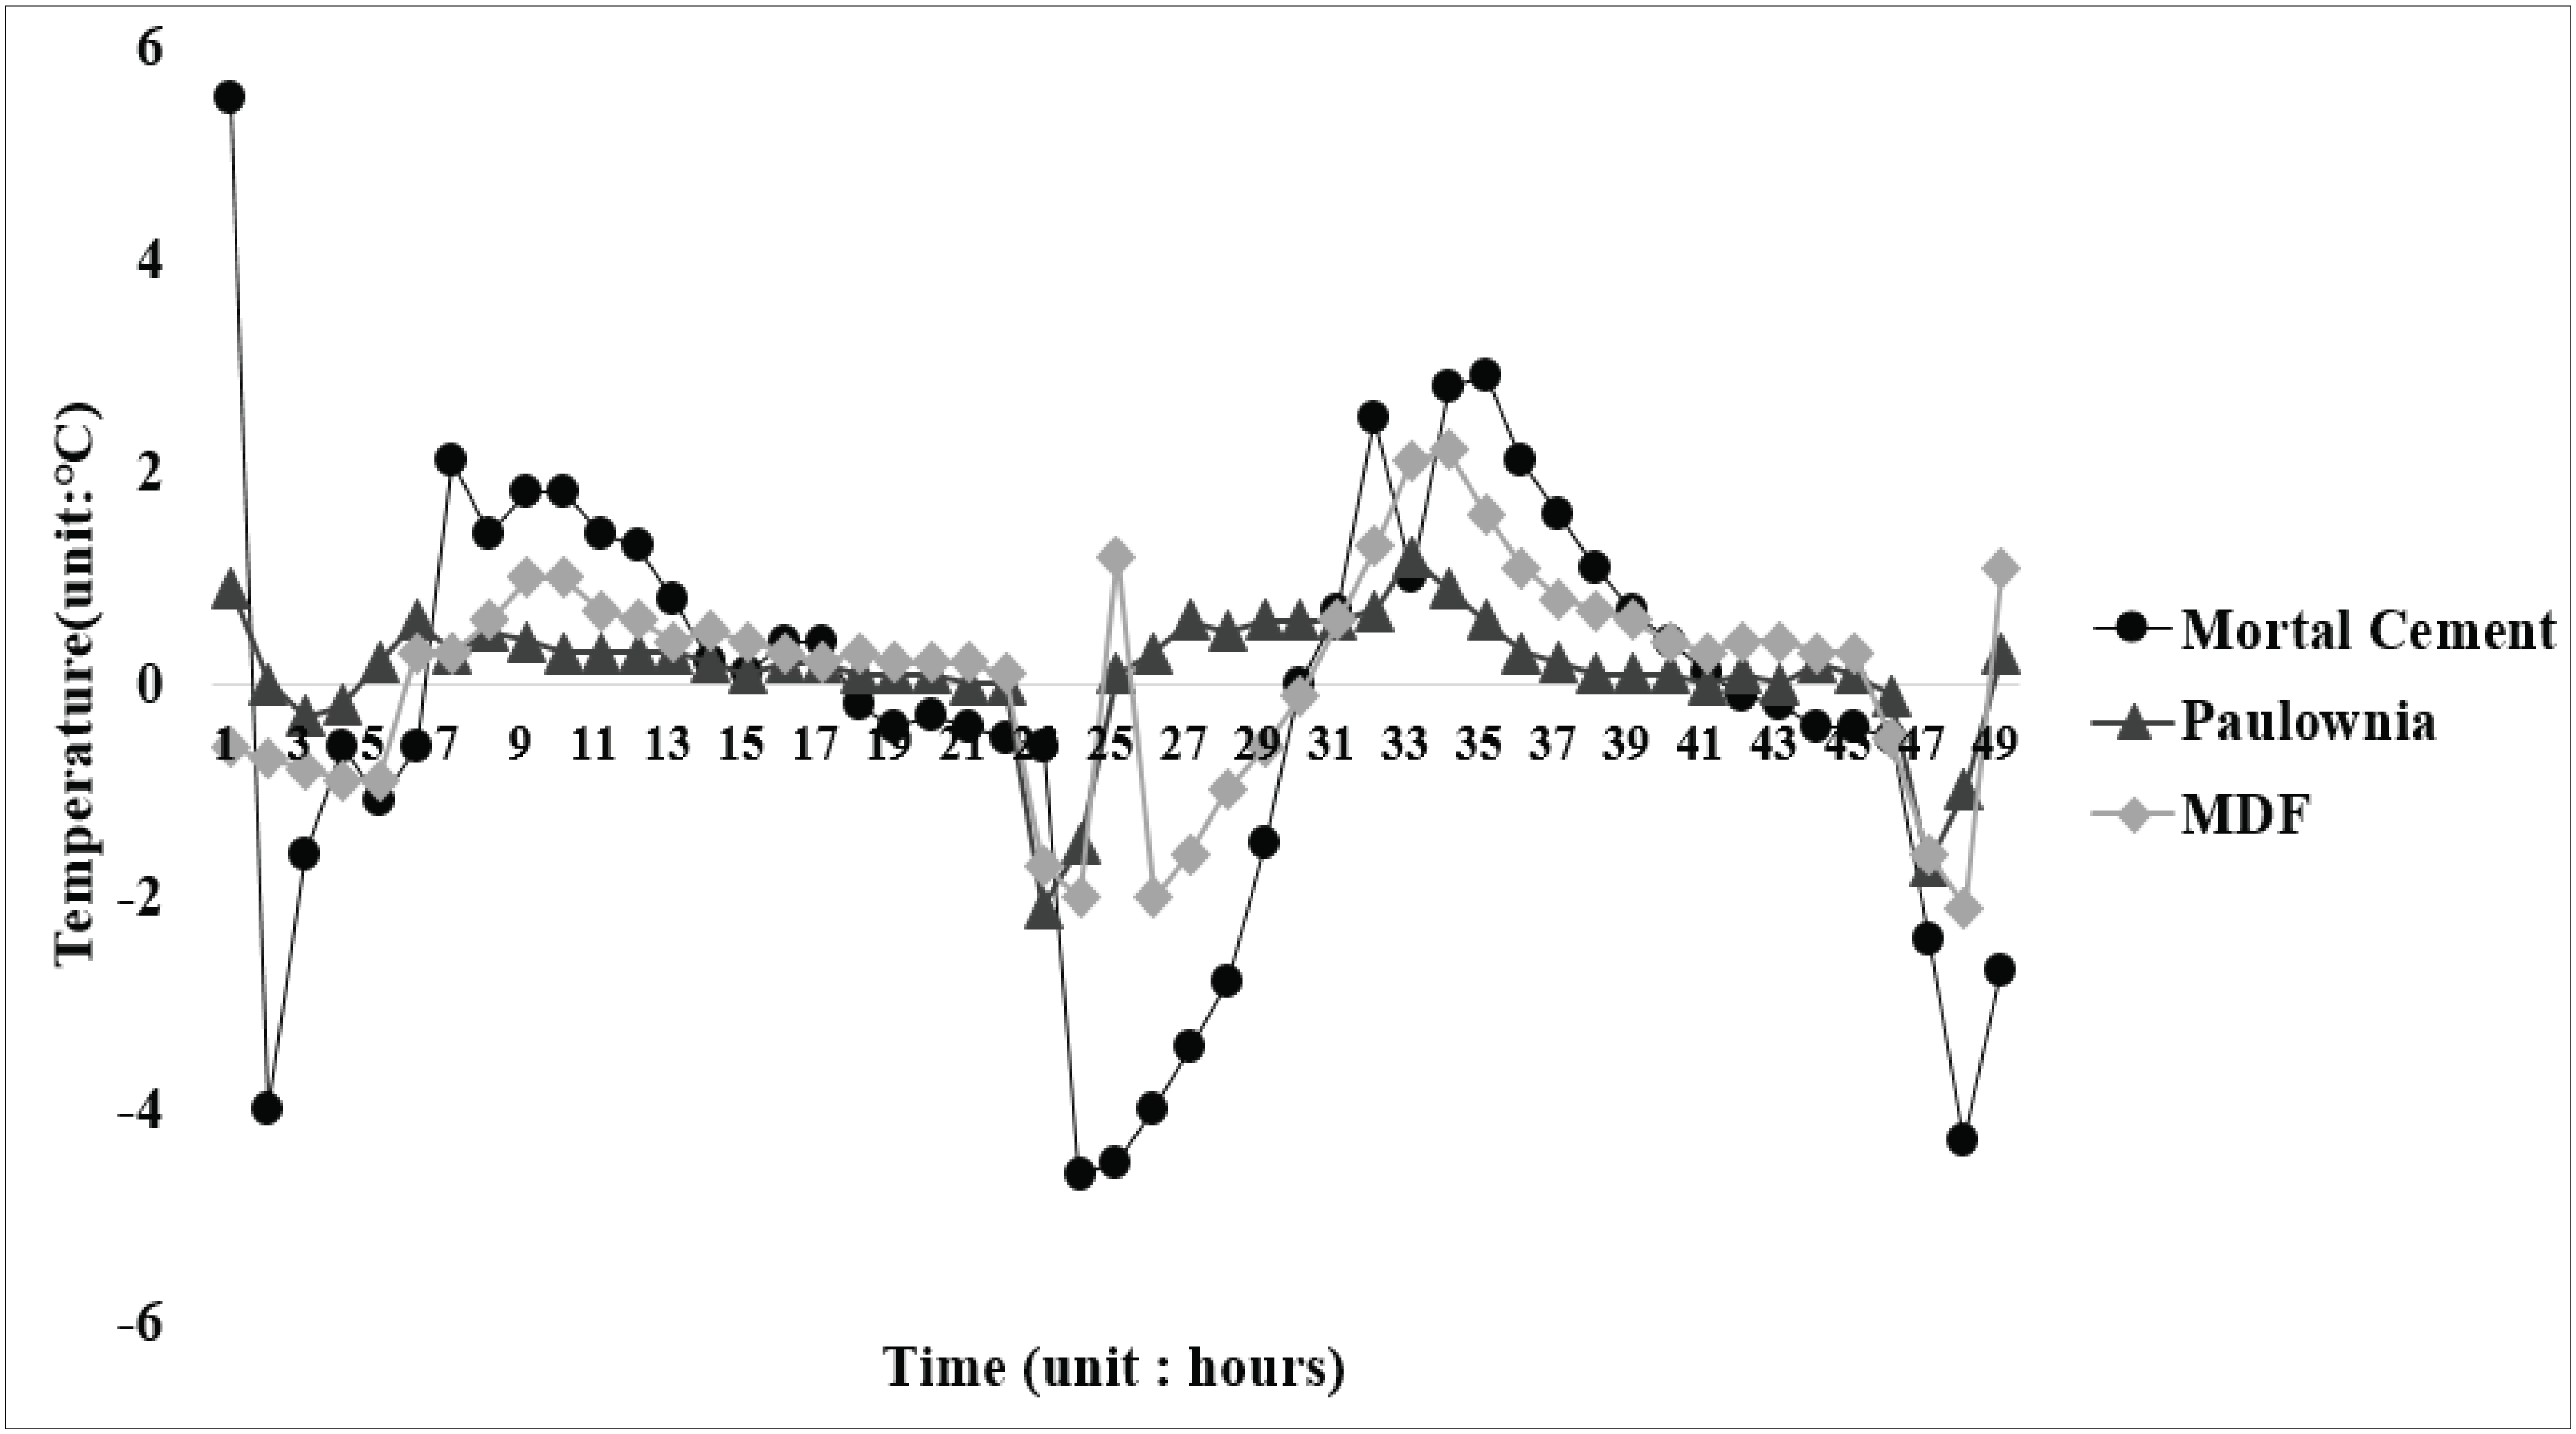
The modes of heat transfer and the heat capacity of the glass beakers are calculated based on the difference between the temperature of the interior finishing material and the air temperature, and the temperature changes of the glass beakers in the light source space where the material was exposed to the sunlight. The temperature difference, defined as the material temperature minus the air temperature, is shown in Fig. 3 for the light source space. The maximum difference between the temperature measured at the spot exposed to the sunlight and the air temperature is 2.1 °C for Korean paulownia and 2.2 °C for MDF, when the elapsed times are 23 hours and 34 hours, respectively. While their differences between the maximum and minimum temperatures are similar, Korean paulownia displays a temperature profile that is lower than that of MDF in overall according to Fig. 3. The cement sample exhibits a 4.6 °C maximum difference after 24 hours, which is approximately 2.4 °C larger than that of the wood and MDF samples. The overall trends in temperature change as a function of elapsed time are similar for Korean paulownia and concrete, but the MDF shows a spike after 24–25 hours are elapsed, which indicates that the surface temperature of the material increases more than the air temperature of the light source space. The air temperature inside the light source space increased between 20 hours (6 a.m.) and 25 hours (11 a.m.), which is similar to the changes of the air temperatures outside and inside the dome as shown in Fig. 2, due to light absorption in the hemispheric space. The MDF finishing material exhibited a higher surface temperature than the air temperature after 25 hours elapsed, and it was reversed after 1 hour. These results are closely related to the heat capacity and thermal conductivity characteristics of the materials. While temperature differences were originally expected to decrease in the order of Korean paulownia, MDF, and cement, it is hypothesized that the MDF used in this study resulted in a greater amount of radiation due to reflection from the surface coating, therefore displaying different results from the cement and Korean paulownia.

Heat transfer modes and energy efficiency in the light source space are calculated for the time range where the temperature differences (surface temperature − air temperature) are the largest, i.e., between 24 hours (10 a.m.) and 33 hours (7 p.m.), and summarized in Table 3. Heat is transferred from the surface that is exposed to the sunlight to the air by radiation, convection, and conduction, at contributions of 61–70%, 29–38%, and approximately 1%, respectively. The amount of heat that is transferred from the material’s surface to the air is found to decrease in the order of cement (2.219 W), Korean paulownia (0.464 W), and MDF (0.458 W), which indicates that the concrete transfers approximately 4.7 times more heat compared with the wood and MDF.
Convection heat represents the amount of heat that is transferred from the material surface to the air through air circulation in the mock-up chamber, and it differs by 0.66–0.69 W, depending on the material. More amount of heat is transferred by convection in the order of cement, MDF, and Korean paulownia. This result suggests that the use of wood, which has a lower density, leads to a greater amount of convection heat transfer, i.e., a greater amount of heat circulated inside the space, compared with higher density materials.
Radiation heat represents heat that is absorbed by the material and emitted back, and it shows a greater variation among the materials than conduction or convection. More amount of heat is transferred by radiation in the order of Korean paulownia, MDF, and cement, with the maximum difference among the three materials being approximately 1 W. Because the difference of 1 W is still relatively small, we could not confirm the correlation between the density, thermal conductivity of materials and heat transfer by conduction, convection, and radiation in the light source space.
The amount of energy that is transferred to the water contained in the glass beaker shows a difference of approximately 1 kJ among the three materials used. The largest amount of energy is transferred to the water when Korean paulownia is used, and the smallest when concrete is used, approximately 18.9 kJ.
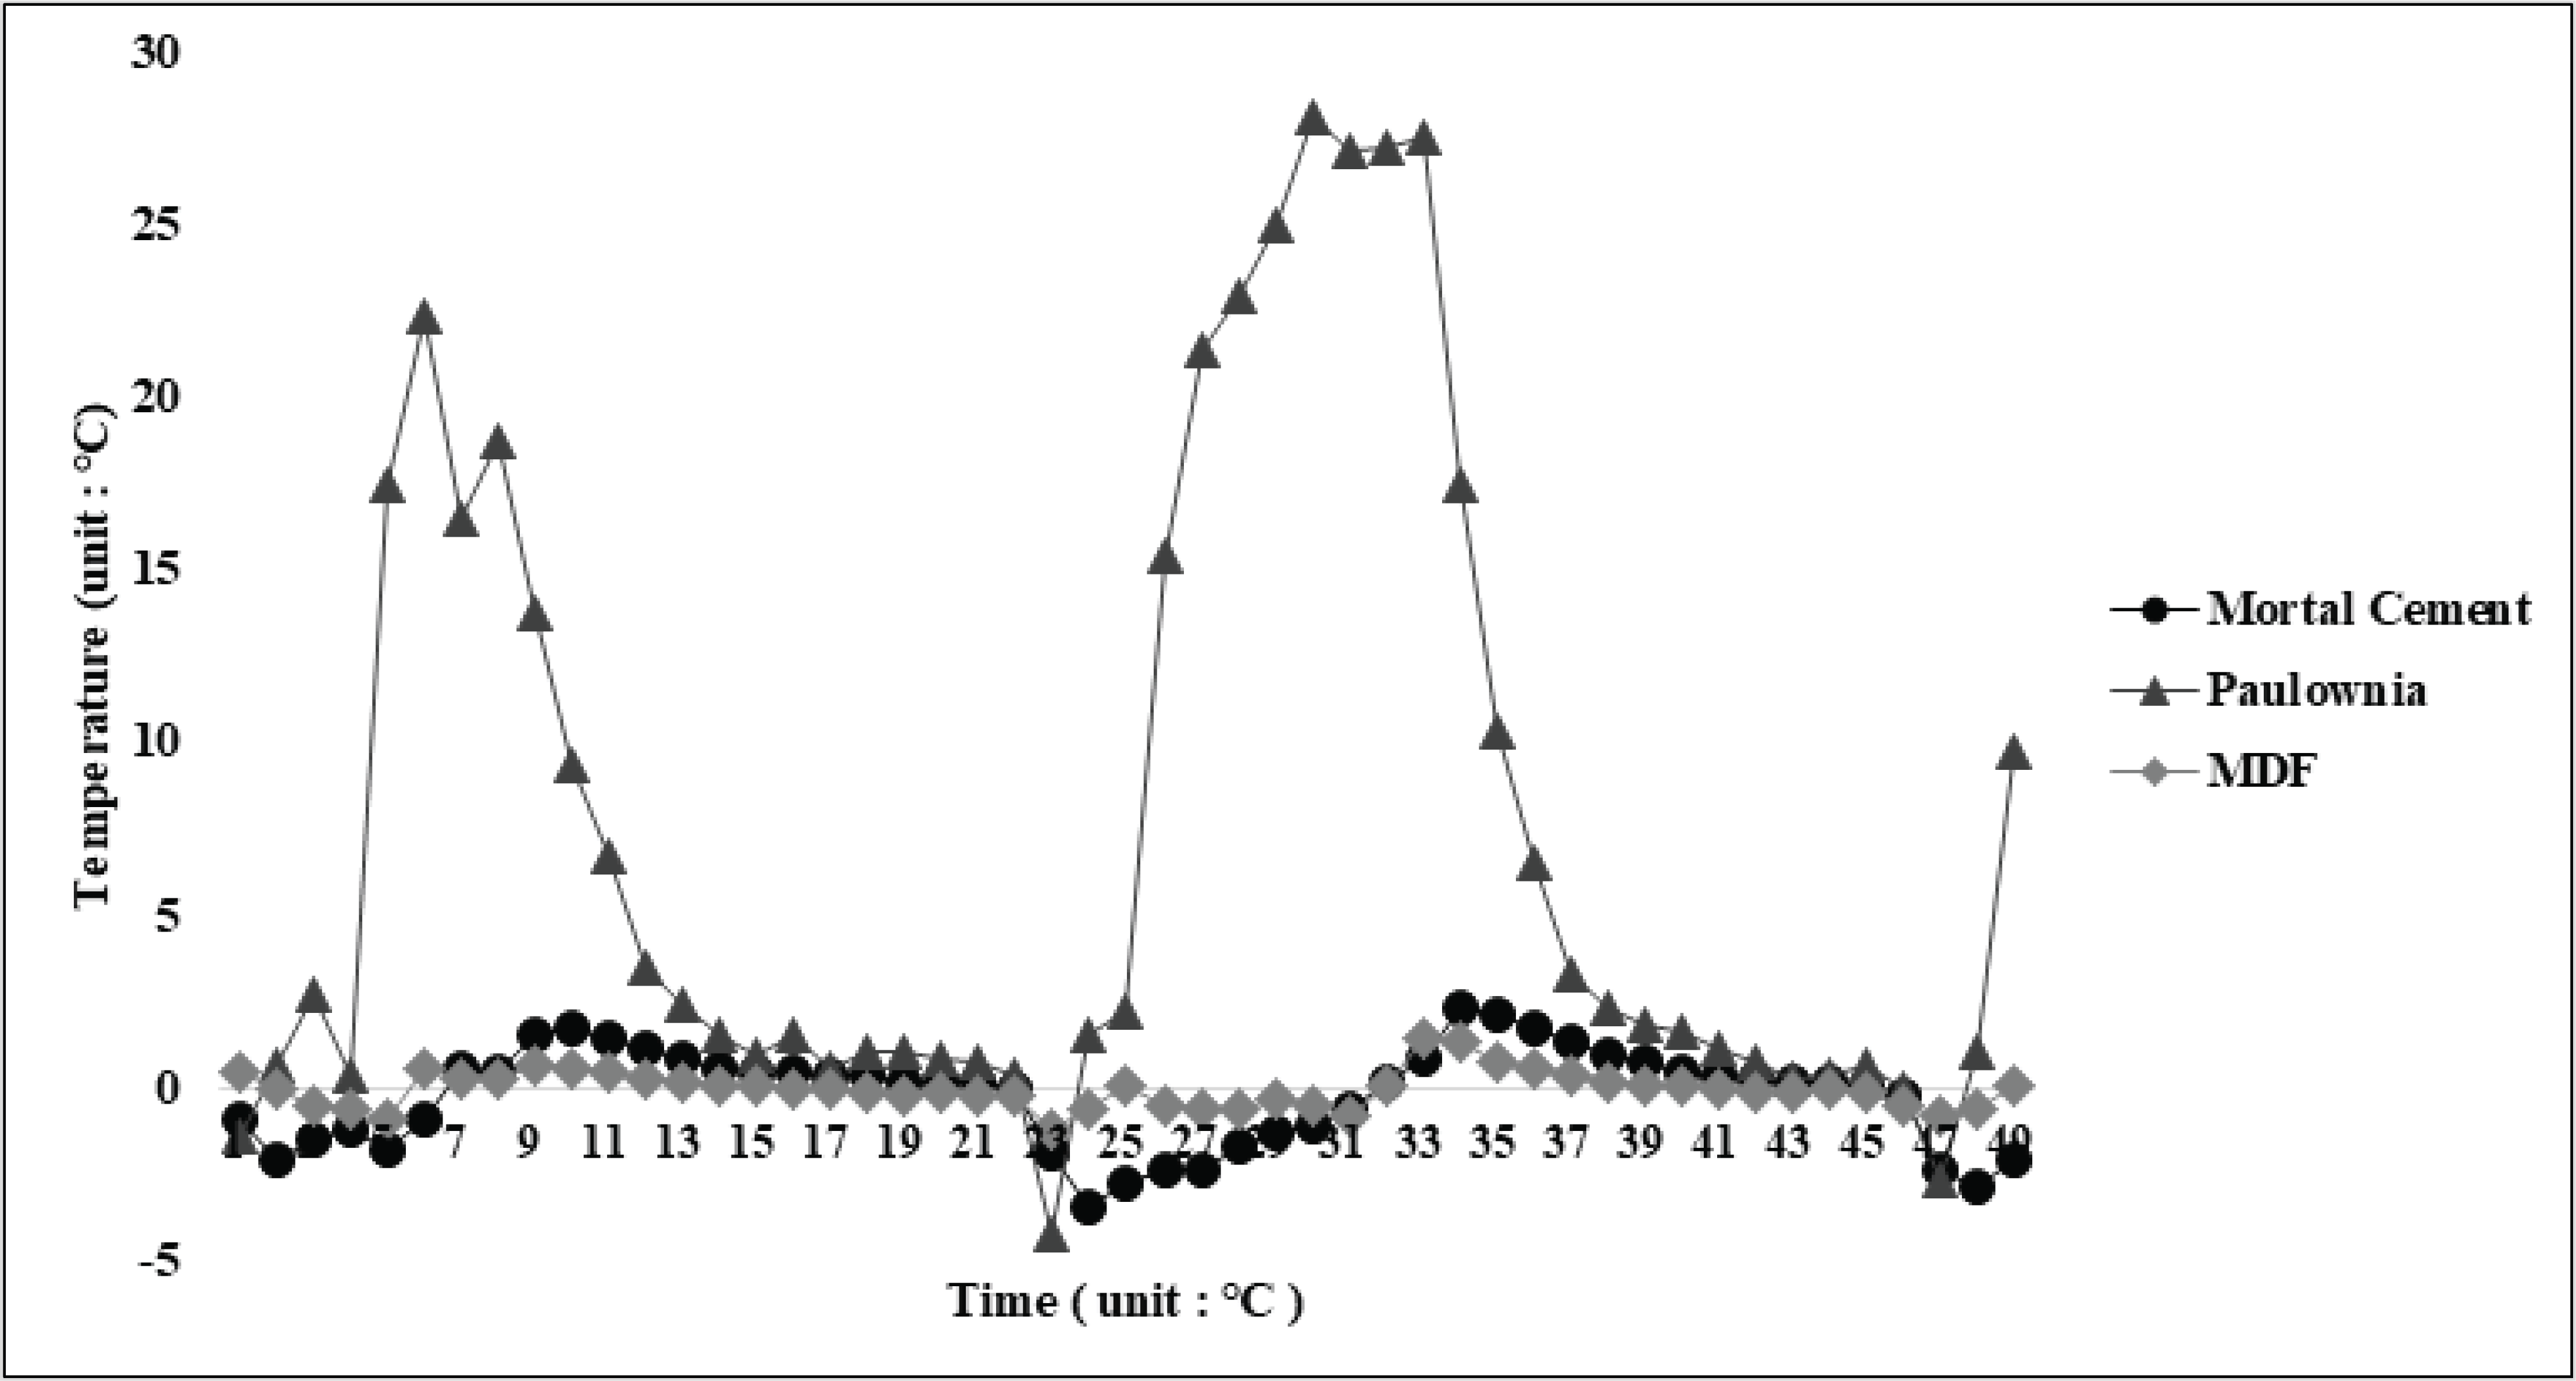
Modes of heat transfer and heat capacity of the glass beakers are calculated during the elapsed time range of 24–33 hours, where it had a greatest temperature difference between all three interior finishing materials and the air, and the greatest changes in water temperature. The temperature differences between the materials and the air in the lightless space are shown in Fig. 4. Korean paulownia exhibits the largest difference, 28 °C, whereas the concrete and MDF exhibit smaller differences that are equal to or less than 8 °C. These temperature differences are closely related to the differences in the amount of heat transferred from the materials to the air. The results suggest that heat transfer from the concrete and MDF to the air occurs fast, whereas Korean paulownia tends to store the heat within the material rather than transferring to the air. This can be also inferred from the air temperature measurements in the lightless space after 33 hours, which was measured to be 27.1 °C for Korean paulownia, 48.3 °C for the mortar cement, and 50.8 °C for the MDF. This result is attributable to the thermal conductivity of wood; it can be concluded that the use of the wood with low thermal conductivity leads to an efficient temperature control of the space due to a large amount of heat absorbed in the sample even if a large amount of heat is transferred through the sample. However, further studies about the effects of physical properties such as surface coating of MDF on heat transfer is necessary to understand why the MDF results in a higher air temperature than the mortar cement along with the higher thermal conductivity of MDF.

Modes of heat transfer and energy efficiency in the lightless space are summarized in Table 4. The heat in the lightless space is transferred from the interior material to the air by radiation (51-68%), convection (30-47%), and conduction (approximately 1%).
The total amount of heat transferred from the sample surface to the air decreases in the order of Korean paulownia (15.365 W), cement (0.8 W), and MDF (0.315 W); heat transferred by the concrete is approximately two times greater than that of MDF, and heat transferred by Korean paulownia is approximately 20 times greater than that of the concrete. The heat which passed through the sample and reached the opposite surface is transferred to the air in the lightless space partly by conduction, and heat transferred by conduction is observed to have minimal difference among all three materials, which is similar to the results obtained from the light source space.
Convection heat represents the amount of heat that is transferred from the material surface to the air through air circulation within the mock-up, and the maximum difference among the three materials is 7 W. It is observed that more heat is transferred by conduction in the order of MDF, cement, and Korean paulownia, which is similar to the results obtained from the light source space. While a comparison of convection heat transferred by cement and MDF is difficult due to their small difference of less than 1 W, convection heat for Korean paulownia, which has a low density, is 35 times greater than that for the MDF and cement. This result suggests that the use of wood which has a low density leads to a greater amount of heat transferred by convection, i.e., a greater amount of heat circulated inside the space, compared with higher density materials.
Radiation heat represents heat absorbed by the material and emitted back, and it shows a greater variation among the materials than conduction or convection. More amount of heat is transferred by radiation in the order of MDF, cement, and Korean paulownia, with a maximum difference among the three materials of approximately 14 W. This result suggests that materials with lower density and lower thermal conductivity lead to a greater amount of heat transferred by radiation.
The amount of energy used to heat the water contained in the glass beaker shows a difference of approximately 1 kJ among the three materials used. The largest amount of energy is transferred to the water when Korean paulownia material is used, and the smallest when the concrete is used, which is approximately 19.1 kJ.
4. CONCLUSIONS
The heat transfer characteristics and heat capacity of interior finishing materials are compared in this research. Three types of commonly used interior finishing materials are selected for comparison: cement, Korean paulownia, and MDF.
The light source space did not show significant difference between the amount of energy and heat transfer in each material, which suggests that heat reflected from the material surfaces does not affect the temperature increase of the space.
It is observed that more amount of heat is transferred from the material to the air in the lightless space in the order of MDF, cement, and Korean paulownia; significant differences are observed in the amount of heat loss among the three materials. The fact that the amounts of heat transferred through conduction from the MDF and cement are different by less than 1 W suggests that the conduction heat is proportional to the thermal conductivity and density of the material. Therefore, it is concluded that better energy efficiency can be obtained by using materials with low thermal conductivity and low density as interior finishing materials.
The amount of energy that is transferred to the water contained in the glass beakers is the highest when Korean paulownia is used, approximately 19.9 kJ, in both the light source space and lightless space, and the corresponding values for the cement and MDF are similar to one another, 19.1 kJ and 19.2 kJ, respectively. If the water in the beakers represents a human body, it can be concluded that a resident is likely to feel warmest in a room finished with Korean paulownia.
Radiation constitutes the major mode of heat transfer in this experiment. Korean paulownia which has a low density exhibits the greatest amount of energy and heat transfer, and therefore, it is the most optimal material for energy efficiency. The use of interior finishing material wood is expected to increase energy efficiency inside the building.


