Original Article

Analysis of Sap Production and Composition of Acer okamotoanum from Artificial Stands in Different Tapping Time in Jin-ju Region in Korea

Jin-Sung HUH2, Jeong-Woon KIM2, Jun-Hyuck YOON2, Su-Yeon LEE2,
Author Information & Copyright
2Department of Wood Science & Technology, Forest Biomaterials Research Center, National Institute of Forest Science, Jinju 52817, Republic of Korea
Corresponding author: Su-Yeon LEE (e-mail: goodday8508@korea.kr, ORCID: 0000-0002-5257-0043)

© The Korean Society of Wood Science & Technology.

Received: Sep 30, 2019; Accepted: Mar 06, 2020

Published Online: Mar 25, 2020

Abstract

This study was conducted to analyze the sap flow and composition by tapping date in Acer akamotoanum from an artificial forest in the City of Jinju. The sap was collected from five saplings (diameter at breast height10-20 cm) in two phases with an interval of a month. During phase 1 (January 10, 2019 – February 9, 2019) with daily mean temperature of 1.16±2.15°C, 60.59 liters of sap was collected over 32 days. Phase 2 (February 12, 2019 – February 22, 2019) with daily mean temperature of 2.55±1.30°C yielded 13.38 liters of sap over 11 days, which was a reduction to 22% of the total sap flow in phase 1. The analysis of sugar composition in the collected sap from phase 1 and 2 showed that sucrose concentration was 2.5% at its highest during the earlier days of collection and decreased to 0.8% at the end. Glucose and fructose concentrations were measured near 0, and were lower than sucrose concentration. The most prominent inorganic elements in the collected sap were potassium (41.69 - 89.75 mg/kg), calcium (24.66 - 48.14 mg/kg) and magnesium (10.18 - 27.25 mg/kg). The contents of sucrose and inorganic components between the samples collected from phase 1 and 2 did not show significant differences. The sap flow amounts of A. okamotoanum from different tapping periods showed a notable variation, but there were no significant differences in the contents of sugar or inorganic elements.

Keywords: Acer okamotoanum; sap; sucrose; inorganic component

1. INTRODUCTION

The sap is a forest product harvested during the winter and early spring and is an important income source related to forestry policy. A typically harvested species in Korea is Acer pictum var. mono, while subspecies Acer okamotoanum Nakai and Acer pictum var. truncatum are also known as the main sap production strains. In particular, A. okamotoanum Nakai has gained attention since earlier days as potential short-term economic crop due to its unique ginseng scent and relatively high contents of sugar and inorganic components (Kwon et al., 2010). In case of A. okamotoanum Nakai which only grows in Ulleungdo, the main sap collection source had been the natural forest in Ulleungdo, but a demand for artificial afforestation in the inland area for A. okamotoanum Nakai sap production has been increasing recently.

In 2005, Forest Biomaterials Research Center of Korean National Institute of the Forest Science established an artificial forest for the growth of A. okamotoanum Nakai in Gajwa Experimental Forest in the City of Jinju. The purpose was to investigate inland adaptability and growth conditions of A. okamotoanum Nakai (Yoon et al., 2012). Nine years after the plantation, we confirmed that the diameter at breast heightreached 10 cm, which indicates the fitness for sap collection (Lim et al., 2016). Temperature is known to be the most important factor in sap flow (Choi et al., 2010). Jiri Mountain area has reported mid-February with the daily mean temperature of 1.2±1.6°C, the daily minimum temperature of -4.3±1.5°C and the daily maximum temperature of 11.8±1.9°C to be the optimal sap flow period (Choi et al., 2010).

However, the perforation period for the optimal sap production varies by region as each region has different average temperature and diurnal temperature variation. The study site of this research has also been monitoring the sap flow and composition each year since 2014 to predict the perforation period for effective production of the appropriate volume of sap. The result to date based on the average annual temperature of the past 30 years in Jinju area of Gyeongsangnam-do Province suggests the critical date for sap tapping to have the daily mean temperature of 3.42°C, the daily minimum temperature of -2.14°C and the daily maximum temperature of 10.60°C, and for the tapping period to last from the end of January to mid-February (Kim et al., 2017). In this study, we collected sap by perforating artificially planted A. okamotoanum Nakai in Jinju area in two phases with an interval of 30 days.

The purpose of this study was to investigate the sap flow based on perforation period and to analyze sap composition in effort to utilize the results as a base line data for inland A. okamotoanum Nakai sap research.

2. MATERIALS and METHODS

2.1. Study site and tree samples

The research site for this study is a plantation in Gajwa Experimental Forest, part of National Institute of the Forest Science’s Forest Biomaterials Research Center located in Jinju, Gyeongsangnam-do Province. The plantation is 112 m above sea level and is on the northeastern slope of 32 degrees. Each phase used five saplings (diameter at breast height10-20 cm) of A. okamotoanum Nakai planted in 2005 for the sap collection (Table 1).

Table 1. General characteristics of experiment sites for growth of A. okamotoanum in artificial stands.
Location GPS Altitude (m) Slope (°) Aspect Tree no. /ha
Gyeongnam Jinju N35°09′ E128°05′ 112 32 E 1,333
Download Excel Table
2.2. Sap collection and atmospheric conditions measurement

Tree samples consisted of saplings (diameter at breast height 10-20 cm), and we used five samples for the collection in phase 1 and phase 2 respectively. For the perforation, we used 8 mm drill at a height of 1 m from the soil surface in accordance with sap collection protocol of Korea Forest Services. Up to two perforations are allowed, but we decided on one perforation using 8 mm hose for this study. Phase 1 collection was conducted from January 10, 2019 to February 9, 2019. Upon completion of measuring the collected sap in phase 1, collection for phase 2 followed from February 12, 2019 until February 22, 2019. The perforation began at 11:00 a.m., and we recorded the exact sap flow amount every 24 hours using measuring cylinder. The daily temperature and relative humidity were recorded with micrometeorological measuring equipment (WH-2300S, CHANJU TECH Co., China). Fig. 1.
wood-48-2-206_F1
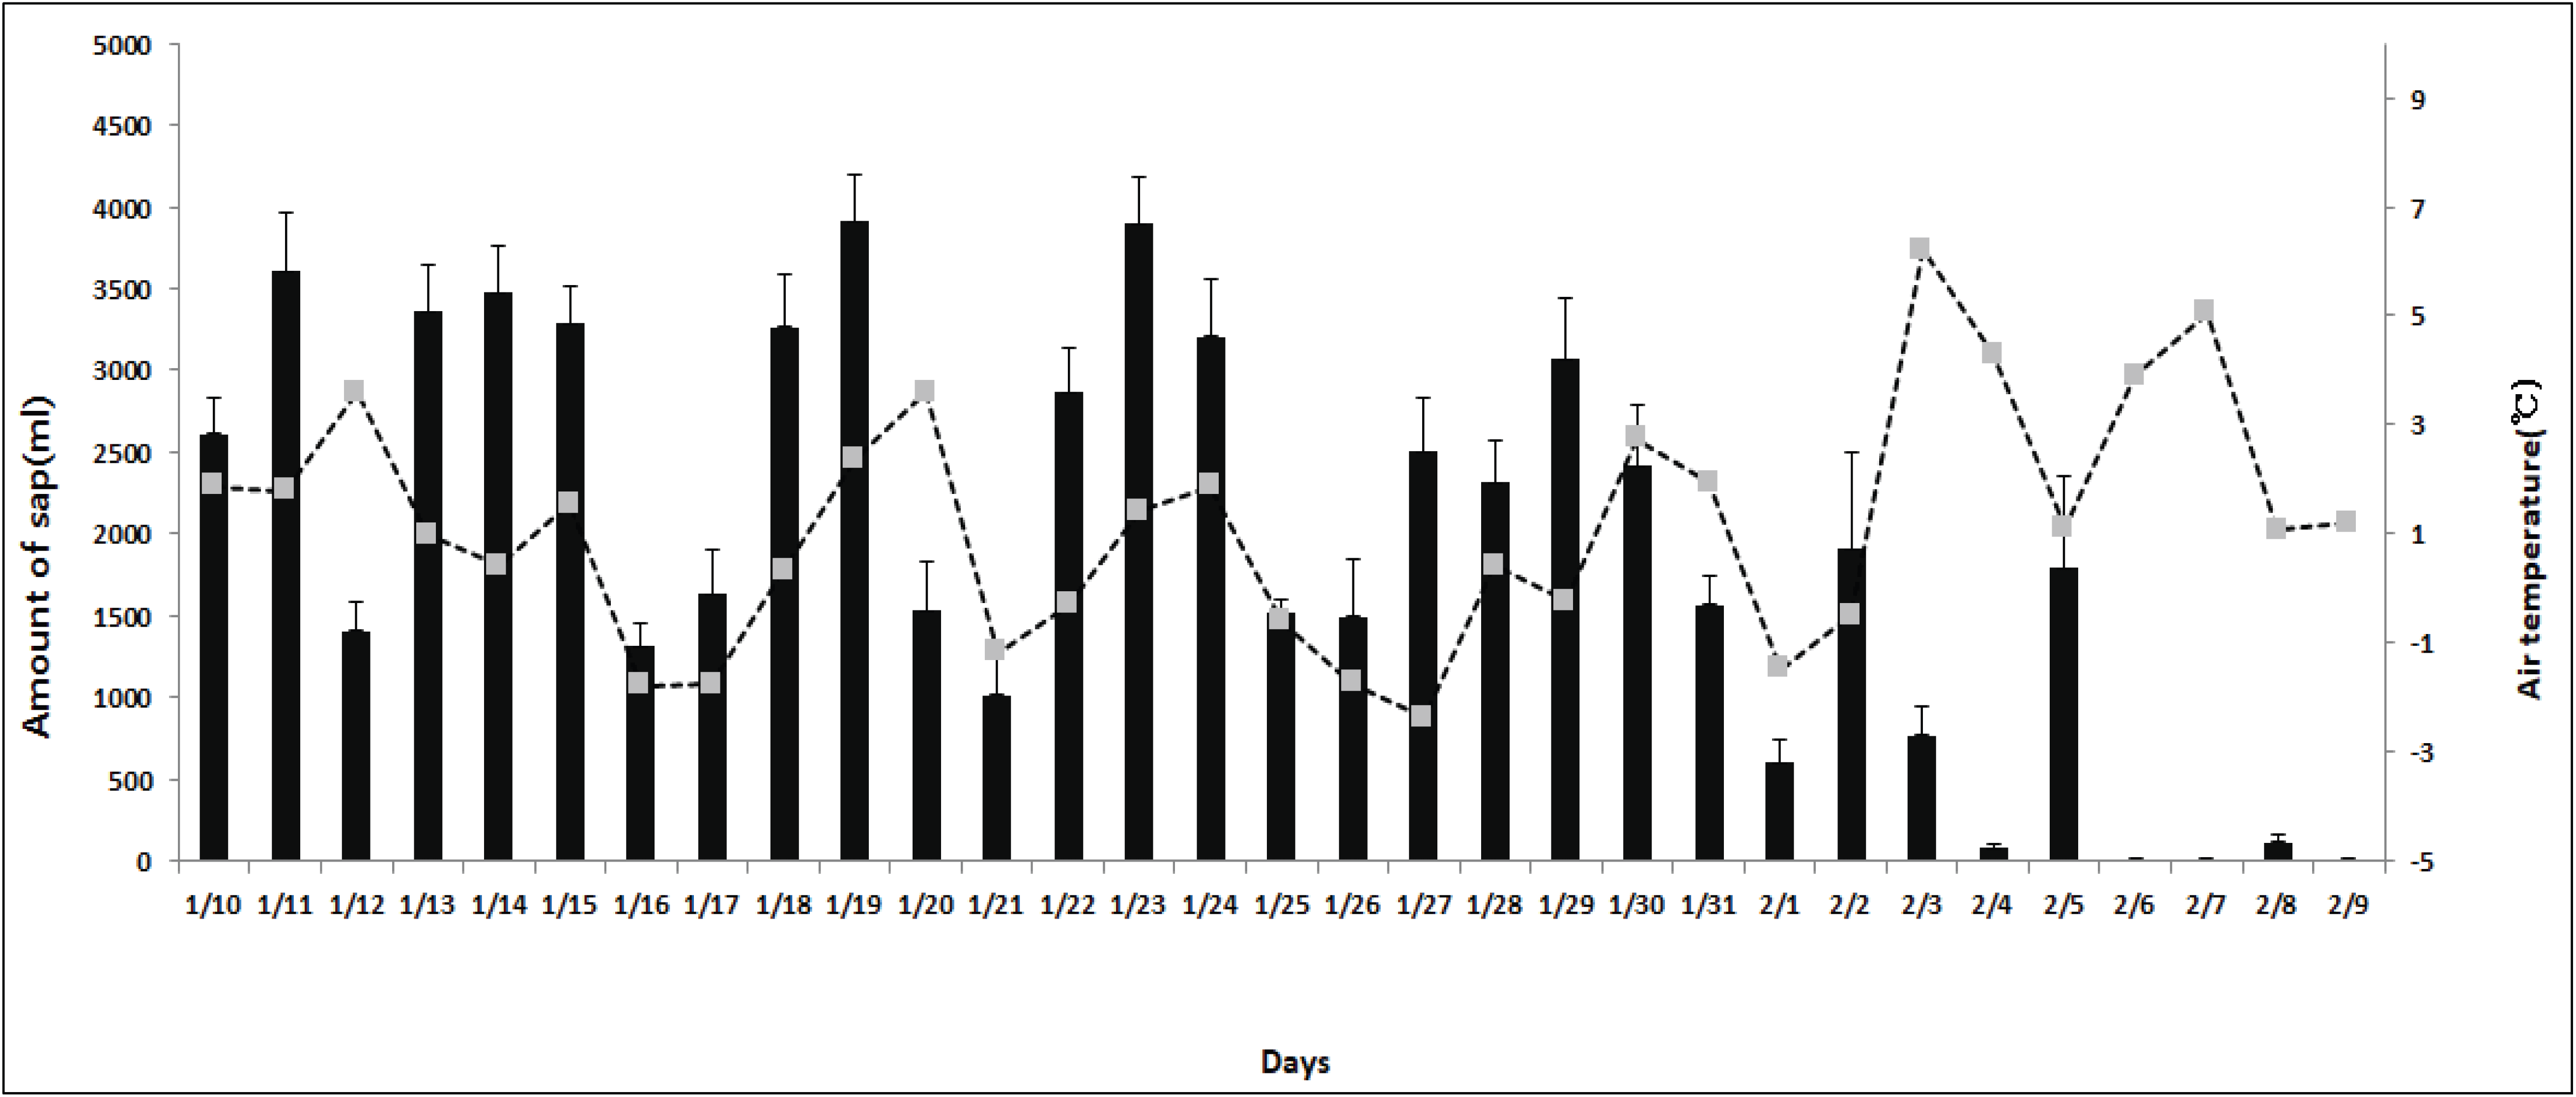
Fig. 1. Amount of A. okamotoanum sap production and daily average air temperature during the first tapping.
Download Original Figure
2.3. Sugar analysis

The sap collected from each sample was used for the analyses of contents of sugar and inorganic elements every 24 hours. Immediately after measuring the sap flow, we filtered the sap through a 0.45-μm permeable membrane filter and diluted it to 1:100 concentration to analyze the sugar content using Bio-LC (Dionex, 2000). Glucose (sigma), fructose (sigma) and sucrose (sigma) were used to prepare the calibration lines for quantitative analysis. We used MA1 (250 x 4 mm, Dionex, Palo Alto, CA, USA) for column, an amperometry detector (HP 1100, Hewlett Packard, USA) for detection and sodium hydroxide 617 mmol as the eluent solution. The analysis was performed at 40°C with the flow rate of 0.4 mL/min. We injected 10 μL of samples and performed two repetitions of the analysis.

2.4. Inorganics analysis

Inorganic elements were also analyzed every 24 hours using inductively coupled plasma mass spectrometer (ICP-MS, ANALYTIKJENA, Germany) after filtering the collected sap through a 0.45-μm permeable membrane filter and diluting it to 1:200 concentration. (Table 2).

Table 2. Soil texture properties for A. okamotoanum in artificial stands.
Textural class Soil texture (%)
Sand Silt Clay
Clay loam 36.00 36.00 28.00
Download Excel Table

3. RESULTS and DISCUSSION

3.1. Study site and tree samples

The forest stand of A. okamotoanum Nakai at the study site was 1,333 per hectare. Among these, we selected 10 saplings as samples for sap flow investigation. As of 2019, samples measured an average plant life of 14 year, an average height of 12.8 m, an average diameter at breast height of 15.84 cm, tree volume of 0.056 m3, an average trunk of 2.77 m and an average crown of 7.09 m (Table 3).

Table 3. Growth characteristics of A. okamotoanum in the artificial stands.
Hz(m) DBH(cm) CL(m) WC(m) Age(yr)
12.8 ± 1.40 15.84 ± 2.20 2.77 ± 0.72 7.09 ± 0.64 14.0 ± 0.0

z H: Height, DBH: Diameter at breast height, CL: Clear length, WC: Width of crown.

Download Excel Table
3.2. Correlation between sap flow and temperature factor

The total duration and amount of sap flow differed for the sap collected in phase 1 and phase 2. The sap flow lasted for 32 days (January 10 - February 9) in phase 1, compared to 11 days (February 12 - 22) in phase 2. The total sap flow amount measured at 60.59 L in phase 1 and 13.38 L in phase 2. Based on Korea Forest Service’s current recommenced yield of 1,250 mL/day for saplings (Lim et al., 2016), the sap flow in phase 2 was markedly low.

This may be due to the difference in each individual sample, but it is believed to be caused by the temperature, which is known as the most crucial factor (Choi et al., 2012). The temperature data from the study site showed that the average daily temperature of the total sap flow duration in phase 1 was similar to the previously recorded (Choi et al., 2010) optimal average daily temperature (1.2±1.6°C) at 1.16±2.15°C, while that of phase 2 was 2.55±1.30°C. When phase 1 was divided into periods of 10 days, the sap flow amount was 29.4 L from January 10th to 20th, 25 L from January 21st to 31st and 5.3 L from February 1st to 10th, indicating 90% of the total sap flow produced in January. In particular, a previous research confirmed a sharp decrease in sap flow when the average daily temperature was 3.42°C or higher (Kim et al., 2017), and we believe that the sap flow in February rapidly decreased in comparison to January as the average daily temperature rose over the critical point beginning February 3rd in 2019.

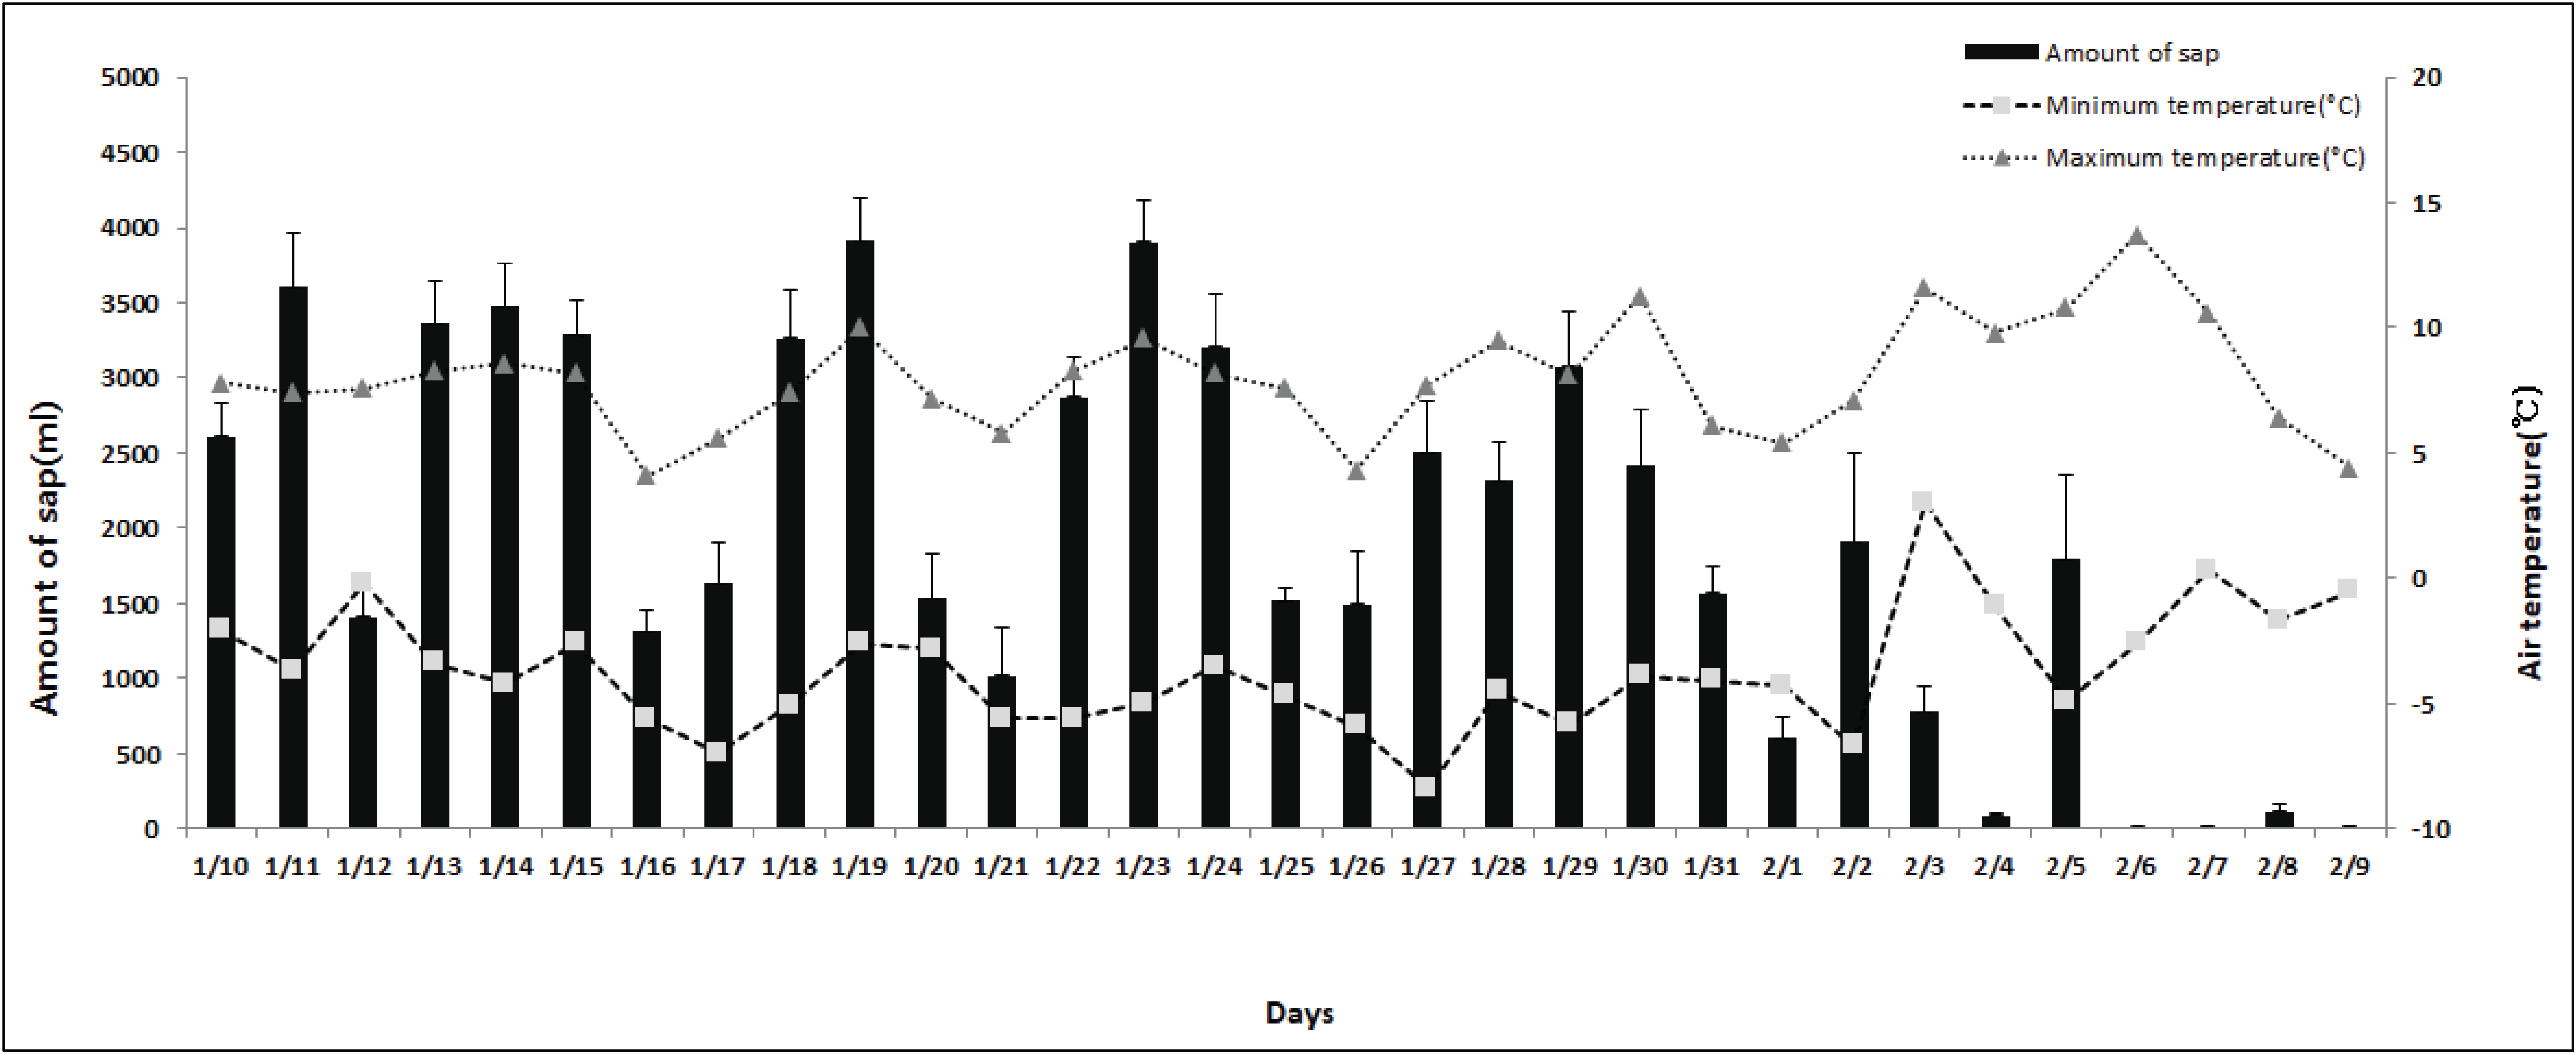
The average sap flow of January in phase 1 was 2.5 L, and sap flow on 12, 16, 17, 20, 21, 25, 26 and 31 of January fell short of the average quantity. Such phenomena should be reviewed in relation to diurnal temperature variation. The sap is known to flow between the range of night temperature below zero and daytime temperature above zero. A pervious study reported that the sap flows the most when the lowest temperature is -4.3±1.5°C and the highest temperature is 11.8±1.9°C. In this study, we believe that the sap flow was low, because the maximum temperature on days of below-average sap flow was relatively high at a range of 4.3°C to 7.6°C (Fig. 2), while the diurnal temperature variation was small. (Table 4).
wood-48-2-206_F2
Fig. 2. Amount of A. okamotoanum sap production and daily minimum and maximum temperature during the first tapping.
Download Original Figure
Table 4. Inorganic components of A. okamotoanum sap from the first tapping.
Date Inorganic components (mg/kg)
Na K Mg Al P Ca Mn Fe Zn

1/10 0.76 79.11 17.03 0.38 7.98 25.27 4.33 0.04 0.43
1/12 0.89 82.79 20.82 0.41 8.54 41.28 5.20 0.05 0.58
1/14 0.66 89.75 22.28 0.42 8.11 41.29 5.46 0.07 0.65
1/16 0.59 82.22 22.47 0.43 7.88 41.28 5.61 0.06 0.62
1/18 0.81 60.99 21.52 0.44 6.87 41.20 5.39 0.08 0.57
1/20 0.64 78.59 19.92 0.32 7.61 36.83 4.85 0.07 0.57
1/22 0.85 72.22 22.18 0.40 7.02 36.15 5.54 0.08 0.61
1/24 0.92 63.67 20.71 0.26 7.64 24.66 5.02 0.06 0.58
1/26 0.63 64.21 20.22 0.40 7.56 47.15 5.10 0.08 0.62
1/28 0.91 74.57 20.28 0.23 7.89 26.61 3.85 0.06 0.54
1/30 0.31 41.69 22.04 0.24 8.11 32.11 5.00 0.07 0.44
2/1 0.72 46.65 27.25 0.24 7.04 45.28 5.29 0.05 0.30
Download Excel Table

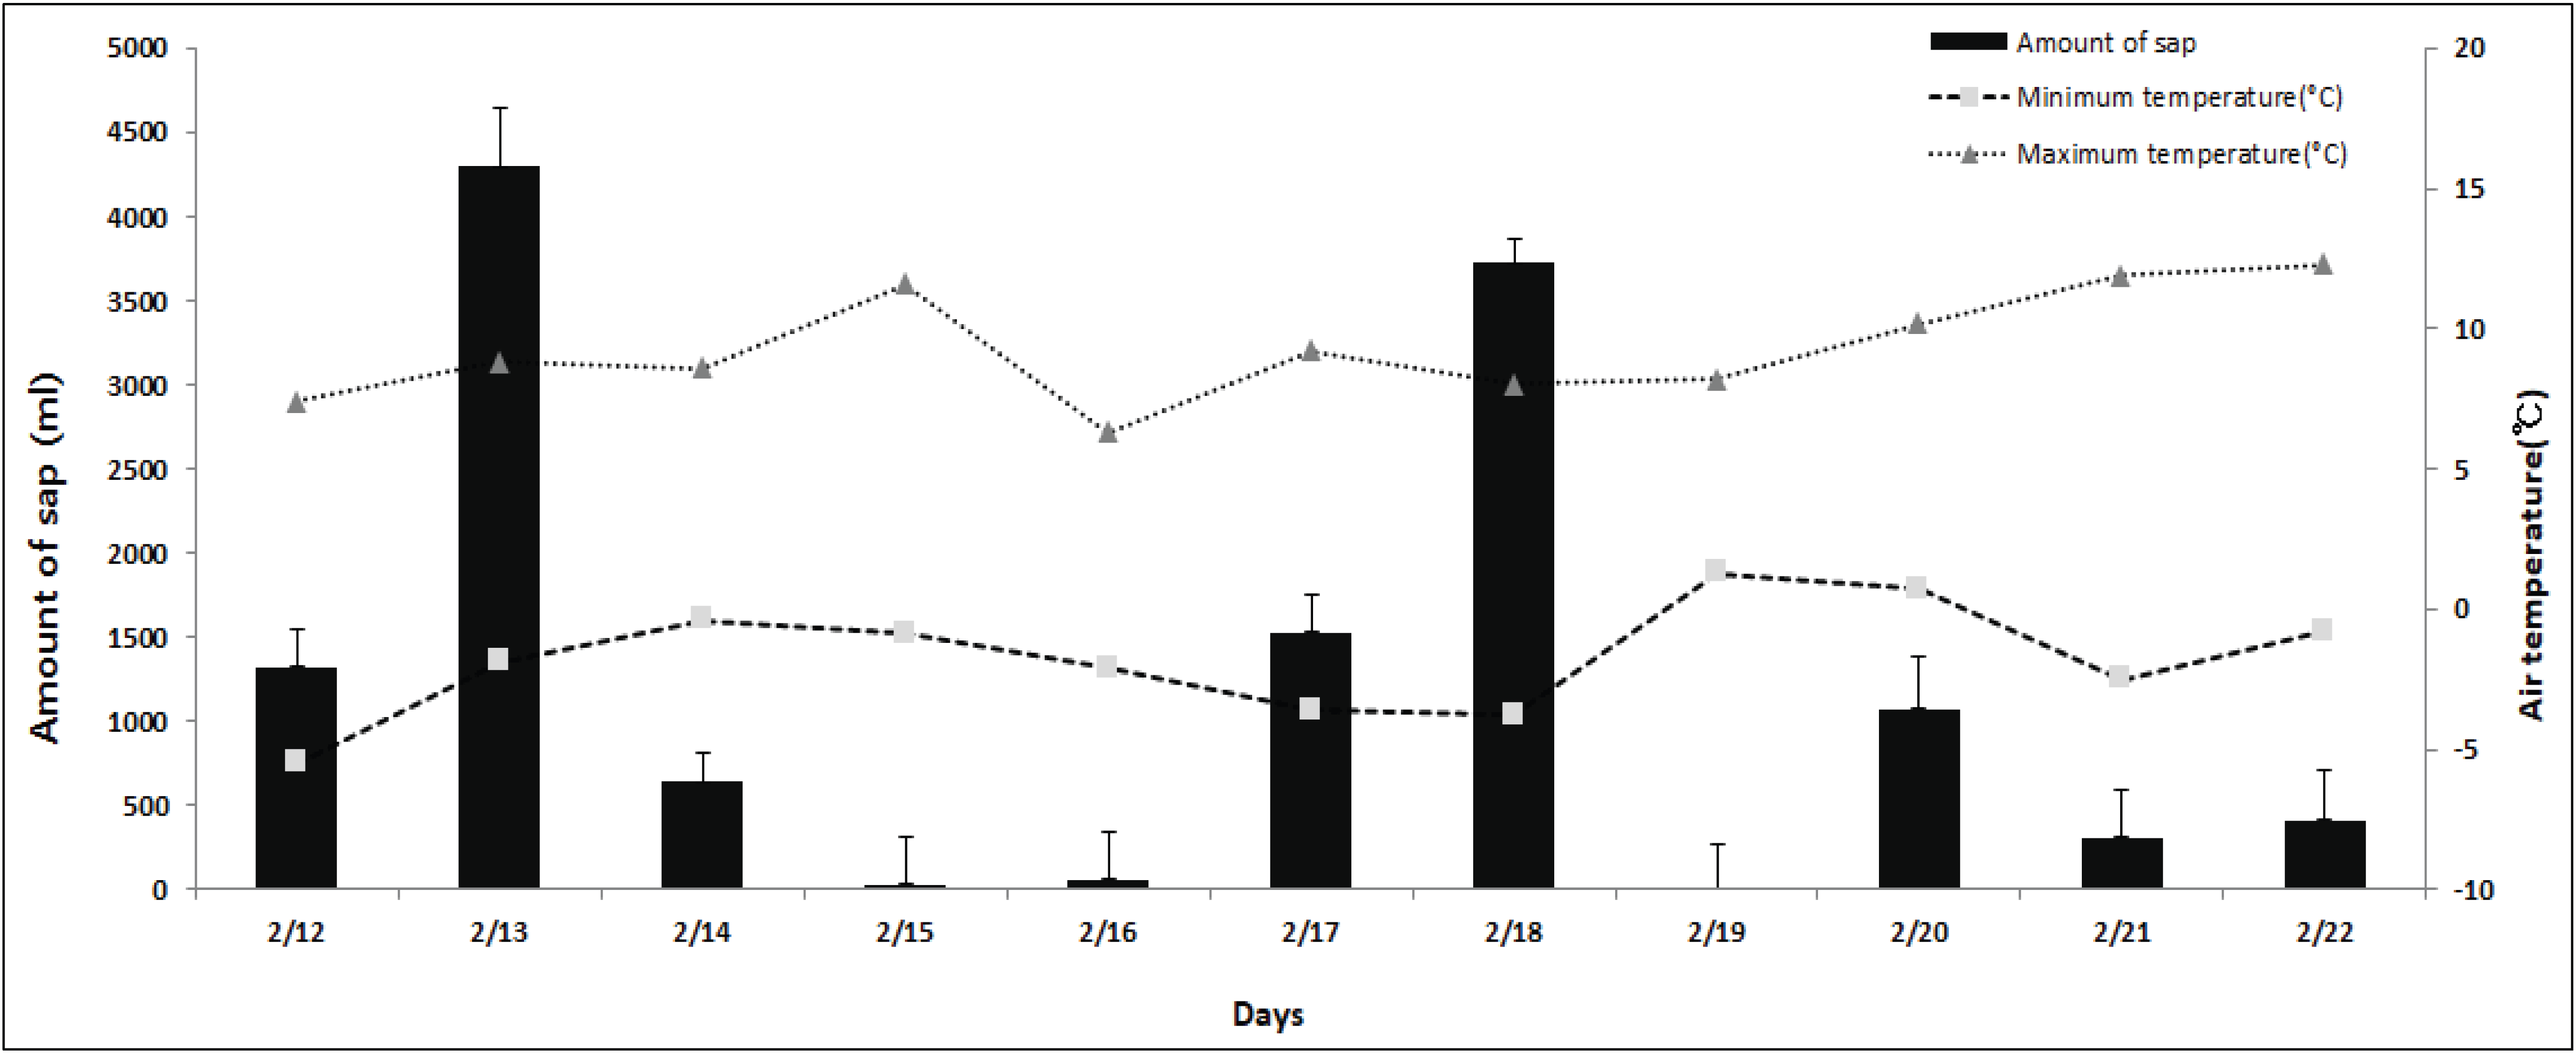
The effects of diurnal temperature variation were evident in the results of phase 2 collection. The daily average sap flow of 1.33 L was around half of phase 1, and sap flow did not meet the average value on 14, 15, 16, 20, 21 and 22 of February (Fig. 3). The temperature on most days of February fell within the aforementioned optimal maximum temperature, but the sap flow is believed to have reduced due to the high range of the minimum temperature between -2.5°C and -0.4°C. As a result, we were able to confirm the importance of the daily mean temperature and the diurnal temperature variation, and found the minimum temperature to be -4.3°C±1.77°C and the maximum temperature to be 8.30±0.80°C on days with high sap flow.
wood-48-2-206_F3
Fig. 3. Amount of A. okamotoanum sap production and daily minimum and maximum temperature during the second tapping.
Download Original Figure
3.3. Sugar content analysis

Sugar and inorganic component analyses (Bio-LC) immediately followed the sap collection every day. The main sugar content of sap is glucose, fructose and sucrose, while the sucrose is known to be the main determinant of sugar content. Analysis of the collected sap showed the sucrose content was the highest among the three, followed by glucose and fructose. Although there are not many sugar content analyses of A. okamotoanum Nakai in Korea, some published results report that only sucrose is found in the sap produced in Ulleungdo region (Moon et al., 2004). It is probable these differences could be caused by varying methods of analyses than by characteristics of production sites. (Table 5).

Table 5. Inorganic components of A. okamotoanum sap from the second tapping.
Date Inorganic components (mg/kg)
Na K Mg Al P Ca Mn Fe Zn

2/12 0.49 78.12 19.99 0.75 7.27 37.17 6.76 0.08 0.51
2/14 0.61 74.02 14.67 0.48 8.59 36.85 4.89 0.04 0.39
2/16 0.50 78.87 13.80 0.39 7.54 48.14 4.79 0.02 0.59
2/18 0.67 75.92 10.84 0.32 7.16 47.44 3.62 0.00 0.52
2/20 0.25 65.03 11.46 0.37 7.06 35.72 3.55 0.00 0.54
2/22 0.74 60.80 10.18 0.30 7.78 33.97 3.10 0.00 0.46
Download Excel Table

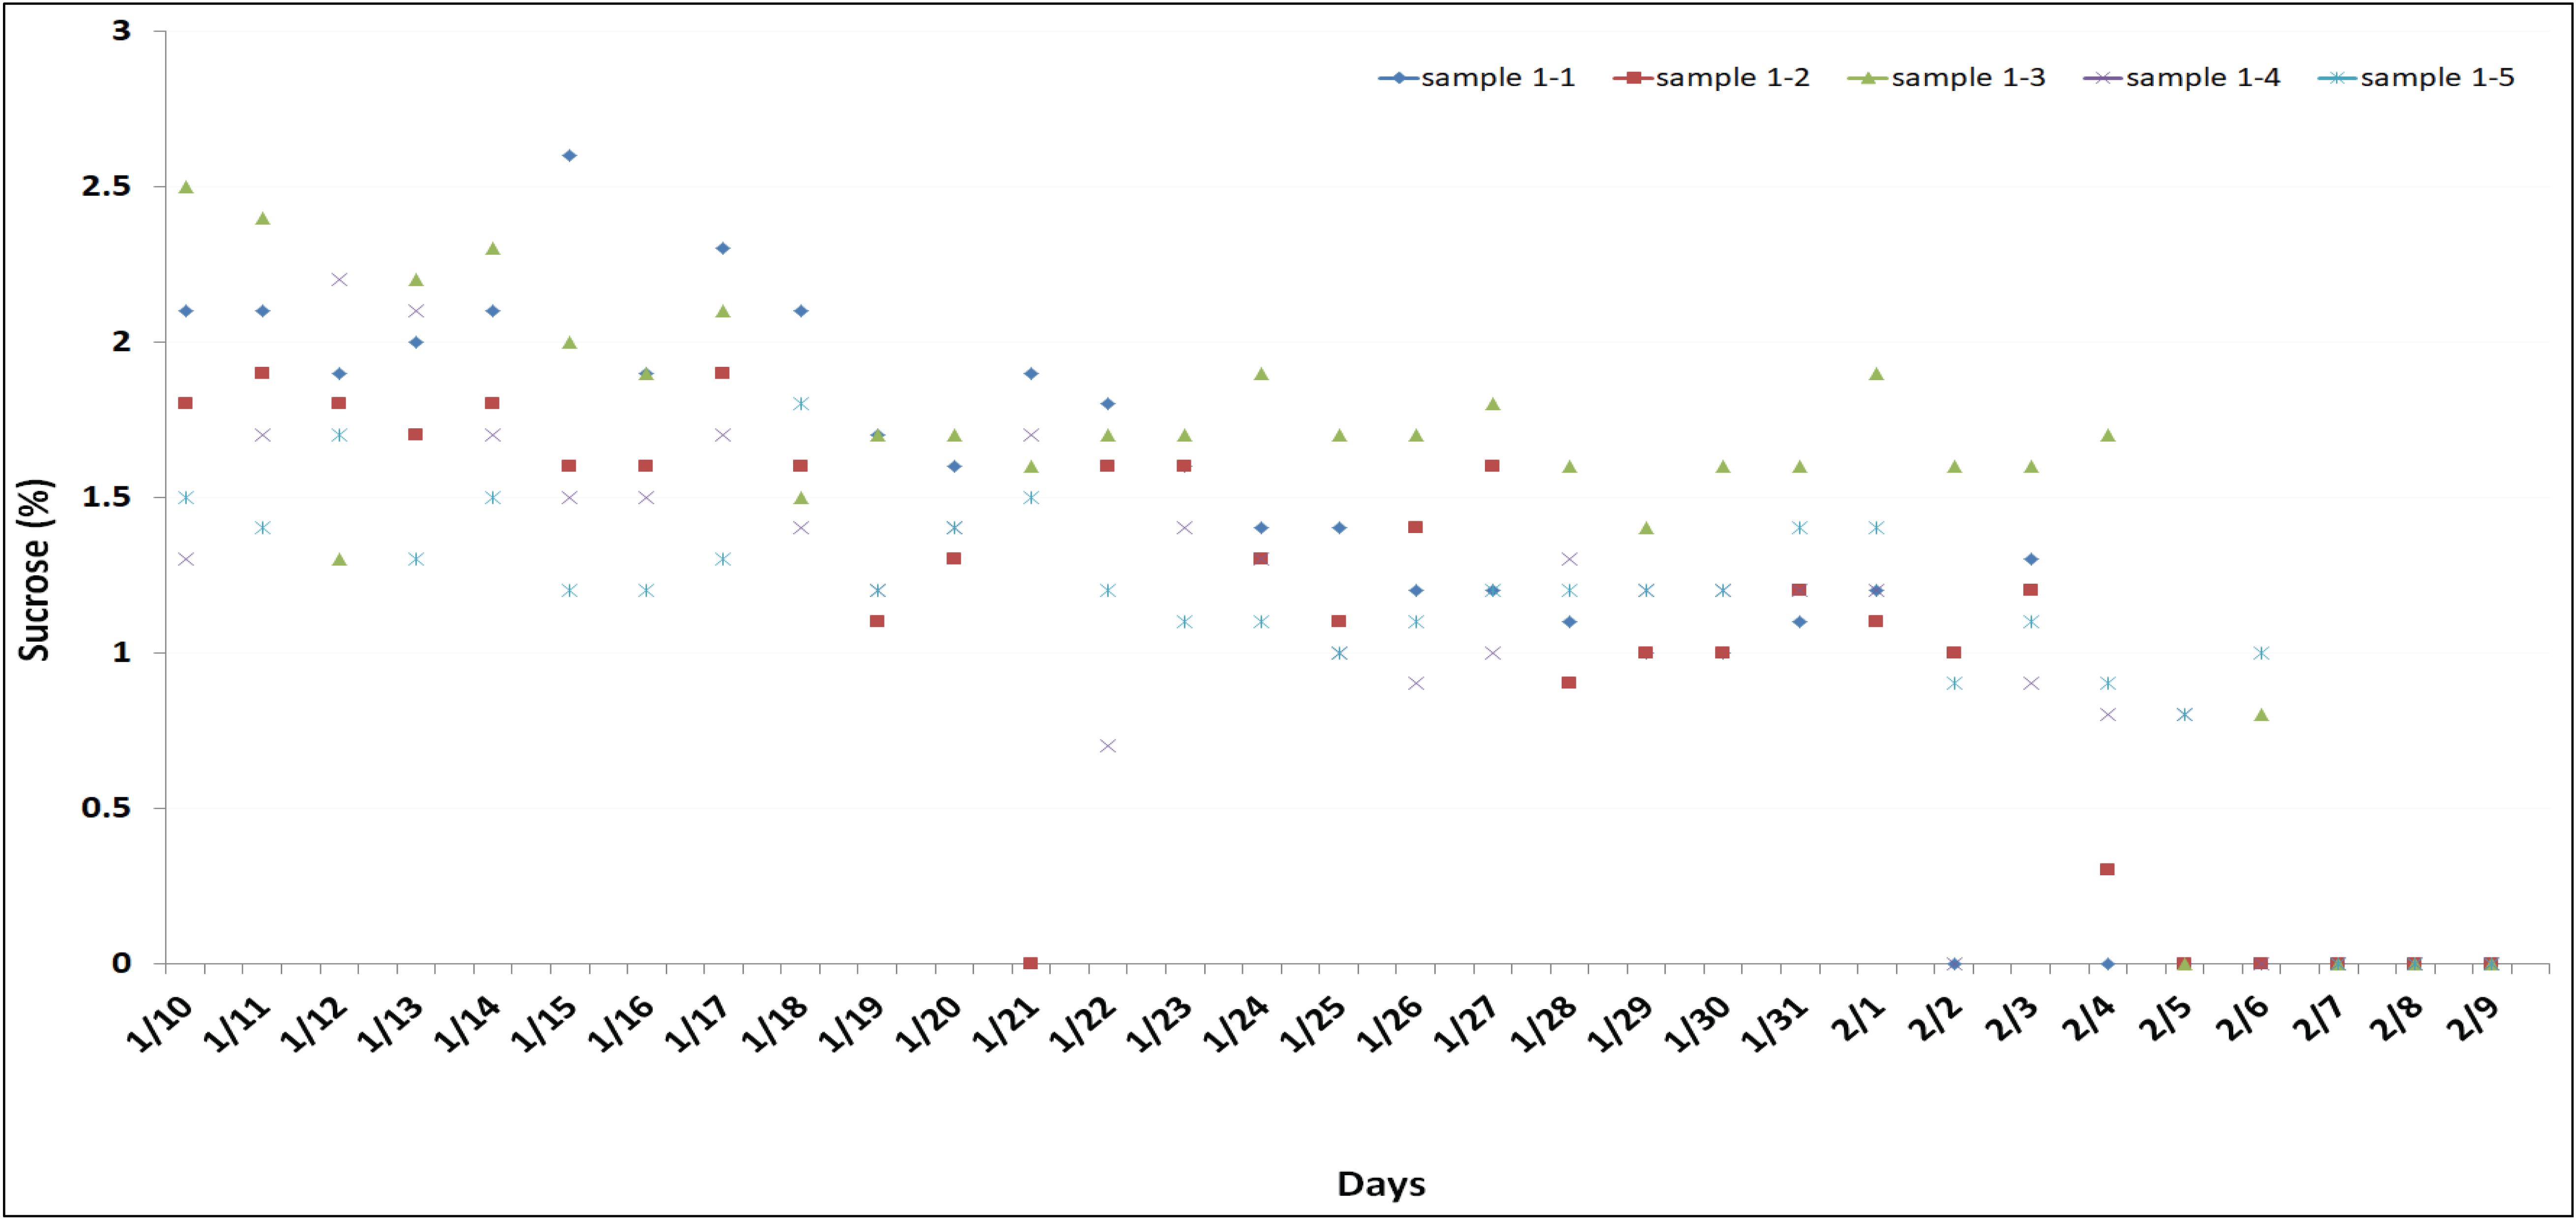
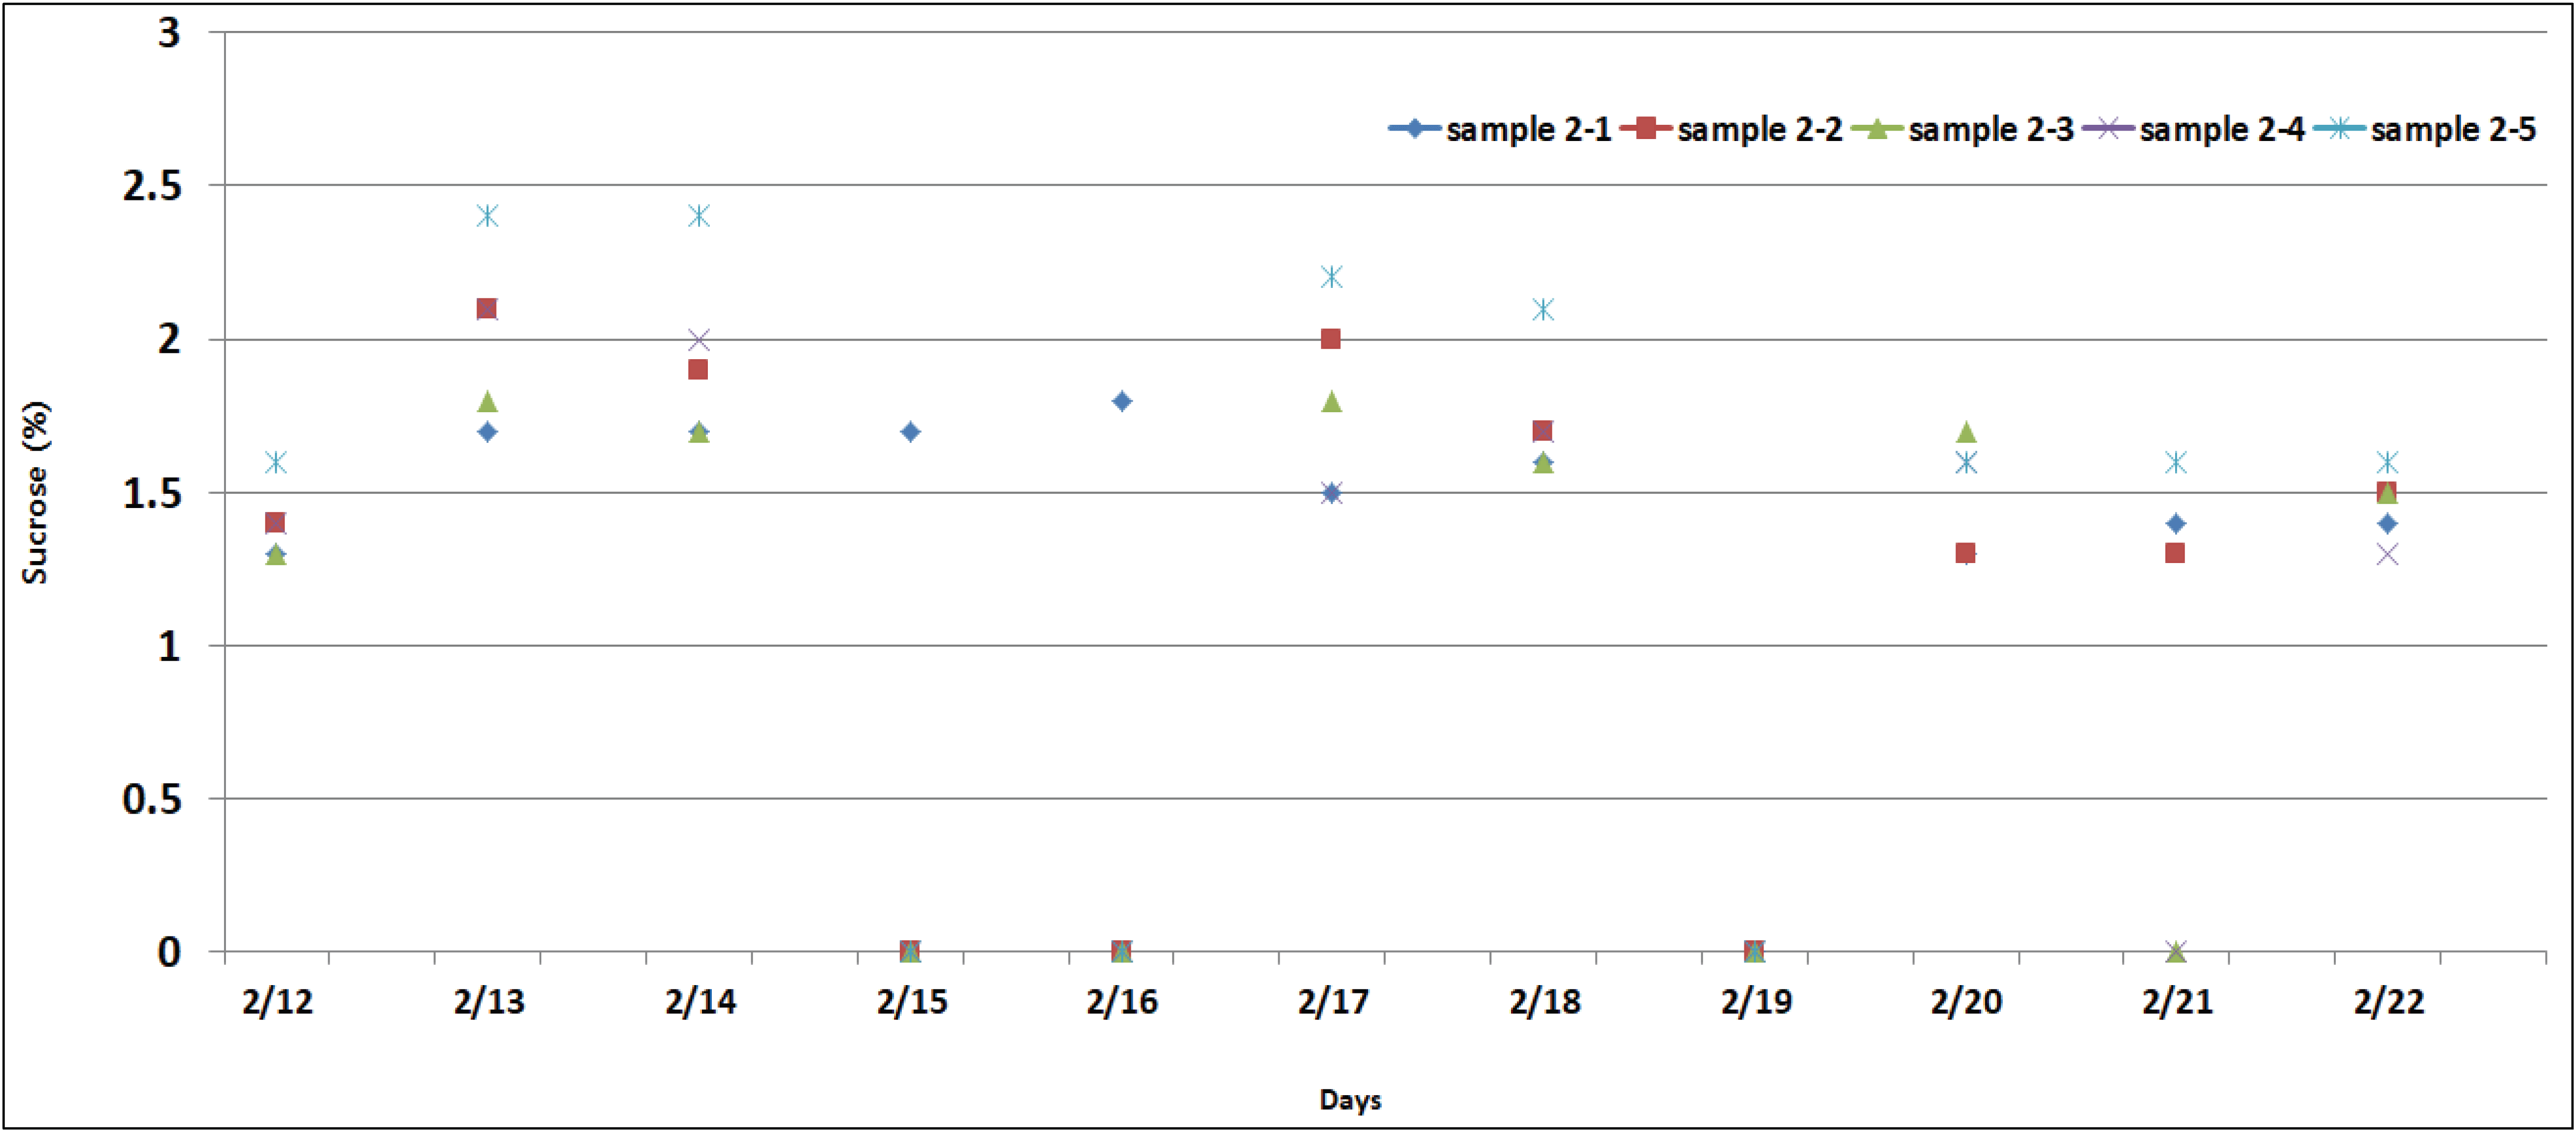
Sucrose content change was analyzed to be 2.5-0.8% depending on the sap collection date (Figs. 4 and 5). We observed relatively high sugar content especially in the beginning, and the concentration decreased towards the latter half of the collection period. This was similar to a report from 2014, which measured the sap collected from the same study site with a saccharometer and found initial increase in sucrose content up to 2.3% and decrease to 1.2% at the end (Kim et al., 2017). The sucrose concentration measured in our study was lower than a study that showed a maximum of 3% sucrose concentration, but the range of A. okamotoanum Nakai sugar content was similar (Moon et al., 2004). The longer the collection period, the lower the sucrose concentration, but there was no correlation between the sucrose concentration and daily sap flow.
wood-48-2-206_F4
Fig. 4. Sucrose concentration of A. okamotoanum sap during the first tapping.
Download Original Figure
wood-48-2-206_F5
Fig. 5. Sucrose concentration of A. okamotoanum sap during the second tapping.
Download Original Figure

The sucrose concentration in phase 2 was also measured at its highest at 2.4% in the early days (February 13) and continued to decrease towards the end (February 22, Fig. 5). The decrease in sucrose concentration over time was also evident in sap collected in phase 2. as a result, there was a notable difference in sap flow between the two collection phases in this study, but the sucrose concentration and the change in concentration based on the collection period showed a similar trend.

3.4. Inorganics analysis

Analysis of eight inorganic elements in the sap showed the highest content of calcium, potassium, magnesium and phosphorus in order, and recorded relatively low levels of sodium, aluminium, manganese, iron and zinc. Previous research also reports that calcium and potassium comprise 81% of inorganic elements in saps (Kim et al., 2010). The potassium concentration in the sap collected in phase 1 was 46.65-79.11 mg/kg, and the content decreased over time. The potassium concentration from phase 2 samples was 60.80-78.12 mg/kg, similar to the case in phase 1. Calcium (25.27-48.14 mg/kg) and phosphorus (7.06-8.59 mg/kg) concentration ranges of samples from phase 1 and 2 were also similar. The Calcium concentration was notably lower than the sap calcium concentration (548 mg/kg) of A. okamotoanum Nakai from Ulleungdo reported by Moon (2004). In case of magnesium, the sap from phase 1 had higher concentration of 17.03-27.25 mg/kg than the same from phase 2 at 10.84-19.99 mg/kg.

4. CONCLUSION

We analyzed the sap flow and composition of artificially planted A. okamotoanum Nakai in Jinju region of Gyeongsangnam-do Province. After collecting the samples in two phases with an interval of 30 days, we observed significant difference in total sap flow amount between the two phases and confirmed that result is closely connected to diurnal temperature variation and temperature conditions. No changes in sugar content or concentration of inorganic elements over collection time were identified. Although the sugar and inorganic element content of A. okamotoanum Nakai in the research site was reported to be lower than the previously reported A. okamotoanum Nakai from Ulleungdo, it is believed to be caused by the characteristics of soil and climate in each region.

Future studies will follow to discover useful and functional ingredients in A. okamotoanum Nakai sap other than sugar and inorganic elements. The results of this study are to be used as base line data for sap resource collection and production.

Appendices

APPENDIX (Korean Version)
진주지역 인공식재 우산고로쇠의 수액 채취 시기별 출수량 및 성분 분석

초록 : 본 연구는 진주시 소재 우산고로쇠 인공림에서의 수액 채취 시기별 출수량 및 구성성분을 분석하기 위해 수행되었다. 수액채취는 한 달 간격으로 2회에 걸쳐 이루어졌으며, 각 회당 채취목은 각각 소경목(흉고직경 10~20 cm) 5본씩 이었다. 일평균 기온이 1.16 ± 2.15°C로 조사된 1차 시기(2019년 1월 10일 ~ 2월 09일)의 수액 총 출수일이 약 32일, 총 출수량은 약 60.59 L로 관찰되었다. 일평균 기온이 2.55 ± 1.30°C로 조사된 2차 시기(2019년 2월 12 ~ 22일)에는 총 출수일이 약 11일이었 으며 총 출수량은 약 13.38 L로 1차 시기 기준의 약 22%에 해당하는 양으로 감소하였다. 1, 2차 채취 시기별 수액의 당 성분 분석 결과 자당(Sucrose)의 함량이 출수초기 최고 2.5%를 나타냈으며 출수 종료시점에는 최소 0.8% 대로 감소하였다. 포도당 (Glucose)과 과당(Fructose)은 Sucrose에 비하여 함량이 낮았으며, 0에 가까운 수치를 나타내었다. 채취 수액의 무기성분 분석 결과, 주요 성분은 칼륨(41.69 ~ 89.75 mg/kg), 칼슘(24.66 ~ 48.14 mg/kg), 마그네슘(10.18 ~ 27.25 mg/kg)이었다. 1, 2차 채취 시기별 수액 간의 sucrose함량 및 무기성분의 함량 범위는 유의적인 차이를 보이지는 않았다. 결과적으로 시기를 달리한 우산고로쇠 수액 채취에 있어서 출수량은 큰 차이를 보였지만 당 및 무기성분 함량의 경우에는 유의적 차이가 나타나지는 않았다.

1. 서 론

수액은 겨울철에서 이른 봄 사이에 얻을 수 있는 임산물로 임업 정책과 관련된 중요 소득원 중 하나이다. 국내에서 수액을 채취하는 대표적 수종은 고로쇠나무이며 아종으로 알려진 우산고로쇠(Acer okamotoanum NAKAI) 및 만주고로쇠(Acer pictum var. truncatum) 등도 주요 수액 생산 수종으로 알려져 있다. 특히 우산고로쇠에서 생산되는 수액의 경우 특유의 인삼향과 상대적으로 높은 당 및 무기성분 함량 등으로 인해 예전부터 단기 소득 작물로 관심이 증대되어 왔다(Kwon et al., 2010). 울릉도에만 자생하는 우산고로쇠의 경우, 주요 수액채취원은 울릉도 천연림이었으나 최근들어 내륙지역에서의 우산고로쇠 수액 생산을 위한 인공조림 수요가 증가하고 있는 실정이다.

국립산림과학원 산림바이오소재연구소에서는 내륙에서의 우산고로쇠 적응성 및 생장 조건을 구명하기 위해 2005년 진주시 가좌연구시험림에 우산고로쇠 인공 조림지를 조성하였다(Yoon et al., 2012). 그리고 식재 후 9년이 지난 후 수액 채취가 가능한 흉고 직경 10 cm에 도달되는 것을 확인 할 수 있었다(Lim et al., 2016).

수액 출수에 가장 큰 영향을 주는 인자는 기온으로 알려져 있다(Choi et al., 2010). 수액의 대표적 생산지인 지리산 지역의 경우 일평균기온 1.2 ± 1.6°C, 일 최저기온이 –4.3 ± 1.5°C, 일 최고기온이 11.8 ± 1.9°C에 만족하는 2월 중순을 최적 출수기간으로 보고한 바 있다(Choi et al., 2010).

그러나 각 지역마다 평균 기온 및 일교차가 상이하므로 적정 수액을 생산하기 위한 천공 시기는 다르다. 본 연구의 조사지에 대해서도 적정 수액량을 최적으로 생산할 수 있는 천공 시기를 예측하기 위해 2014년부터 매년 출수량 및 성분 분석에 대해 모니터링 해오고 있다. 현재까지 확인된 결과로는 출수 임계점으로 일 평균기온 3.42°C, 일 최저기온 –2.14°C, 일 최고기온 10.60°C를 제시하였으며 경남 진주지역 기온의 30년간 평년값을 고려하여 수액 채취시기를 1월 하순 ~ 2월 중순으로 권장한 바 있다(Kim et al., 2017).

본 연구에서는 진주지역에 인공 식재된 우산고로쇠를 30일 간격으로 1차와 2차로 나뉘어 천공하여 수액채취를 실시하였다. 천공시기에 따른 수액 출수량 조사와 함께 성분 분석 등을 수행함으로써 내륙지역에서의 우산고로쇠수액 연구의 기초자료로 활용하고자 하였다.

2. 재료 및 방법
2.1. 시험지 및 공시목

본 연구의 대상지는 경남 진주시에 위치한 국립산림과학원 산림바이오소재연구소 가좌시험림의 조림지로 해발 112 m, 동북사면 경사는 32 °C 계곡부의 위치한 곳에 2005년에 조림한 우산고로쇠를 공시목으로 소경목(흉고직경 10~20 cm)에 해당하 는 수목이며 1차 채취와 2차 채취에 각각 5본씩 사용되었다(Table 1).

2.2. 수액 채취 및 기상인자 수집

공시목은 소경목(흉고직경 10~20 cm)에 해당하는 수목이며 1차 채취와 2차 채취에 각각 5본씩 사용되었다.

수액 채취를 위한 천공작업은 산림청의 수액채취요령에 따라 지제부에서부터 1 m 높이에서 이뤄졌으며 8 mm의 드릴을 사용하였다. 천공의 개수는 2개까지 허용이 되나 본 연구에서는 1개로 정하였으며 8 mm 규격 호스를 사용하였다. 1차 채취작업 은 2019년 1월 10일부터 2019년 2월 09일까지 실시하였고 2차 채취작업은 1차 수액 측정이 완료된 후인 2019년 2월 12일부터 2019년 2월 22일까지 실시하였다. 오전 11시에 천공 작업을 실시 한 후 24시간마다 수액 출수량을 정확히 메스실린더를 이용하 여 측정하였다. 일일 기온과 상대습도 등은 미기상 측정장비(WH-2300S, CHANJU TECH Co., China)를 설치하여 측정하였다.

2.3. 당분석 (Sugar analysis)

각 조사목으로부터 24시간 마다 수집된 수액을 당 함량 분석과 무기원소 분석에 사용하였다. 수액은 출수량 측정 후 바로 0.45 μm 투과막 필터로 여과한 다음 100분의 1로 희석하여 Bio-LC(Dionex, 2000)를 이용하여 당성분을 분석하였다. 정량분석을 위해 표준물질로 포도당(glucose, sigma), 과당(fructose, sigma), 자당(sucrose, sigma)을 사용하여 검량선을 작성하였다. 컬럼은 MA1(250 x 4 mm, Dionex, Palo Alto, CA, USA)를 사용하였으며 검출기로는 amperometry detector(HP 1100, Hewlett Packard, USA)를, Eluent solution으로는 sodium hydroxide 617 mmol을 사용하였다. 분석은 40°C에서 수행하였고 flow rate는 0.4 mL/min로 수행하였다. sample는 10 μL를 투입하였고 분석은 2 반복으로 수행하였다.

2.4. 무기원소 분석(Analysis of inorganics)

무기원소 분석 또한 각 조사목으로부터 24시간마다 수집된 수액을 0.45 μm 투과막 필터로 여과한 뒤 200분의 1로 희석하여 유도결합 플라즈마 질량분석법(ICP-MS, Inductively coupled plasma mass spectroscopy, ANALYTIKJENA, Germany)를 이용 하여 분석하였다.

3. 결과 및 고찰
3.1. 시험지 및 공시목

조사지의 임분 특성을 살펴보면 우산고로쇠 본수는 헥타르(ha) 당 1,333본으로 조사되었다. 이 중 출수량 조사를 위해 소경목 에 해당하는 10개의 조사목을 선정하였다. 2019년 현재 조사목들의 식재연수는 14년이고 평균 수고 12.8 m, 평균흉고직경 15.84 cm, 재적은 본당 0.056 m3, 평균 지하고 2.77 m, 수관은 7.09 m 로 조사되었다(Table 3).

3.2. 수액 출수와 기온인자간의 상관관계

수액 채취시기를 1차와 2차로 구분하여 관찰한 결과 총 출수일과 출수량에서 차이를 보였다. 1차시기에는 32일(1월 10일 ~ 2월 09일)동안 출수되는 경향을 보인 반면 2차시기에는 11일(2월 12 ~ 22일) 동안만 출수되는 경향을 보였다. 총 출수량을 관찰한 결과 1차 시기에는 60.59 L가 출수되었으며 2차 시기에는 약 13.38 L로 확인되었는데 현재 산림청에서 권고하는 소경목 수액 생산량인 1,250(ml/일)을 기준으로 봤을 때(Lim et al., 2016), 2차 시기에는 현저히 적은 양이 관찰되었다.

이는 각 개체간의 차이 때문 일 수도 있겠지만 가장 중요한 인자로 알려진 기온 때문이라고 판단된다(Choi et al., 2012). 조사지에서 확보한 미기상 인자 중 기온데이터를 확인한 결과 1차 수액 채취 기간의 경우 총 출수일의 평균 일일기온이, 앞서 보고(Choi et al., 2010)된 최적 출수 일평균기온(1.2 ± 1.6°C)과 유사한 1.16 ± 2.15°C인 반면 2차 기간의 경우는 2.55 ± 1.30°C 였다. 1차 출수기간을 10일 단위로 나뉘어 수액 출수량을 살펴본 결과 1월 10 ~ 20일 29.4 L, 1월 21 ~ 31일 25 L, 2월 1 ~ 10일에는 5.3 L로 총량의 90%가 1월에 출수되는 경향을 보였다. 특히 이전 연구에서 일평균 기온이 3.42°C 이상일 때 수액의 출수량이 급격히 감소되는 것을 확인하였는데(Kim et al., 2017), 2019년 2월의 경우 3일부터 일평균 기온이 임계점 이상인 것으로 확인되어 1월에 비해 2월의 출수량이 급격히 감소한 것으로 판단된다.

1차 채취 기간 중 1월의 일일 평균 수액 출수량은 2.5 L 이었고 1월 12, 16, 17, 20, 21, 25, 26, 31일의 수액 출수량은 평균 출수량에 다소 못미치는 경향을 보였다. 이와 같은 현상은 일교차와 연관지어 살펴 볼 필요가 있다. 수액은 영하의 밤과 영상의 낮 기온의 일교차 범위 내에서 출수된다고 알려져 있다. 이전 연구에서 최저기온 –4.3 ± 1.5°C, 일 최고기온이 11.8 ± 1.9°C 범위일 때 출수량이 가장 많다고 보고되었는데 본 연구의 경우 평균 출수량 이하를 나타낸 날의 최고기온이 4.3°C ~ 7.6°C의 범위(Fig. 2)로 상대적으로 온도가 높았으며 일교차가 적었기 때문에 출수량이 낮았을 것으로 판단된다.

일교차의 영향은 2차 채취 결과에서도 확인 할 수 있었다. 일일 평균 출수량은 1.33 L로 1차에 비해 절반가량에 해당하는 양으로 확인되었고 2월 14, 15, 16, 20, 21, 22일은 평균에 미치지 못하는 수액 출수량이 관찰되었다(Fig. 3). 2월의 경우에는 상기에 제시된 적정 일 최고기온 범위에 해당하는 날이 대부분이었지만 최저온도의 범위가 –2.5 ~ - 0.4°C로 높게 나타나 출수량이 감소하였을 것으로 판단된다. 결과적으로 본 연구를 통해서 일 평균 기온 및 일교차 조건의 중요성을 확인 할 수 있었고, 출수량이 높았던 날의 최저기온은 -4.3 ± 1.77°C, 최고기온은 8.30 ± 0.80°C로 확인되었다.

3.3. 당함량 분석
Sucrose 함량 분석

매일 수집된 수액은 바로 당 분석(Bio-LC)과 무기원소 분석을 수행하였다. 수액에 포함되어 있는 당으로는 대표적으로 glucose, fructose, sucrose가 있으며 그 중 sucrose의 함량이 가장 높으며 당도를 결정하는 중요 인자로 알려져 있다. 상기의 대상 수액을 분석한 결과, 위의 세 당류 중 sucrose의 함량이 가장 높게 관찰되었으며 glucose, fructose 순으로 확인되었다. 국내 우산고로쇠수액의 당 분석 결과가 많이 보고되어 있지는 않지만 일부 발표된 결과들에 의하면 울릉도 지역에서 생산된 수액의 경우 sucrose만 포함되어 있다고 보고되었다(Moon et al,. 2004). 이러한 차이는 생산지 특성 보다는 분석 방법 등에 의한 차이에 의한 결과라고 판단된다.

출수 날짜에 따라 sucrose 함량 변화를 살펴본 결과 2.5~0.8%로 분석되었다(Figs. 45). 특히 출수 초기에 상대적으로 당 함량이 높게 관찰되었고 출수일 후반부로 갈수록 농도가 낮아졌다. 이는 2014년 동일 조사지에서 출수한 수액을 당도계로 측정하였을 시 출수 초기 당도가 2.3%까지 증가하였고 출수 종료시점에는 약 1.2%까지 낮아진다는 보고와(Kim et al., 2017) 유사한 결과를 나타내었다. 본 연구에서 측정된 sucrose 함량은 울릉도 산지에서 출수한 수액의 경우 최고 3%의 sucrose 결과를 보였다는 결과에 비해 다소 낮지만 고로쇠수액의 당 함량과는 유사한 범위를 보였다(Moon et al,. 2004). 출수일이 증가할수록 sucrose 함량은 낮아졌지만 일별 출수량과의 상관성은 확인하지 못하였다.

채취 기간에 따른 수액 내 당 함량을 살펴보면 2차 시기 수액의 경우에도 sucrose 함량이 초기(2월 13일)에는 최고 2.4%까지 나타내었고 후반부(2월 22일)로 갈수록 낮은 함량을 나타내었다(Fig. 5). 2차 시기 또한 출수일의 경과에 따라 sucrose 농도가 감소하는 경향을 나타내었다. 결과적으로, 본 연구에서 설정한 두 채취 기간 간 수액 출수량에는 큰 차이가 있었지만 sucrose의 함량 및 채취일에 따른 sucrose 함량 감소 변화는 유사한 경향을 나타냈다.

3.4. 무기성분 분석

수액 내 존재하는 8가지 무기성분을 분석한 결과 칼슘, 칼륨, 마그네슘, 인 순으로 함량이 높게 관찰되었고 나트륨, 알루미늄, 망간, 철, 아연의 함량의 상대적으로 낮게 관찰되었다. 이전 보고를 통해서도 수액 내 칼슘과 칼륨의 함량이 전체 무기성분 중 81%를 차지하는 것으로 알려져 있다(Kim et al., 2010). 특히 1차 채취 수액의 경우 칼륨의 농도가 46.65 ~ 79.11 mg/kg 로 확인되었으며 출수일이 후반부로 갈수록 함량이 다소 낮아지는 경향을 나타냈다. 2차 채취 수액의 칼륨 농도는 60.80 ~ 78.12 mg/kg으로 1차 시기의 경우와 유사한 농도 범위를 보였다. 그 외의 칼슘(25.27 ~ 48.14 mg/kg)과 인(7.06 ~ 8.59 mg/kg)의 농도 또한 1, 2차 채취 수액 모두 유사한 농도 범위를 나타내었다. 칼슘의 경우, 이전 Moon 등(2004)이 보고한 울릉도산 우산고로쇠 수액의 칼슘 농도(548 mg/kg)에 비해서는 크게 낮게 나타났다. 마그네슘의 경우에는 1차 채취 수액이 17.03 ~ 27.25 mg/kg로 2차 채취 수액의 10.84 ~ 19.99 mg/kg보다 다소 높은 농도를 나타내었다.

4. 결 론

경남 진주지역에 인공식재된 우산고로쇠의 수액 출수량과 구성성분을 분석하였다. 채취 시기를 30일 간격으로 달리하여 두 번 채취해 본 결과, 두 채취 기간 간의 총 출수량의 차이가 크게 확인되었고 이는 일교차 등 기온 조건과 밀접하다는 결과를 확인할 수 있었다. 또한 채취 시기에 따른 수액 내 당 및 무기성분 함량의 유의적인 차이는 확인 수 없었다. 다만 본 연구 대상지에 인공 식재된 우산고로쇠의 수액의 당이나 무기성분 함량이 기존 보고된 울릉도산 우산고로쇠 수액보다 다소 낮게 관찰되었는데 이는 지역마다 지닌 토양, 기후의 특성 때문이라고 판단된다.

차후 우산고로쇠 수액 내 존재하는 당, 무기성분 이외 유용 기능성분 구명 연구를 추가적으로 수행할 예정이며 본 결과는 수액 자원의 발굴, 조성을 위한 기초자료로 활용하기 위해 사용될 것이다.

References

1.

Choi W.S, Park M.J, Kim H.Y, Choi I.G, Lee H.J, Kang H.Y. Factors Affecting Acer mono Sap Exudation: (II) Hamyang Region in Korea. Journal of the Korean Wood Science and Technology. 2010; 38(4):349-358.

2.

Choi W.S, Choi I.G, Park M.J. Factor Affecting Sap Exudation of Juglans Mandsburica and Acer Mono: (III) Inje Region in korea. Journal of the Korean Wood Science and Technology. 2012; 40(6):378-388.

3.

Choi W.S, Park M.J, Lee H.J, Choi I.G, Kang H.Y. Factors Affecting Acer mono sap Exudation: Kwangyang Region in Korea. Journal of the Korean Wood Science and Technology. 2010; 38(1):66-74.

4.

Kim C.H. Characteristics of Sap Exudation from Acer okamotoanum (Nakai) Plantation Forest in Jinju Region. Journal of the Korean Wood Science and Technology. 2017; 45(3):308-316.

5.

Kim H.Y, Kim S.H, Gwak K.S, Park M.J, Choi W.S, Kang H.Y. Change in chemical composition of Acer mono saps collected in different region and time depending on storing period. Journal of the Korean Wood Science and Technology. 2010; 38(1):75-84.

6.

Kwon S.D, Kim J.K, Moon H.S. Vegetation Structure and Soil Condition of Acer okamotoanum Communities in Ulleung Island. Journal of Agriculture & Life Science. 2010; 44(5):15-22.

7.

Lim J.H, Cho J.H, Kwon J.N, Kim Y.S, Kang W.S, Byun Y.S, Kim J.H, Shin M.H, Jeon J.H, Ko S.H, Seo S.T, Park Y.B, Lee K.S, Lee K.T, Shim D.H, Kong W.S, Park B.S, Kim H.W. In: Nam S.H, editor. economic tree species⑧ Acer pictum subsp. mono. A Research Paper Series 93 in . 2016 Seoul, Korea: National Institute Of Forest Science. .

8.

Moon H.S, Kwon S.D. Sap Collection and Major Components of Acer okamotoanum Nakai Native in Ullungdo. Korean Journal of Medicinal Crop Science. 2004; 12(3):249-254.

9.

Yoon J.H, Kwon S.D, Jeon K.S, Kang J.H, Cho M.K, Moon H.S. Comparison of Growth Characteristics Between Natural and Plantation Stand on Acer okamotoanum. Journal of Agriculture & Life Science. 2012; 46(1):83-90.