


1. INTRODUCTION
Urea-formaldehyde (UF) resins adhesive, one of the established amino resins, is most widely used in the manufacture of wood-based panel owing to their low cost, high reactivity, good performance, and easy to use (Dunky, 1998; Gonçalves et al., 2018). UF resins adhesive is commonly prepared using an alkaline-acid (addition-condensation) two-step reaction (Gonçalves et al., 2019; Kim, 1999). The addition (or hydroxymethylation) reaction usually takes place at alkaline condition, while the condensation reaction occurs at acid pH (Gonçalves et al., 2019; Kim, 2001; 2000; 1999). Various research on UF resins were done in the last few decades. For example, resin preparation (Chiavarini et al., 1978; Marvel et al., 1946), reaction mechanism (de Jong and de Jonge, 1952), resin structure (Chuang and Gary, 1992; Jada, 1988; Minopoulou et al., 2003; Pratt et al., 1985), curing kinetic studies (Crowe and Lynch, 1948; Smythe, 1952, 1951; Park et al., 2003; Siimer et al., 2003), resin’s morphology (Park et al., 2011), thermal degradation (Lady et al., 1960), and resin’s stability toward hydrolysis (Myers, 1986) were done.
Even though UF resins possess an adverse impact of formaldehyde emission (Salthammer, 2019), the demand of UF resins is still growing because of a steady increase in wood-based panel production (FAO, 2018; Gonçalves et al., 2018; Mantanis et al., 2018). However, the regulation of formaldehyde emission from UF resin-bonded panels in many countries is currently getting strict (Ferra et al., 2010; Salthammer, 2019). As the result, many studies have been focused on the reduction of formaldehyde emission from UF resin-bonded panels, In particular, lowering formaldehyde to urea (F/U) molar ratio (Mao et al., 2013; Myers, 1984; Park et al., 2006; Pizzi and Valenzuela, 1994; Que et al., 2007) was accepted as one of the main approach. But, low F/U mole ratio UF resins tend to have longer gelation time, slow curing, and low cross-linking density (Park and Kim, 2008), resulting in a poor strength at the expense of low formaldehyde emission (Myers, 1984; Park et al., 2013).
In theory, formaldehyde is hydrated to form methylene glycol (CH2(OH)2) and the urea forms its anion (H2N-CO-NH-) at the initial reaction (Smythe, 1952, 1951). A certain amount of CH2(OH)2 is then reacted reversibly with H2N-CO-NH- to form monohydroxymethyl urea (H2N-CO-NH-CH2OH). Further reaction leads to the formation of di-hydroxymethyl urea (HOH2C-H2N-CO-NH-CH2-OH) or tri-hydroxymethyl urea (HOH2C-H2N-CO-NH-(CH2OH)2) during the addition reaction. The formation of mono-, di-, and tri-hydroxymethyl ureas of 1.0~1.2 F/U mole ratio UF resins were counted for around 25%, 63%, and 12%, respectively, at the addition reaction (Gonçalves et al., 2019; Kim, 1999; Wang et al., 2018). It was also shown that the addition reaction kinetics followed the secondorder and was proportional to the initial F/U molar ratio, showing that less formaldehyde had been reacted at lower initial F/U molar ratio, and resulting in poor performance of UF resins (Chiavarini et al., 1978; de Jong and de Jonge, 1952). These results indicated that initial F/U mole ratio had played an important role in determining the performance of UF resins.
UF resin adhesives are generally synthesized at an initial F/U mole ratio of 2.0 or greater. A few limited studies were done on the use of higher initial F/U mole ratios (Khonakdar Dazmiri et al., 2019; Smythe, 1952). Since urea has four reactive sites, there is a possibility to use higher initial F/U mole ratios up to 4.0. But, no results have been reported on the presence of tetra-hydroxymethyl ureas (Pizzi, 1983). In this study, we divided the initial molar ratio into the first initial molar ratio and the second initial molar ratio to understand the impact of initial molar ratio. The first and second initial F/U molar ratio refers to the initial F/U molar ratio before and during the addition reaction during their synthesis, respectively. Therefore, this study focused to investigate effects of different the first initial F/U mole ratios (2.0, 3.0, and 4.0) and two levels of the second initial F/U molar ratios (2.0 and 1.7) on the performance of low F/U molar ratio (1.0) of UF resins. Basic, thermal curing, and chemical properties of UF resins were characterized to understand the effect of two different initial F/U mole ratios for the addition reaction on the performance of UF resins. The adhesion strength, formaldehyde emission, and bond-line features of low molar ratio UF resins were evaluated in plywood. Statistical analysis was also done to obtain an optimum initial F/U mole ratio for a better performance of 1.0 F/U mole ratio UF resins in plywood.
2. MATERIALS and METHODS
Extra pure grade of urea (99%) and formalin (37%), and aqueous solution of sodium hydroxide (20 wt%) and formic acid (20 wt%) were used to adjust the pH in the synthesis of UF resins. Hardener used in this study was aqueous solution of ammonium chloride (20 wt%). A standard solution of sulfuric acid (0.5 N), an aqueous solution of sodium sulfite (1.0 M), and an aqueous solution of thymolpthalein indicator (0.1 wt%) were used for determination of free formaldehyde in the resins. All chemicals were obtained from Daejung Chemical, Korea. For molecular weight analysis, high-performance liquid chromatography (HPLC) grade of N,N-dimethyl formamide (DMF, 99.9%) and dimethylsulfoxide (DMSO, 99.9%) were obtained from Thermo Fisher Scientific. Poly(ethylene glycol) standards (Polymer Standards Service GmbH, Mainz, Germany,) with molecular weight between 106~25,200 g/mole were used as the universal calibration for their molecular weight analysis. Radiata pine (Pinus Radiata D. Don) veneers (300 × 300 × 2 mm of size; 6.2% of moisture content) were used to prepare three-ply plywood.
Total six low molar ratio UF resins were prepared by the combination of three levels of the first initial F/U mole ratios (i.e., 2.0, 3.0, and 4.0) and two levels of the second molar ratios before and during the addition reaction. The first and second initial F/U molar ratio used in this study are presented in Table 1.
| 1st Initial F/U mole ratio | 2nd Initial F/U mole ratio | Final F/U mole ratio |
|---|---|---|
| 2.0 | 2.0 | 1.0 |
| 3.0 | ||
| 4.0 | ||
| 2.0 | 1.7 | 1.0 |
| 3.0 | ||
| 4.0 |
Briefly, formalin in four-neck reactor under stirring was mixed with three different amounts of the first urea to obtain three levels of the first initial molar ratio, and then followed heating to 40 °C with the rate of 2 °C/min and adjusting the pH to 8.0. After reaching 90 °C in around 25 min, two different levels of the second urea were added to the reactor to have the second F/U molar ratio of 2.0 and 1.7, respectively. Then the pH was adjusted to 8.0 using sodium hydroxide for the addition reaction for 1 hour. Then, the pH was reduced to 4.9 using formic acid for the condensation reaction to obtain a target viscosity of ‘J-K’ scale of a bubble viscometer (VG-9100, Gardner-Holdt Viscometer, FL, United States). The third urea was added to obtain the final F/U mole ratio of 1.0. Then the resin was cooled to 25 ± 2°C, and the pH was adjusted to 8.2. The UF resin adhesives prepared were stored in 1-L bottle and conditioned at room temperature for 24 hours prior to analysis and use.
Properties of UF resins at different the first and second initial F/U mole ratios, such as the non-volatile solids content, viscosity, gelation time, pH, and specific gravity were measured according to the published method (Park and Kim, 2008). Free formaldehyde of UF resins was determined according to a standard procedure (TAPPI, 2001). Briefly, around 10 g of resin was weighed into a 100-mL beaker, and then was diluted with 25 mL distilled water. Around 5-7 drops of thymolpthalein indicator was mixed with the sample, and then 50 mL of sodium sulfite was added into the beaker to change the color from white to blue. The sample was immediately titrated with sulfuric acid until the color changed from blue to white. Each experiment was repeated three times.
The functional groups of liquid and cured UF resins at different levels of the first and second initial F/U mole ratios were investigated using ATR-FTIR (Alpha P, Bruker Alpha, Germany) and FTIR spectroscopy (Frontier, Perkin Elmer, MA, United States), respectively. The cured UF resins were scanned from 4000 to 400 cm-1 in KBr pellets with a resolution of 4cm-1 and 32 scans per sample. A minimum–maximum method was used to normalize each spectrum. The normalized intensity change of specific functional group was calculated by dividing its normalized intensity with the normalized intensity of –C=O at 1630-1640 cm-1(Lubis and Park, 2018b).
The molecular weight (MW) of UF resins prepared was determined using a gel permeation chromatography (GPC) system (YL9100, Younglin, Seoul, Korea). The GPC samples were prepared by dissolving 0.1 g of UF resins with a mixture of 0.9 g DMSO and 9.0 g DMF (Jeong and Park, 2017a; 2016). The analytical condition was set at 50°C, with a 0.5 mL/min flow rate of DMF as the mobile phase. The average molecular weight (Mw, Mn) and polydispersity index (PDI) were calculated using YL-Clarity chromatography software.
An X-ray diffractometer (XRD) (D/Max-2500, Rigaku, Tokyo, Japan) with CuKα radiation source (λ= 0.15406 nm) was used to obtain the XRD patterns and to calculate the crystallinity of cured UF resins. The samples were cured in oven at 105 °C for 3 h and were powdered using a grinder. The XRD patterns of cured UF resins were obtained at room temperature, in the range of 0° to 50°, with a step of 0.02°/min. The degree of crystallinity of UF resins at different initial F/U mole ratios and synthesis methods was obtained by applying Gaussian function to resolve the XRD diffractograms.
A differential scanning calorimetry (DSC) (Discovery 25, TA Instruments, DE, United States) was used to investigate the curing kinetics of UF resins at different initial F/U mole ratios and synthesis methods. Approximately 5~7 mg of liquid UF resins mixed with 3% of ammonium chloride (based on the solids content of UF resins) was sealed in a high-pressure capsule pan and then heated from 30 to 200 °C. DSC analysis was performed at four different heating rates of 2.5, 5, 10, and 20 °C/min under a nitrogen flow of 50 mL/min. The reactivity of UF resins at different levels of the first and second initial F/U mole ratios was also predicted by calculating their activation energy (Ea) using Kissinger and Isoconversional (Kissinger-Akihara- Sunose, KAS) method. The following equation (1) is used to calculate the Ea using Kissinger method (Kissinger, 1957):
where β is the heating rate (K/s) and Ea is the apparent activation energy (kJ/mole). Ea can be calculated from a straight line between ln (β/Tp2) and –1/Tp.
The following equation is used to calculate Ea using Isoconversional (KAS) method (Akahira and Sunose, 1971; Kissinger, 1957). The method requires a series of experiments at multiple heating rates and yields Eα values as a function of the degree of conversion(α), as shown in Equation(2):
The subscript i represents the different heating rates (β). Eα can be calculated from the slope of the plot of ln (βi/Tpi2)against - (1/Tpi).
A total of twelve plywood panels were fabricated using Radiata pine veneers and UF resins with six different initial F/U mole ratios for evaluation of tensile shear strength and formaldehyde emission. Three-ply plywood with a target size of 300 × 300 × 6 mm was prepared using a glue spread of 170 g/m2. The panel was cold-pressed at 0.8 MPa for 20 min and then hot-pressed at 120°C and 0.8 MPa for 4 min. Plywood panels were conditioned at 20 °C for 24 hours prior to analysis.
Tensile shear strength (TSS) and formaldehyde emission (FE) of plywood was determined according to Korean Standard F 3101 (KS, 2016). Ten specimens from a panel were prepared for the TSS measurement. The TSS values were examined using a universal testing machine (H50KS, Redhill, Bristol, England) at a cross-head speed of 2 mm/min. The FE values were determined by placing ten specimens from another panel in a desiccator at 20 ± 2°C for 24 hours. Approximately 25-mL aliquot solutions were pipetted into 100-mL flasks, and then 25 mL acetyl acetone–acetic acid ammonium solutions were subsequently added to the flask. The solutions were heated at 65 ± 2°C for 10 min in a water bath. The solutions were finally cooled to room temperature and were analyzed using UV–visible spectrophotometry (Optizen 3220 UV, Mecasys, Seoul, Korea) at a wavelength of 412 nm to determine the FE values.
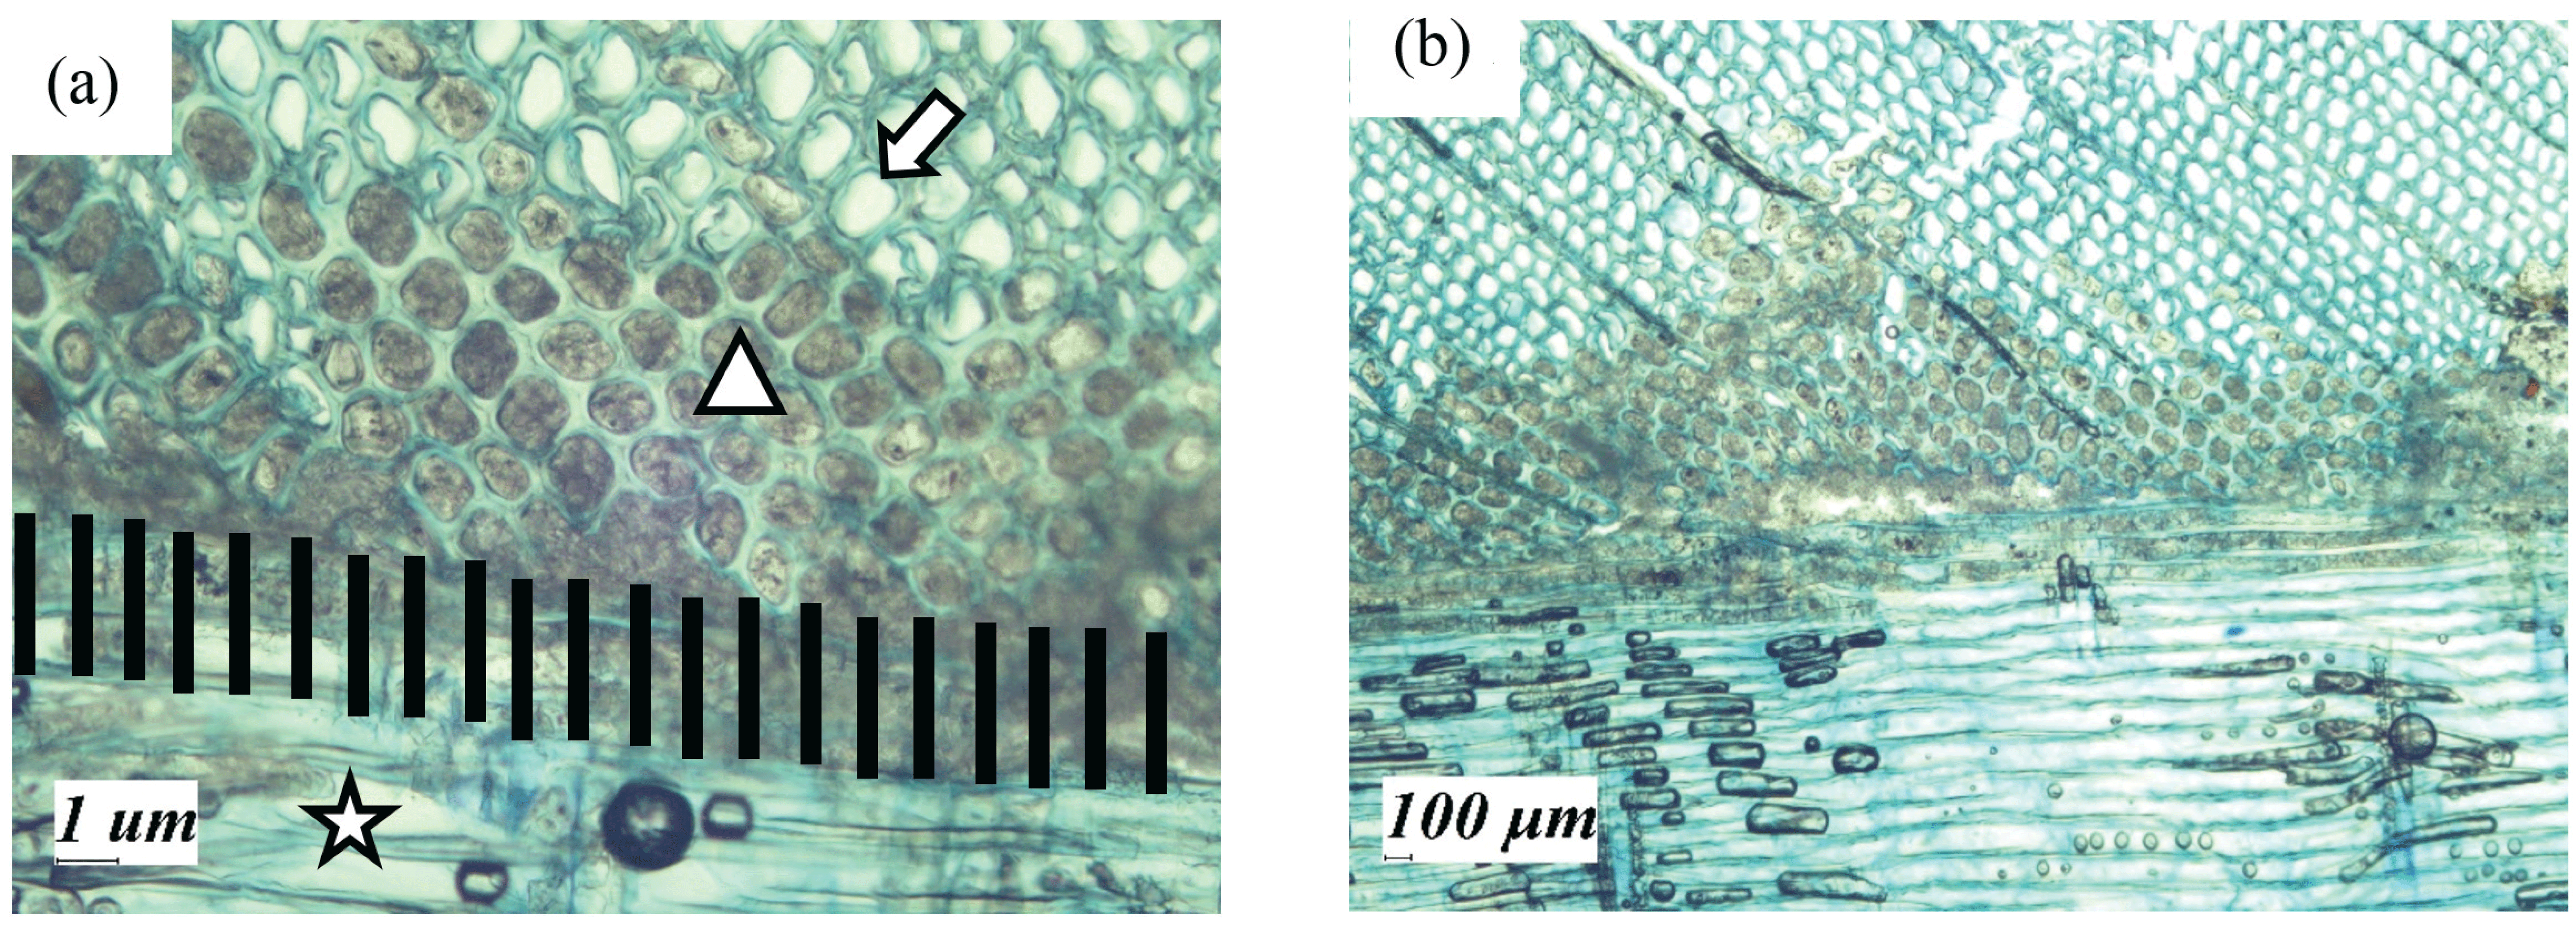
Around twenty cross sections (6000 × 6000 × 70 μm) of three-ply plywood were prepared to investigate the bond-line features under a light microscope (LM) (Olympus Optical Co, Ltd., Tokyo, Japan) according to the published method (Nuryawan et al., 2014). Around twenty images were digitally captured for each sample. The average value and standard deviation for the resin penetration and bond-line thickness of UF resins in plywood was calculated using an image-processing software (IMT solution ver.22.5, British Columbia, Canada).
The mean values of plywood properties were compared using analysis of variance, and Duncan multiple range test at α= 0.05 was applied to compare levels of the first and second initial F/U mole ratio for UF resins. Statistical analysis was performed using SPPS 17 software (SPSS Inc., Chicago, United States).
3. RESULTS and DISCUSSION
The non-volatile solids content and viscosity of UF resins generally increased, while the gelation time and free formaldehyde of resin decreased as the initial F/U mole ratio increased, except for gelation time of UF resins with the first initial F/U mole ratio of 4.0 (Table 2). This trend showed that higher level of the first initial F/U mole ratio provided more formaldehyde to react with urea, and eventually could produce more branched structures and larger molecules in UF resins, which was investigated by semi-quantitative FTIR (Fig. 2) and GPC analysis (Table 3). Using the first initial F/U mole ratio of 3.0 resulted in shorter gelation time and lower free-formaldehyde of UF resins than those prepared with the first initial F/U of 2.0 and 4.0. It is known that one molecule of urea can react with three molecules of formaldehyde to form hydroxymethyl ureas, and then undergoes condensation reaction to form methylene linkages and ether linkages (Kibrik et al., 2014; Steinhof et al., 2014). This yielded in less free-formaldehyde in the UF resins system, and eventually increased the non-volatile solids content and viscosity of resins. In addition, as more branched structures and larger molecules formed in UF resins, the gelation time decreased with increasing the initial F/U mole ratio. No differences were noted in specific gravity and pH of UF resins prepared with different levels of the first and second initial F/U mole ratios.
Furthermore, only a slight increment of non-volatile solids content and viscosity of UF resins at different levels of the first initial F/U mole ratios were observed by comparing with those resins from the second initial F/U molar ratio (Table 2). However, less free-formaldehyde was detected in UF resins prepared with the second initial molar ratio of 1,7 than those resins with the second initial molar ratio of 2.0, resulting in shorter gelation time of UF resins. It is known that high amount addition of last urea to adjust the final F/U mole ratio leads to the formation of compact and linear structures of UF resins (Park and Causin, 2013; Wang et al., 2018). This indicated that UF resins prepared using the second initial molar ratio of 2.0 were linear structures, while using the second initial molar ratio of 1.7 produced branched structures of UF resins. As mentioned above, one molecule of urea can react with three molecules of formaldehyde to form hydroxymethyl ureas, and then methylene linkages, and ether linkages (Kibrik et al., 2014; Steinhof et al., 2014). Therefore, by using a combination of the first initial F/U mole ratio of 3.0 and 4.0 and second initial F/U mole ratio of 1.7, the resulting resins were superior in properties compared to the conventional initial molar ratio of 2.0.
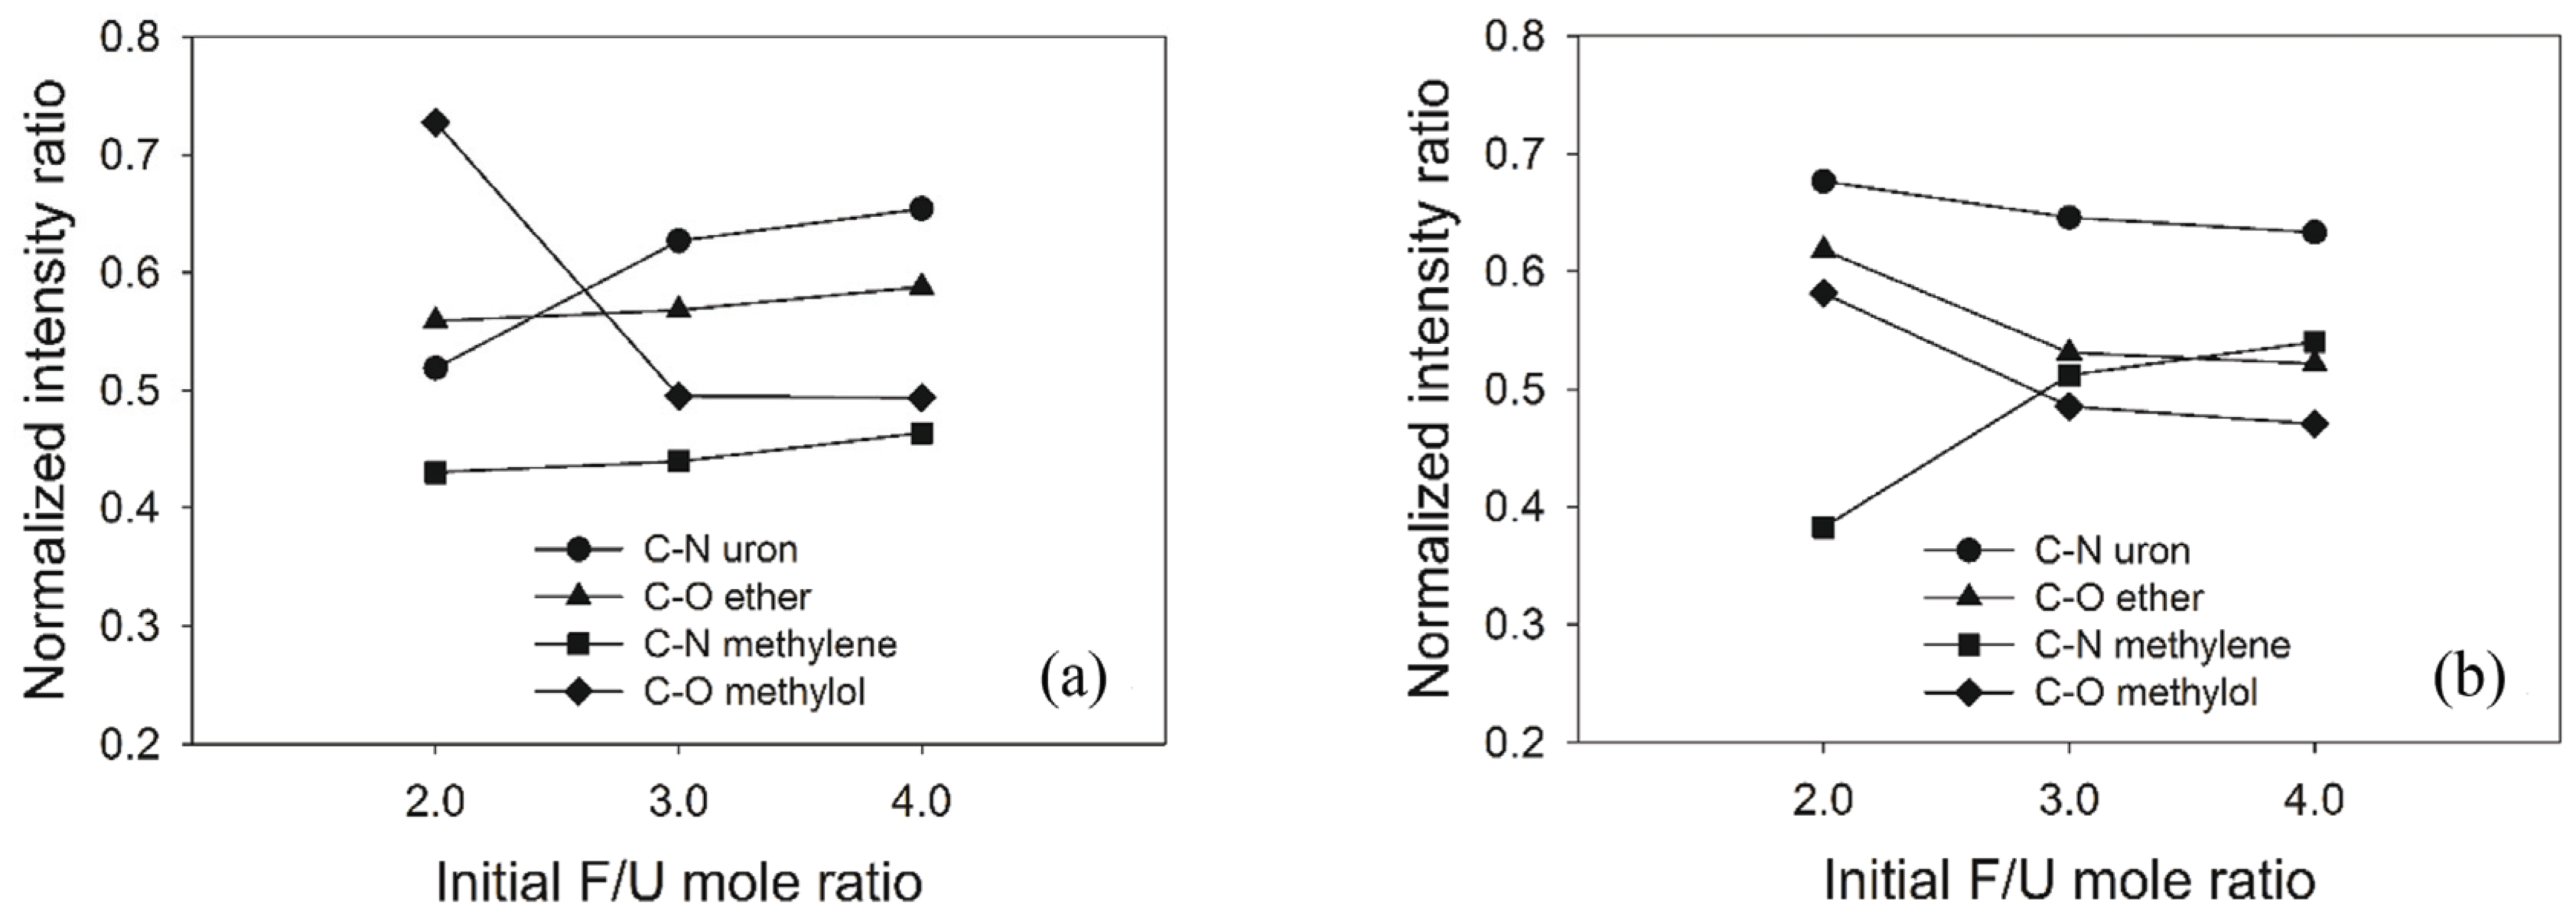
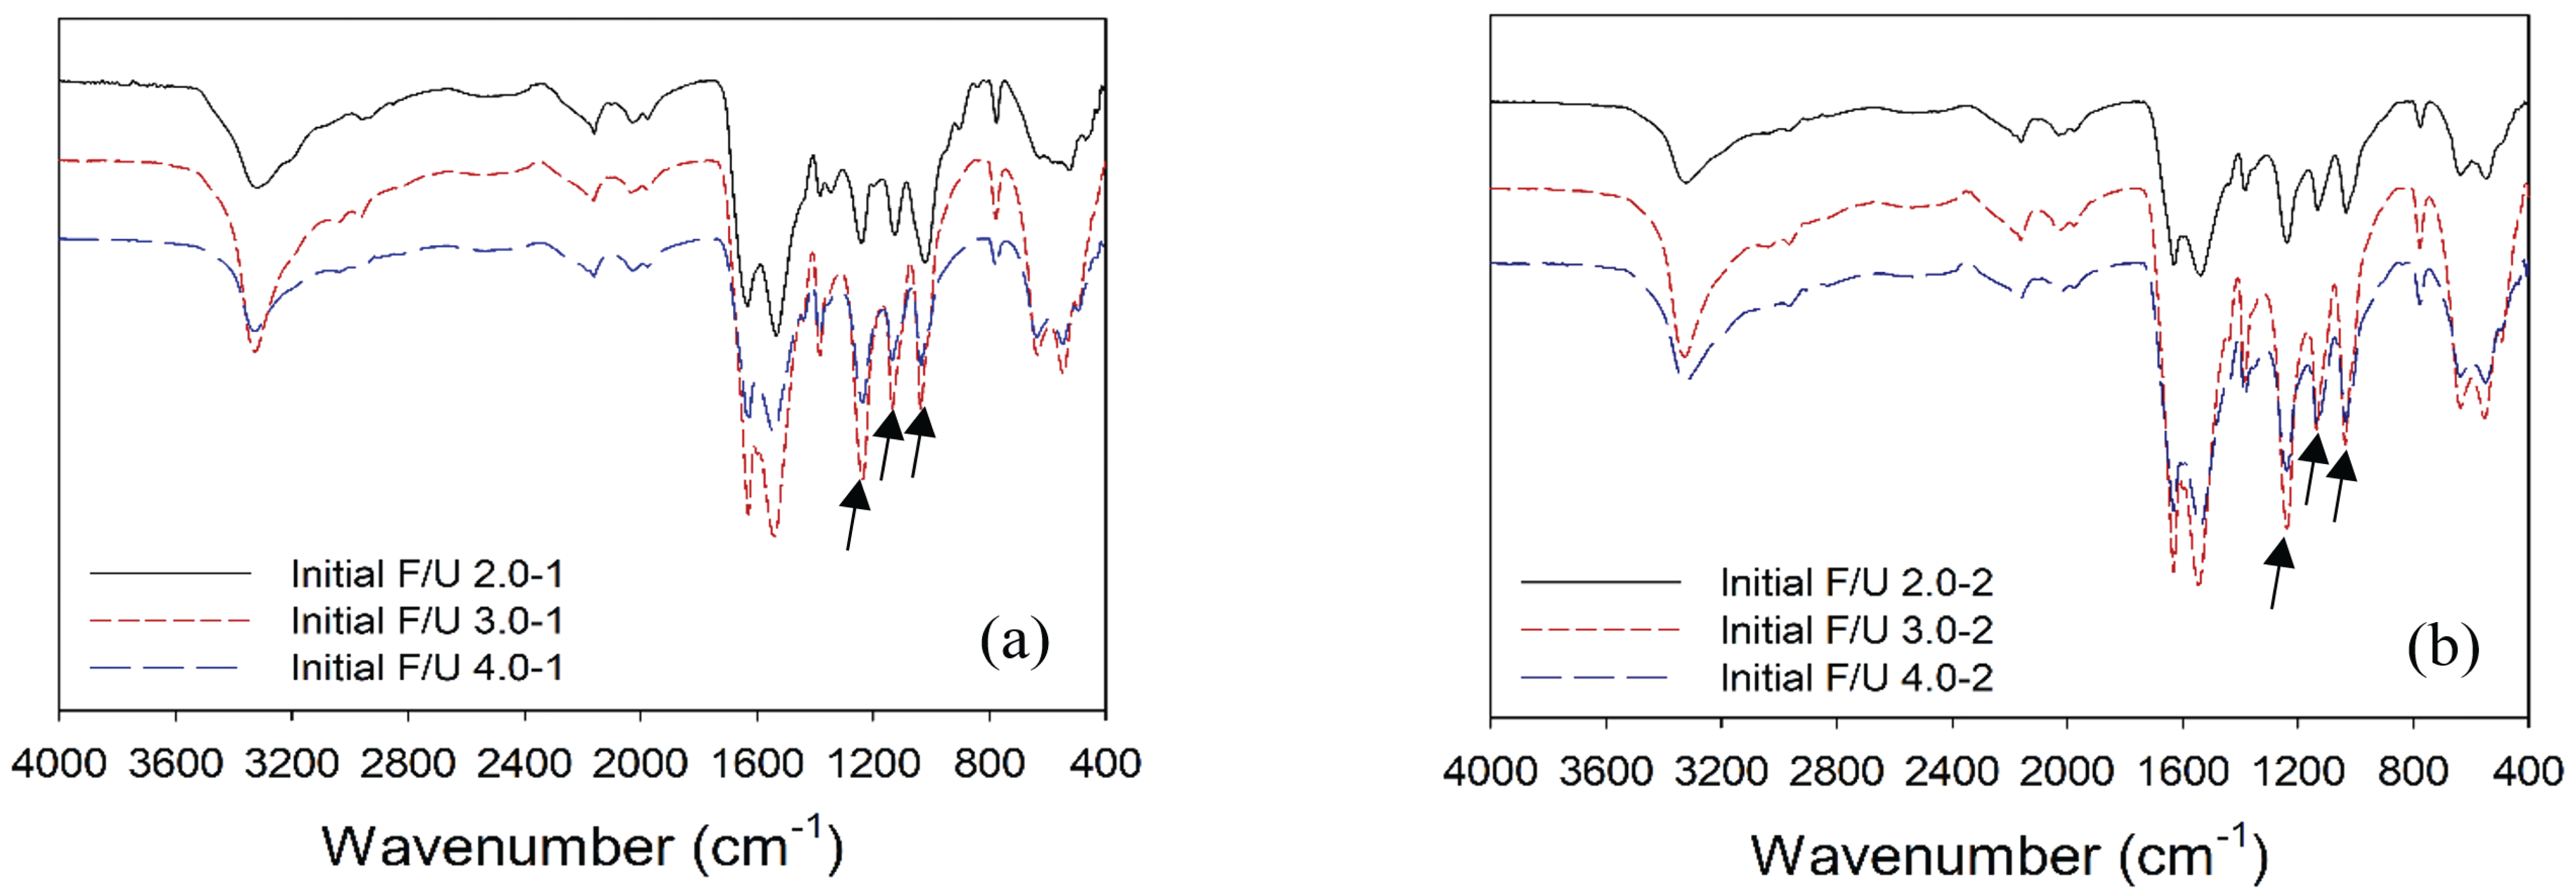
Functional groups of cured UF resins at different initial ratios and prepared using different synthesis methods were analyzed using FTIR spectroscopy (Fig. 1). All absorption bands were interpreted according to the published works (Jada, 1988; Park et al., 2003; Pratt et al., 1985; Soulard et al., 1999). Regardless of the synthesis method, the structure of cured UF resins at different initial F/U mole ratios were built of the same functional groups. The –N–H2 of hydroxymehtyl urea, –C–H of hydroxymehtyl, –C=O of primary amide, and –N–H deformation of primary amide were detected at 3330, 2960, 1630, and 1545 cm-1, respectively. The differences were found at the fingerprint region such as –C–N of uron, –C–O of ether linkage, –C–N of methylene linkage, and –C–O of methylol at 1240, 1138, 1040, and 1005 cm-1, respectively.
Semi-quantitative FTIR analysis was done to examine the change in normalized intensity ratio of specific functional groups of cured UF resins at fingerprint region (Fig. 2). The normalized intensity of –C–O of hydroxymethyl of cured UF resins decreased as the first initial F/U mole ratio increased, indicating the conversion of hydroxymethyl (–CH2OH) into methylene linkage, ether linkage, and uron. Specifically, the normalized intensity of –C–N of uron, –C–O of ether linkage, and –C– N of methylene linkage of UF resins prepared using the second initial molar ratio of 2.0 increased as a function of initial F/U mole ratio. However, different patterns were obtained for UF resins prepared using the second initial molar ratio of 1.7. The normalized intensity of –C–N of methylene linkage increased, while the normalized intensity of –C–N of uronand –C–O of ether linkage decreased as the initial F/U mole ratio increased. This indicates that the – CH2OH has been dominantly converted to methylene linkage instead of uron and ether linkage. But, the formation of uron and ether linkages could not be avoided as those chemical species were easily formed by reaction of two adjacent –CH2OH (Kibrik et al., 2013; Soulard et al., 1999). As depicted in Fig. 2, uron has the highest normalized intensity, and then followed by ether linkage, methylol, and methylene linkage. As using the second initial molar ratio of 2.0 produced more uron and ether linkages, the resins are probably less reactive than those of UF resins prepared using the second initial molar ratio of 1.7. A quite similar result has also been reported (Kibrik et al., 2013; Soulard et al., 1999).
GPC chromatograms of UF resins prepared at different initial F/U mole ratios and using different synthesis methods showed totally different patterns of MWD (Fig. 3). Regardless of initial F/U mole ratio, using the second initial molar ratio of 2.0 resulted in high portion of low MW molecules and low portion of high MW molecules (Fig. 3a). By contrast, UF resins prepared using the second initial molar ratio of 1.7 had higher portion of high MW molecules and lower portion of low MW molecules (Fig. 3b). Addition of less amount urea at final stage to adjust the final F/U mole ratio to 1.0 made the second initial molar ratio of 1.7 forming greater portion of high MW molecules of UF resins than those of the second initial molar ratio of 2.0. It was shown that high amount addition of last urea led to the formation of compact and linear structures of UF resins (Park and Causin, 2013; Wang et al., 2018). Compact and linear structures in UF resins, such as UF resins with final F/U mole ratio 1.0, always have higher portion of low MW molecules and lower portion of high MW molecules than those of branched structures such as UF resins with final F/U mole ratio of 1.2 (Jeong and Park, 2019b).
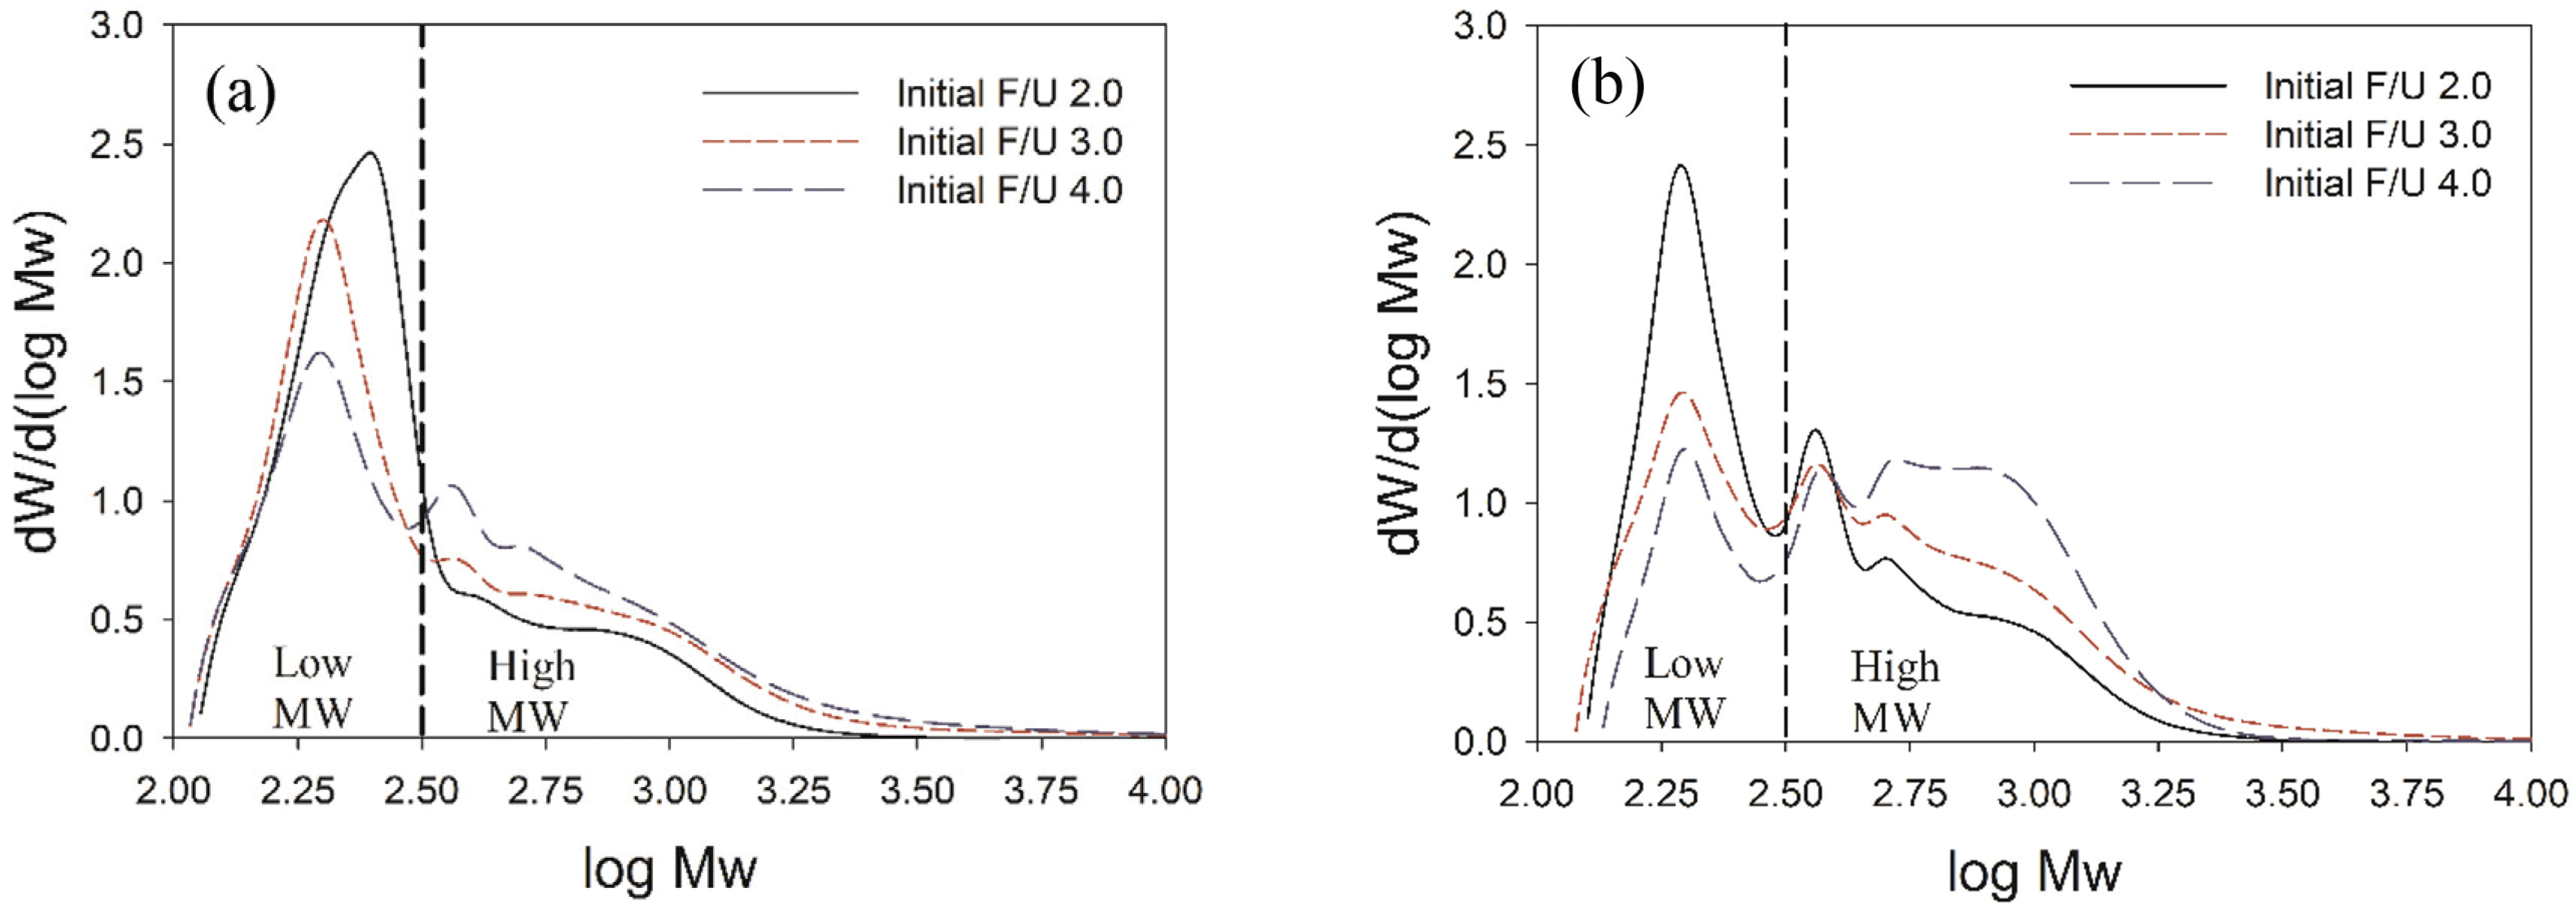
Table 3 presents the Mw, Mn, and PDI values of UF resins at different initial F/U mole ratios and prepared using different synthesis methods. The Mw, Mn, and PDI of UF resins increased as the initial F/U mole ratio became greater. Regardless of initial F/U mole ratio, the second initial molar ratio of 1.7 produced UF resins with slightly higher Mw and Mn, and lower PDI than those of UF resins of the second initial molar ratio of 2.0. The highest Mw and Mn of UF resins was obtained at initial F/U mole ratio 4.0 for both method, indicating that higher initial F/U mole ratio formed more branched structures and larger molecules that those of lower ones. Using the first initial F/U mole ratio of 3.0 and 4.0 could form tri-hydroxymethyl urea, while only mono- and di-hydroxymehtyl ureas were formed at the first initial F/U mole ratio of 2.0. As the results, UF resins prepared with the first initial F/U mole ratio of 3.0 and 4.0 had more branched structures and larger molecules that those of prepared using the first initial molar ratio 2.0. This also was supported by the result of viscosity which the viscosity of UF resins increased at higher first initial F/U mole ratio (Table 2). The result of this study is in agreement with the published work which showed the positive relation between Mw and viscosity (Jeong and Park, 2019b).
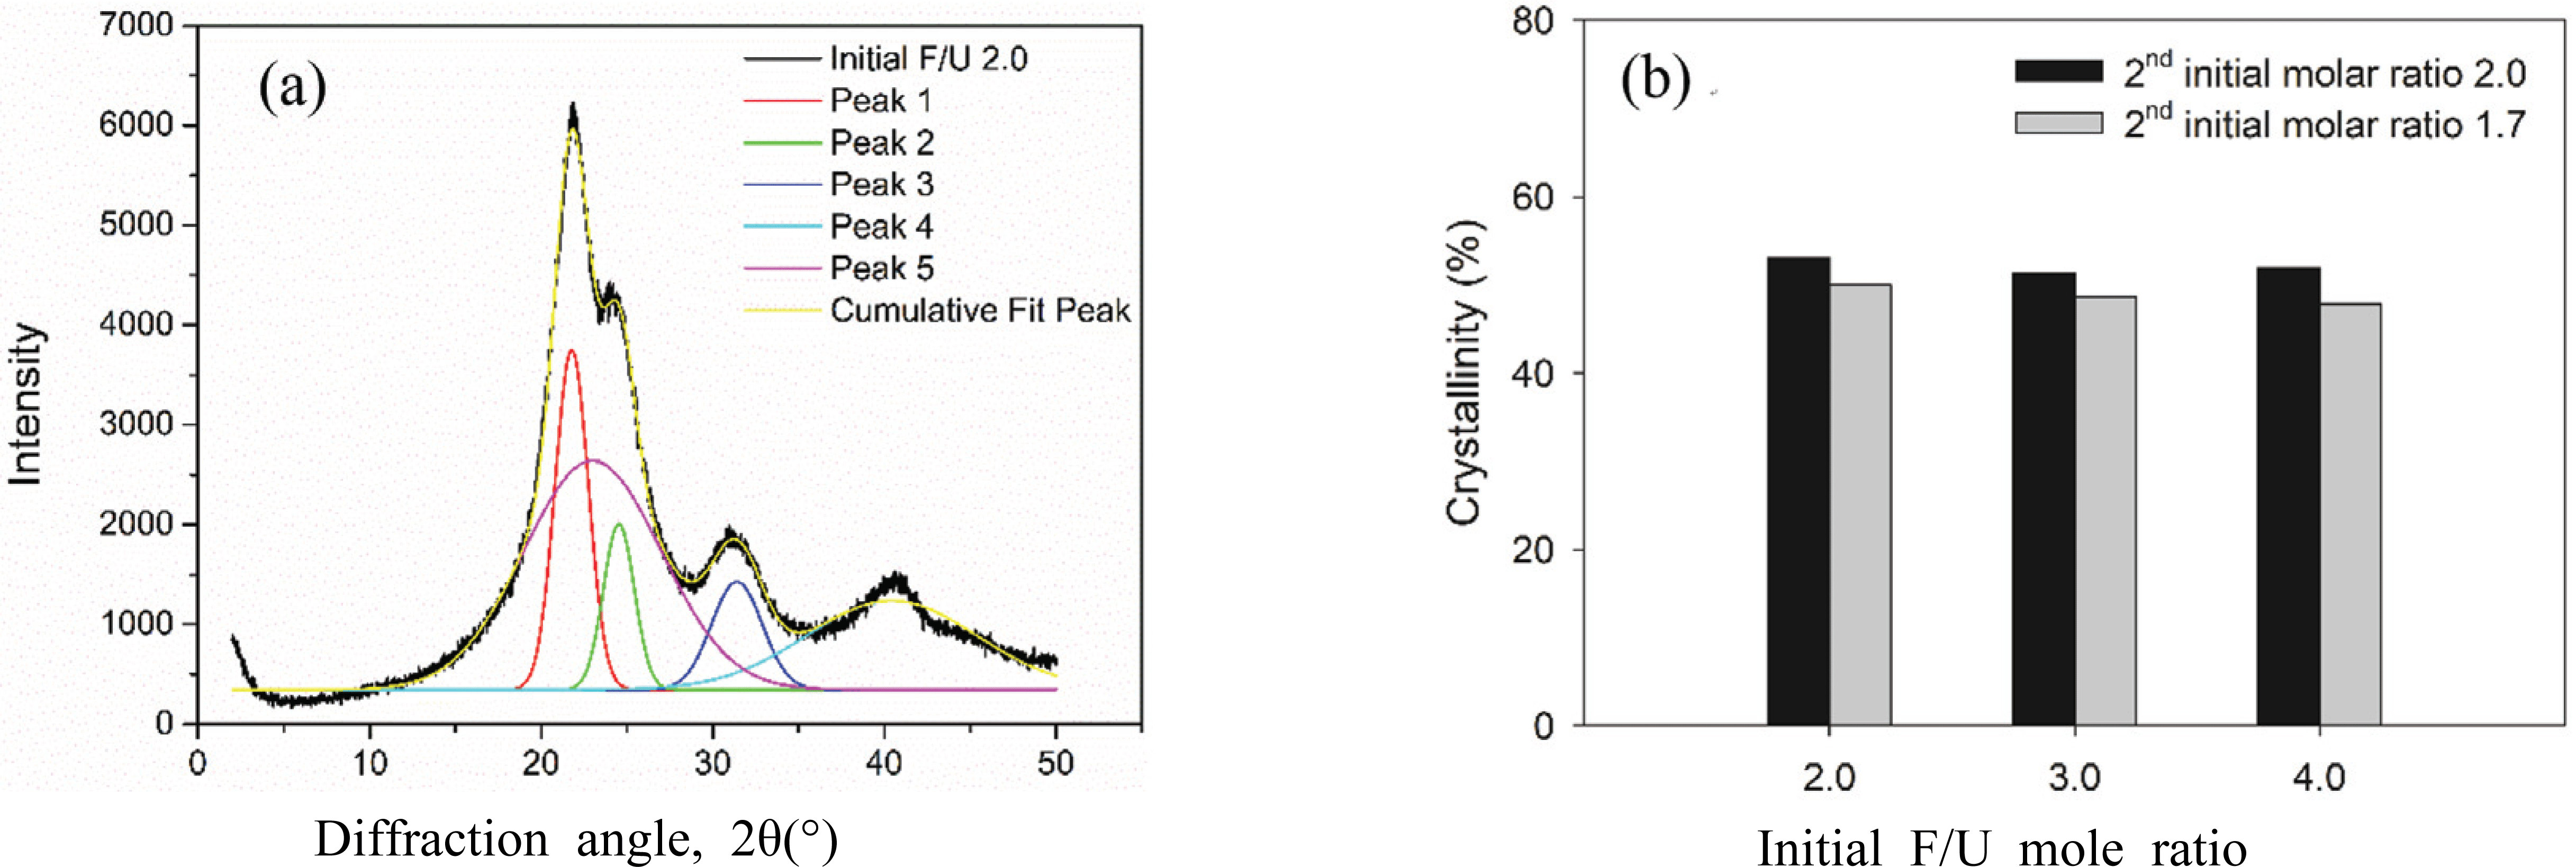
The change in crystallinity of UF resins at different initial F/U mole ratios and prepared using different synthesis methods were observed using XRD analysis (Fig. 4). The XRD diffractograms showed that the crystallinity of UF resins prepared using the second initial molar ratio of 2.0 at different first initial F/U mole ratios did not change (line no. 1). However, the XRD patterns of UF resins prepared using the second initial molar ratio of 1.7 altered, showing a decrease in crystallinity of UF resins as the initial F/U mole ratio increased, particularly at 30.2° and 40.3° which became broader (line no. 2). The change in XRD patterns of UF resins prepared using the second initial molar ratio of 1.7 was associated with the amount of last added urea to adjust the final F/U mole ratio to 1.0. It was reported that high amount addition of last urea tended to form of linear structures of UF resins (Park and Causin, 2013; Wang et al., 2018). As the second initial molar ratio of 2.0 employed a same amount of added urea, therefore the resulted XRD patterns were similar. Meanwhile, less amount of last urea was added using the second initial molar ratio of 1.7, resulting in less crystalline structure of UF resins as shown in XRD diffractograms.
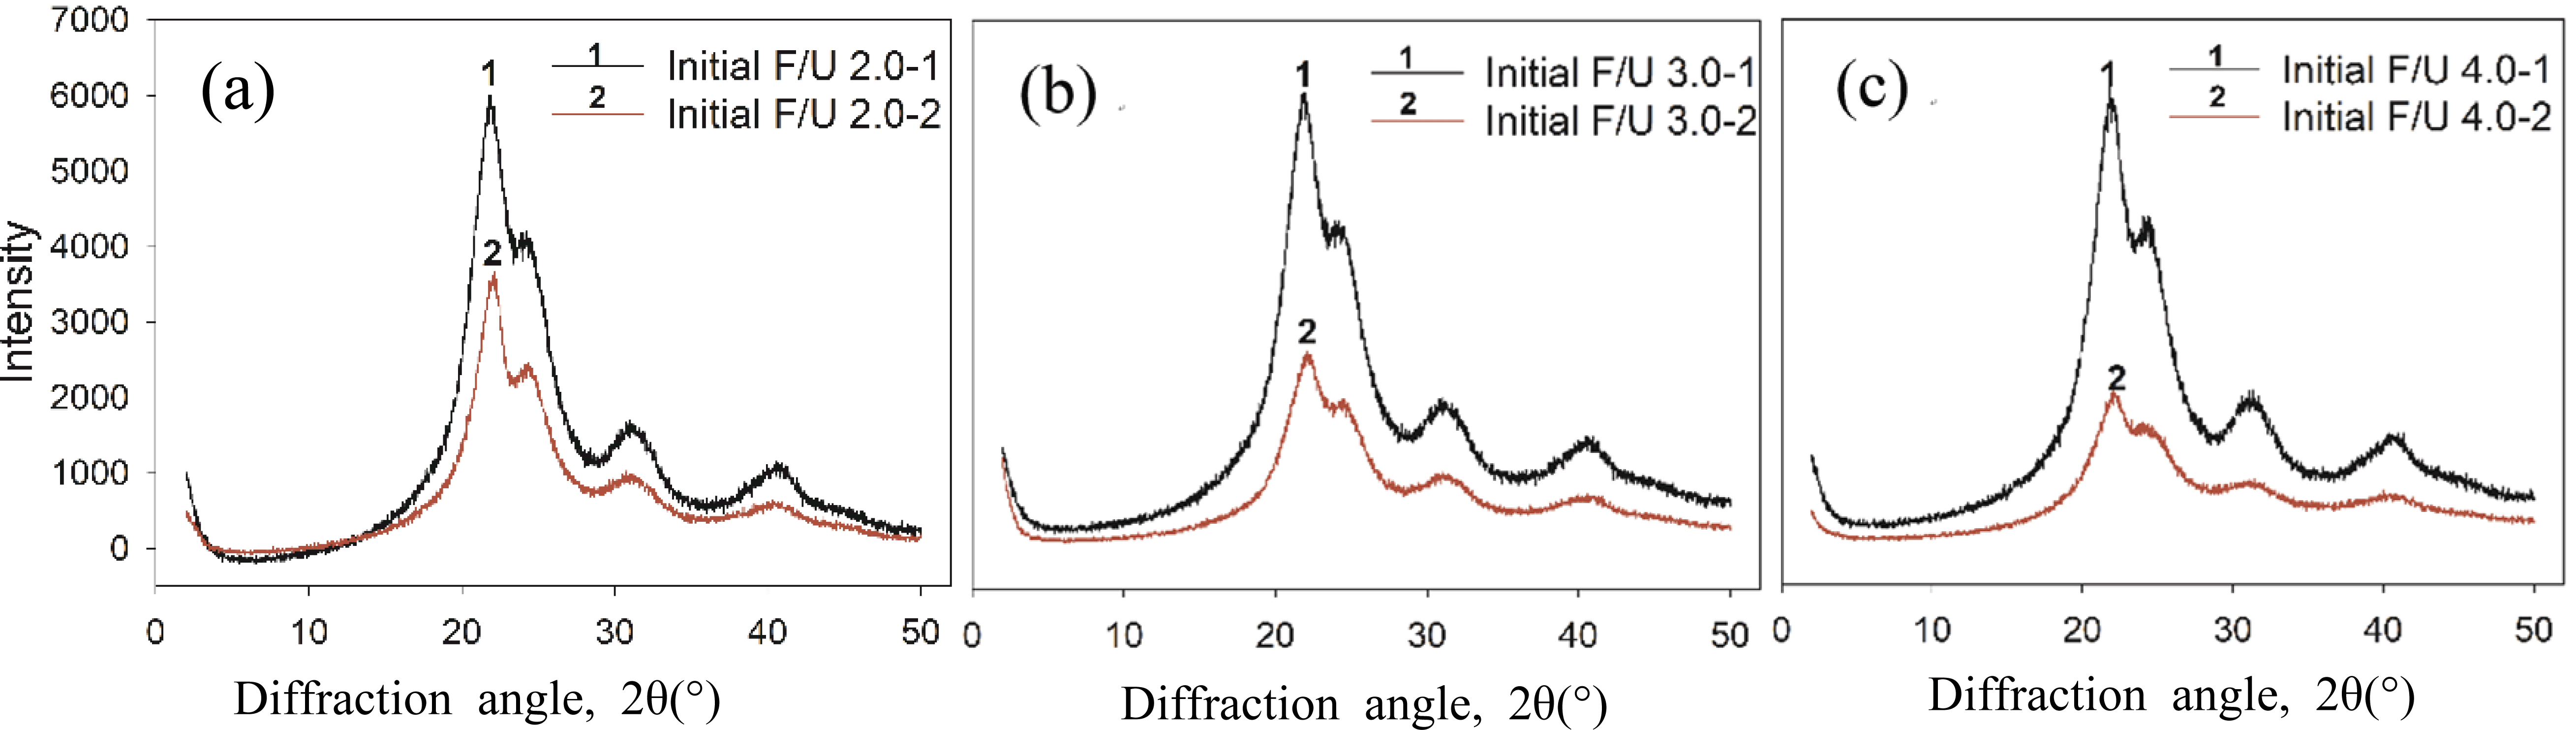
The degree of crystallinity of UF resins at different initial F/U mole ratios and synthesis methods was obtained by applying Gaussian function to resolve the XRD diffractograms. Peak no. 1~4 were assigned as the crystalline domain, whereas peak no. 5 was attributed to amorphous domain (Fig. 5a). The degree of crystallinity was calculated by dividing the area of crystalline region with total area of crystalline and amorphous regions. The result showed that the degree of crystallinity generally decreased as the initial F/U mole ratios increased (Fig. 5b). The crystallinity UF resins prepared using the first initial F/U mole ratio of 3.0 and 4.0 were slightly similar at 51.5%, and it was 1.6% lower than the UF resins prepared with initial F/U mole ratio of 2.0. This indicated that using the second initial molar ratio of 2.0 did not change the crystallinity of UF resins, regardless of the first initial F/U mole ratio. This was due to the same amount of last added urea from the second initial molar ratio of 2.0, leading to a similar crystal structure of UF resins. By contrast, using the second initial molar ratio of 1.7 decreased the degree of crystallinity by around 5.8%, regardless of the first initial molar ratio. The lowest degree of crystallinity was obtained for UF resins prepared using the second initial molar ratio of 1.7 at the first initial F/U mole ratio of 4.0. As reported, high amount addition of last urea tends to form of linear structures of UF resins (Park and Causin, 2013; Wang et al., 2018). As the second initial molar ratio of 1.7 used less amount of last urea, the resulting UF resins had less crystallinity than those of prepared using the second initial molar ratio of 2.0.
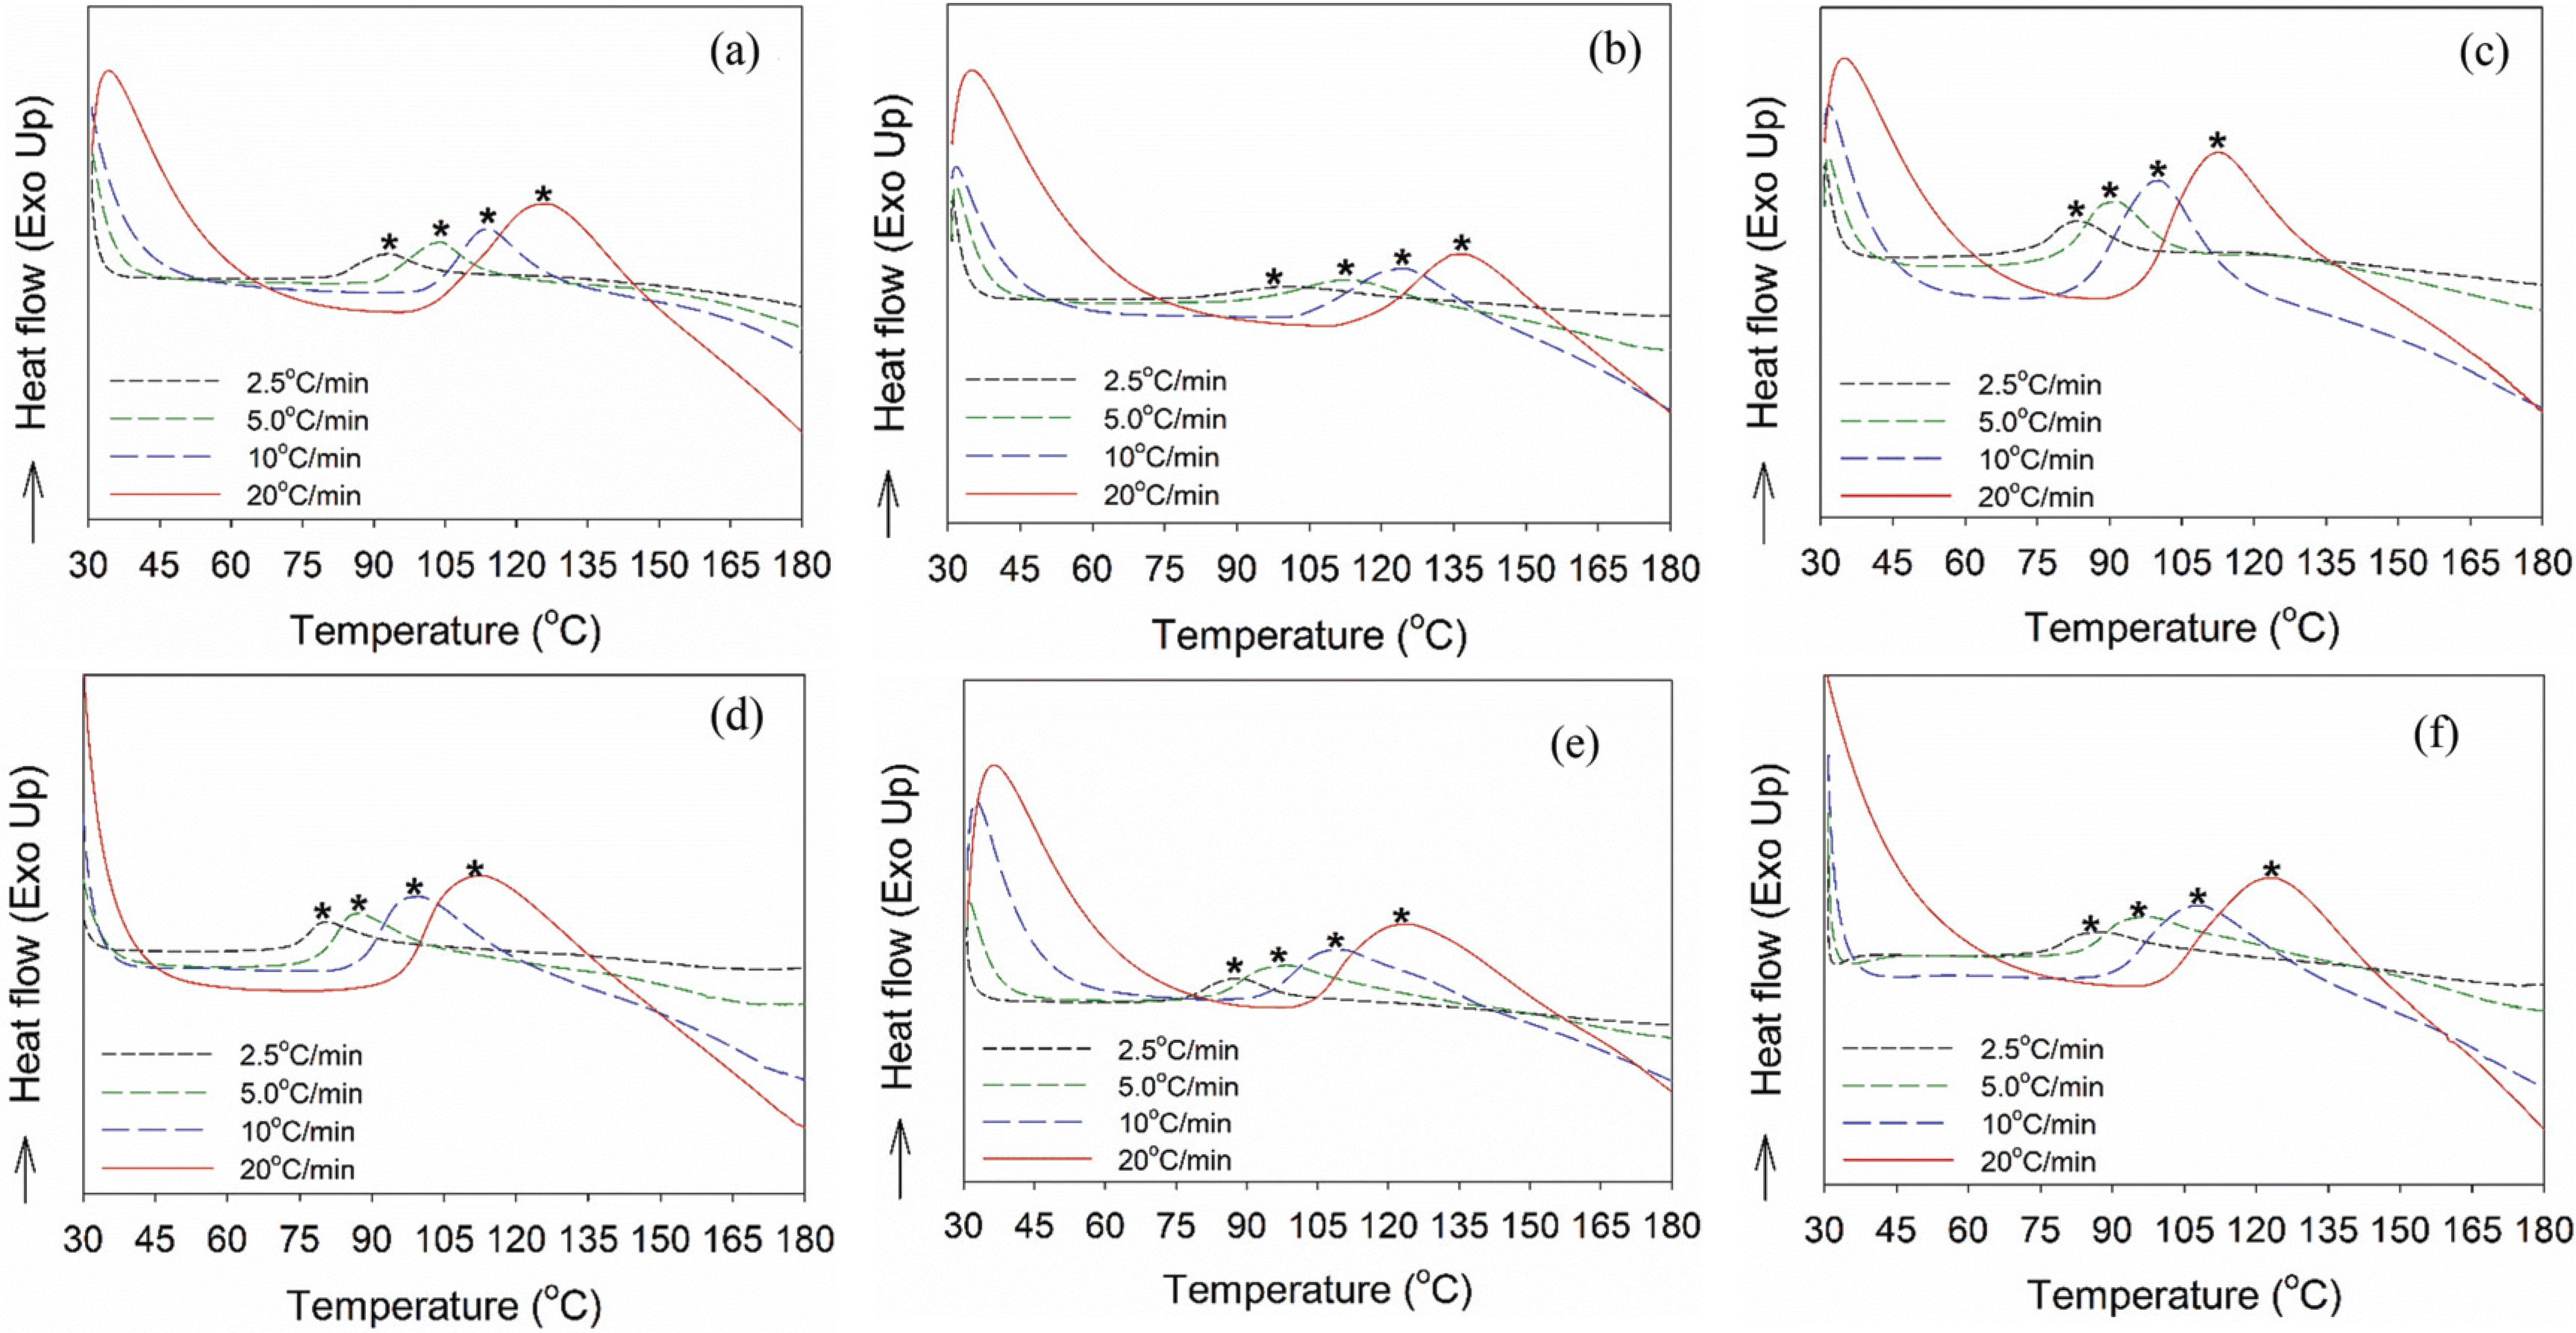
DSC analysis was employed to investigate the effect of initial F/U mole ratio and synthesis method on the reactivity of UF resins. In general, the exothermic peak temperature (Tp, asterisk) increased as the heating rate increased (Jeong and Park, 2019b; Lubis and Park, 2018a; Siimer et al., 2003). At the same heating rate, the lowest Tp value was obtained for UF resins prepared at initial F/U mole ratio of 3.0 and 4.0 using method-2 (Fig. 6). This meant that using method-2 at initial F/U mole ratio of 3.0 and 4.0 yielded branched structures, less crystalline, and more reactive of UF resins which gives low Tp value due to the heat released from the maximum-conversion of polycondensation reactions of hydroxymethyl ureas for cross-linking (Siimer et al., 2003). The highest Tp value was occurred at initial F/U mole ratio of 2.0 using the method-2. This was likely due to that method-2 was not suitable to produce UF resins using the conventional initial F/U mole ratio of 2.0.
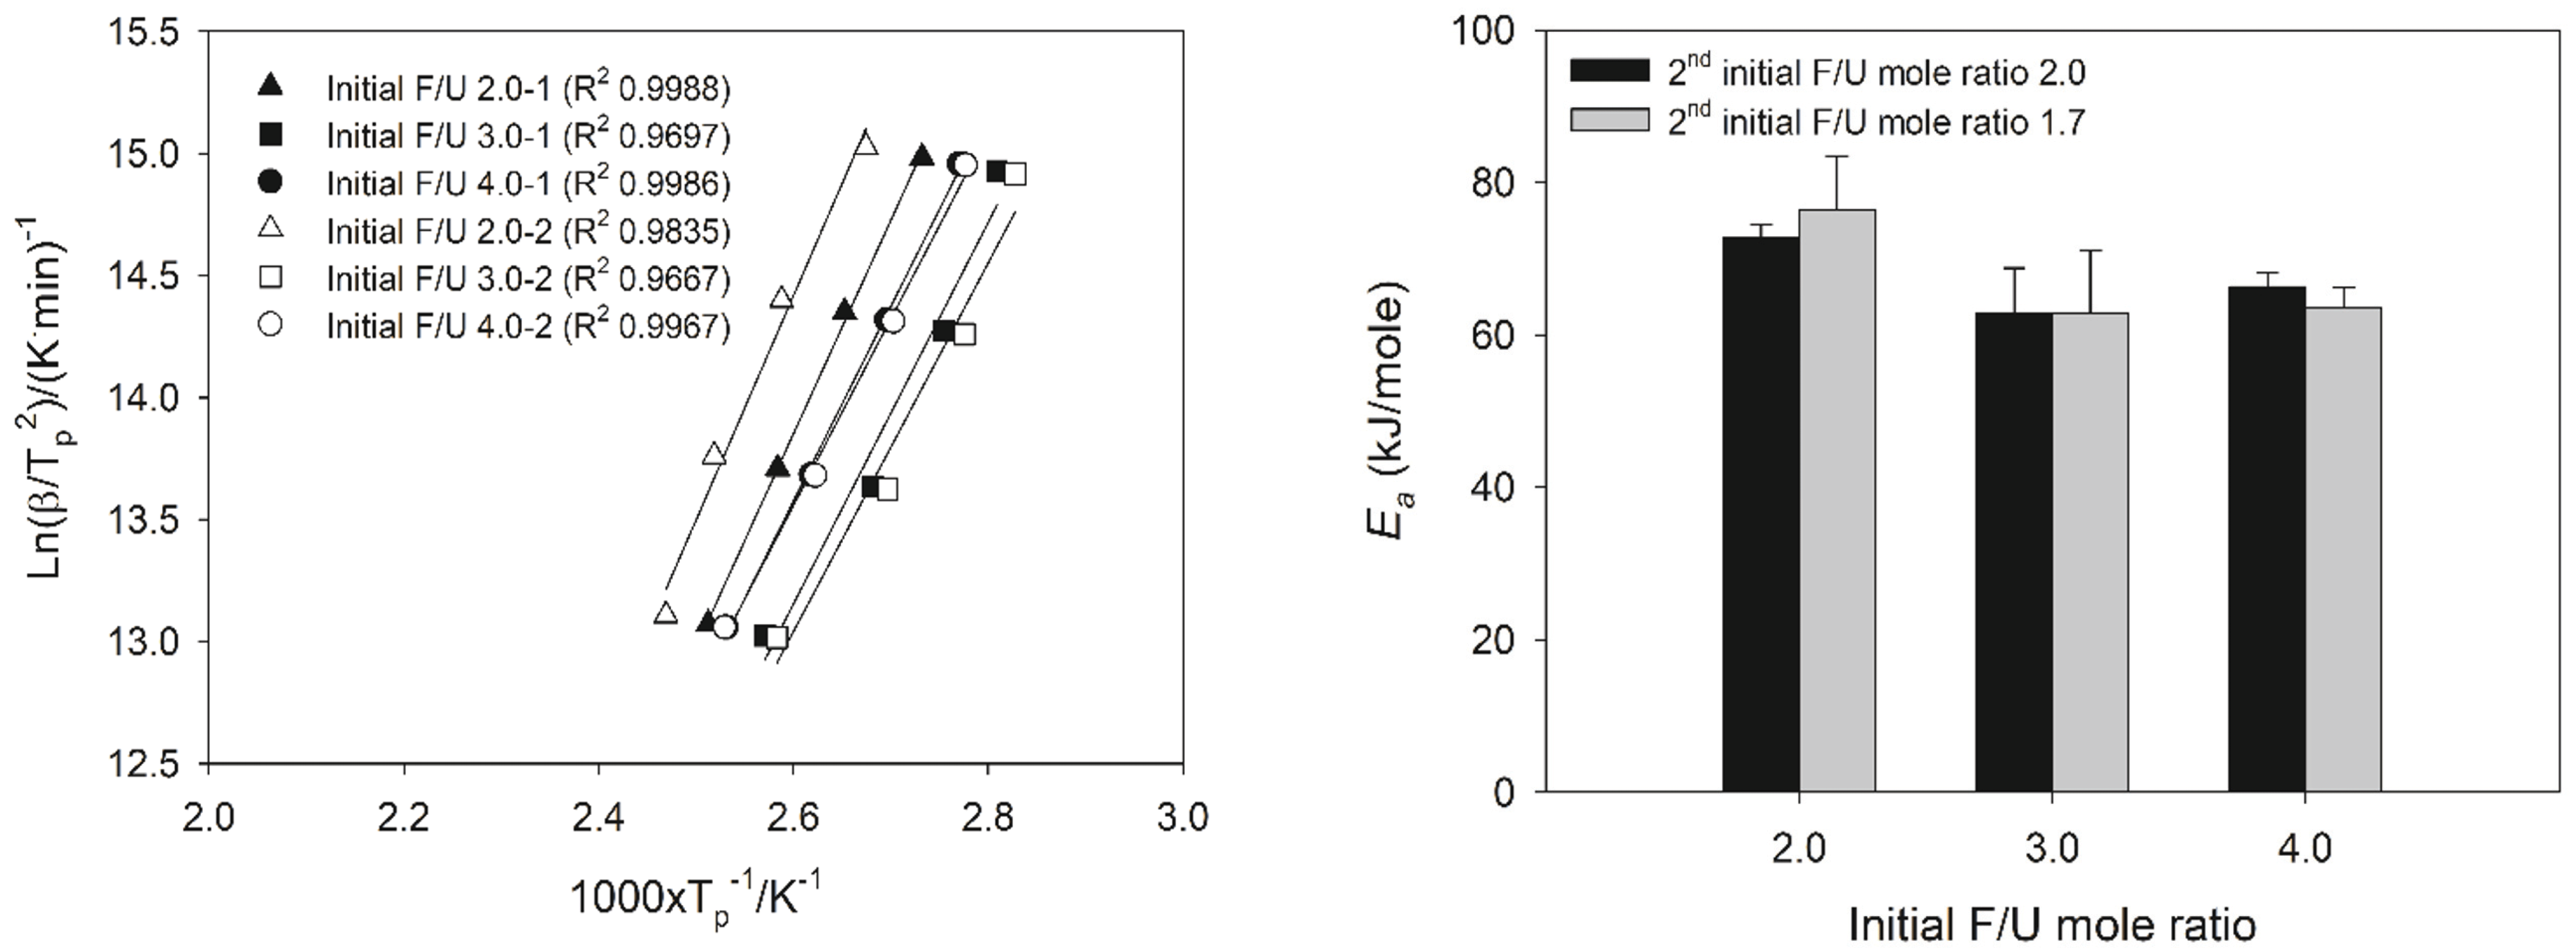
The cure kinetics of 1.0 F/U mole ratio UF resins at different initial F/U mole ratios and prepared using different synthesis methods were evaluated using Kissinger method. The Ea value calculated using Kissinger method was obtained by plotting the Tp value and heating rate into equation 2 (Fig. 7a), resulting in Ea values in the range of 62.8-76.4 kJ/mole (Fig. 7b). This result was in agreement with the published work which reported the Ea value of 1.0 F/U mole ratio UF resins calculated using Kissinger method (Jeong and Park, 2019b; Lubis and Park, 2018a). Regardless of the synthesis method, the lowest Ea value was obtained from UF resins at initial F/U mole ratio of 3.0 at around 62.8 kJ/mole, and then followed by UF resins prepared with initial F/U mole ratio of 4.0 at around 63.6 kJ/mole. However, as can be seen in the Kissinger plot (Fig. 7a), initial F/U mole ratio of 4.0 has higher R2 that that of initial F/U 3.0, meaning the model-fitting used to calculate Ea value for the first initial F/U mole ratio of 4.0 has less error and more reliable than those model used for the first initial F/U 3.0. The highest Ea value was observed for UF resins at the first initial F/U mole ratio of 2.0 at around 72.8 and 76.4 kJ/mole. This showed that the conventional the first initial F/U mole ratio of 2.0 was less reactive than those of the first initial F/U mole ratio 3.0 and 4.0, regardless of the second initial F/U mole ratio.
To understand the cross-linking of UF resins at different combination of the first and second initial F/U mole ratios, the Isoconversional (KAS) method was used to calculate the Ea as a function of degree of conversion (α). There are slightly different patterns of Ea as a function of degree of conversion (α) for cross-linking of UF resins. The change in Ea values of UF resins at different initial F/U mole ratios prepared using the second initial molar ratio of 2.0 decreased as a function of α (Fig. 8a). This meant that the cross-linking of UF resins prepared using that method followed the reaction-controlled, showing the viscosity and molecular weight of the resins did not increase during crosslinking. But, an increased in Ea at α= 0.85 to 0.95 was observed for UF resins at the first initial F/U mole ratio of 4.0, indicating an increased in viscosity and molecular weight of resins. As cross-linking reaction is going on, the viscosity and molecular weight of the reaction system theoretically increases, which slows down the molecular mobility, and then the reaction is controlled by diffusion of low and high molecular weight species (Vyazovkin, 2017).
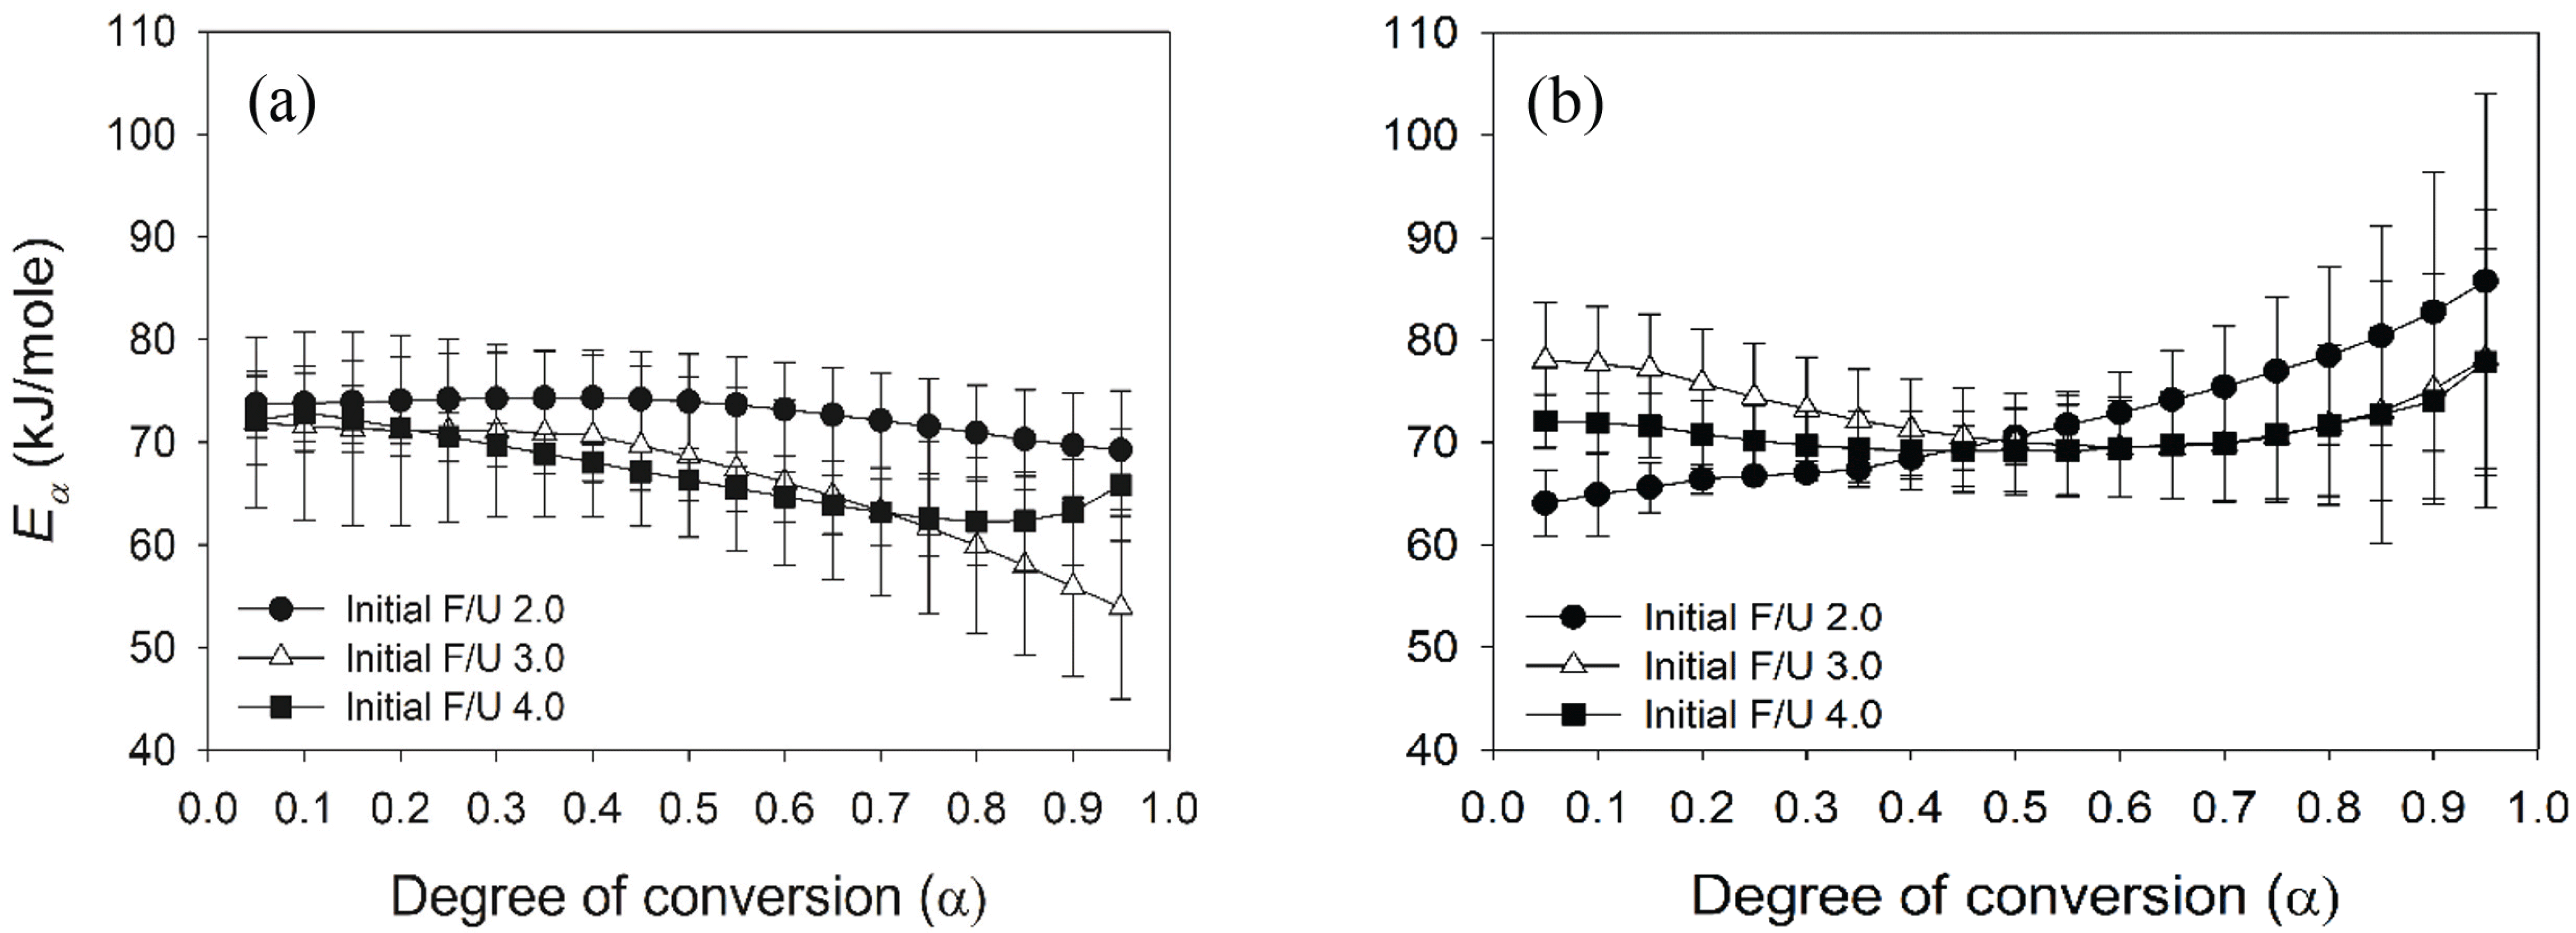
The above behaviour was also observed for Ea values of UF resins at different initial F/U mole ratios prepared using the second initial F/U mole ratio of 1.7 (Fig. 8b). The Ea values initially decreased from α = 0.05 until α = 0.50 (reaction-controlled), and then it increased to complete the cross-linking (diffusion-controlled). But, this is not the case for the first initial F/U mole ratio of 2.0, which the Ea increased from the beginning. Different first and second initial F/U mole ratios produced different chemical species, molecular weights, and viscosities which governed the cross-linking reaction of UF resins. The cross-linking reaction of UF resins involves the polycondensation reactions of hydroxymethyl ureas, which further forms three- dimensional network of UF resins (Park and Kim, 2008; Siimer et al., 2003). This results showed that UF resins prepared using the second initial molar ratio of 2.0 had more linear structures and greater crystallinity, as shown by XRD (Figs. 4 and 5), resulting in a decreased in Ea values as a function of α following the reaction-controlled for cross-linking. By contrast, more branched structures and less crystallinity of UF resins prepared using the second initial molar ratio of 1.7 initially followed the reaction-controlled, and then the reaction altered to diffusion-controlled as the viscosity and molecular weight of chemical species increased. This was supported by the result of GPC analysis (Fig. 3), showing that UF resins prepared using the second initial molar ratio of 1.7 had higher molecular weight than those prepared using the second initial molar ratio of 2.0.
Tensile shear strength (TSS) and formaldehyde emission (FE) of plywood bonded with UF resins at different initial F/U mole ratios and synthesis methods were statistically evaluated to investigate the macroscopic phenomenon (Table 4). TSS of plywood bonded with UF resins prepared using the second initial molar ratio of 2.0 were not significantly different at different first initial F/U mole ratios, explaining by its low R2 of 0.30. The range of TSS of plywood bonded with UF resins prepared that method were around 0.95-1.03 MPa. However, plywood bonded with UF resins prepared using the second initial molar ratio of 1.7 had greater TSS as the initial F/U mole ratio increased. With an R2 of 0.87, using the first initial F/U mole ratio of 4.0, plywood had greater TSS of around 1.21 MPa than those of initial F/U2.0 and 3.0. By contrast, high correlation was obtained for FE from plywood bonded UF resins. Regardless of the second initial molar ratios, the R2 for F/U 2.0 and 1.7 were 0.98 and 0.94, respectively. The highest FE was emitted from plywood bonded with a conventional method of 1st and 2nd initial F/U mole ratio of 2.0 at around 1.89 mg/L, and the lowest one was obtained in plywood bonded with acombination of 1st initial F/U mole ratio of 4.0 and and 2nd initial F/U mole ratio of 1.7 at around 0.55 mg/L. In general, formaldehyde emission from UF-bonded plywood are related to the free formaldehyde in UF resins. It means that higher free formaldehyde will generate greater formaldehyde emission from the panel (Myers, 1984; Park et al., 2006). This revealed that FE values from plywood generally decreased as the first initial F/U mole ratio increased, except for plywood bonded with UF resins with combination of the first initial F/U mole ratio of 4.0 and the second initial molar ratio of 2.0. To obtained the optimum performance of UF resins, statistical analysis sugessted to use the first initial F/U mole ratio of 3.0 for the preparation of UF resins using the second initial molar ratio of 2.0, while the first initial F/U mole ratio of 4.0 could be used to prepared UF resins using the second initial molar ratio of 1.7. This finding was supported by the results of gelation time, FTIR and DSC analysis (Table 2, Figs. 2 and 6).
Bond-line features of plywood bonded with UF resins at different initial F/U mole ratios and synthesis methods were investigated using a light microscope to understand the microscopic phenomenon (Fig. 9). The light micrographs clearly show the bond-line features, including empty tracheids (arrow), filled tracheids (arrow head), bond-line (black line), and the edge of other veneer in plywood (star). The measurement was done for plywood panels bonded with UF resins at different F/U mole ratios and prepared by different synthesis methods. The result showed that resin penetrated into the tracheid lumens away from the interface between the bond-line and wood veneer.
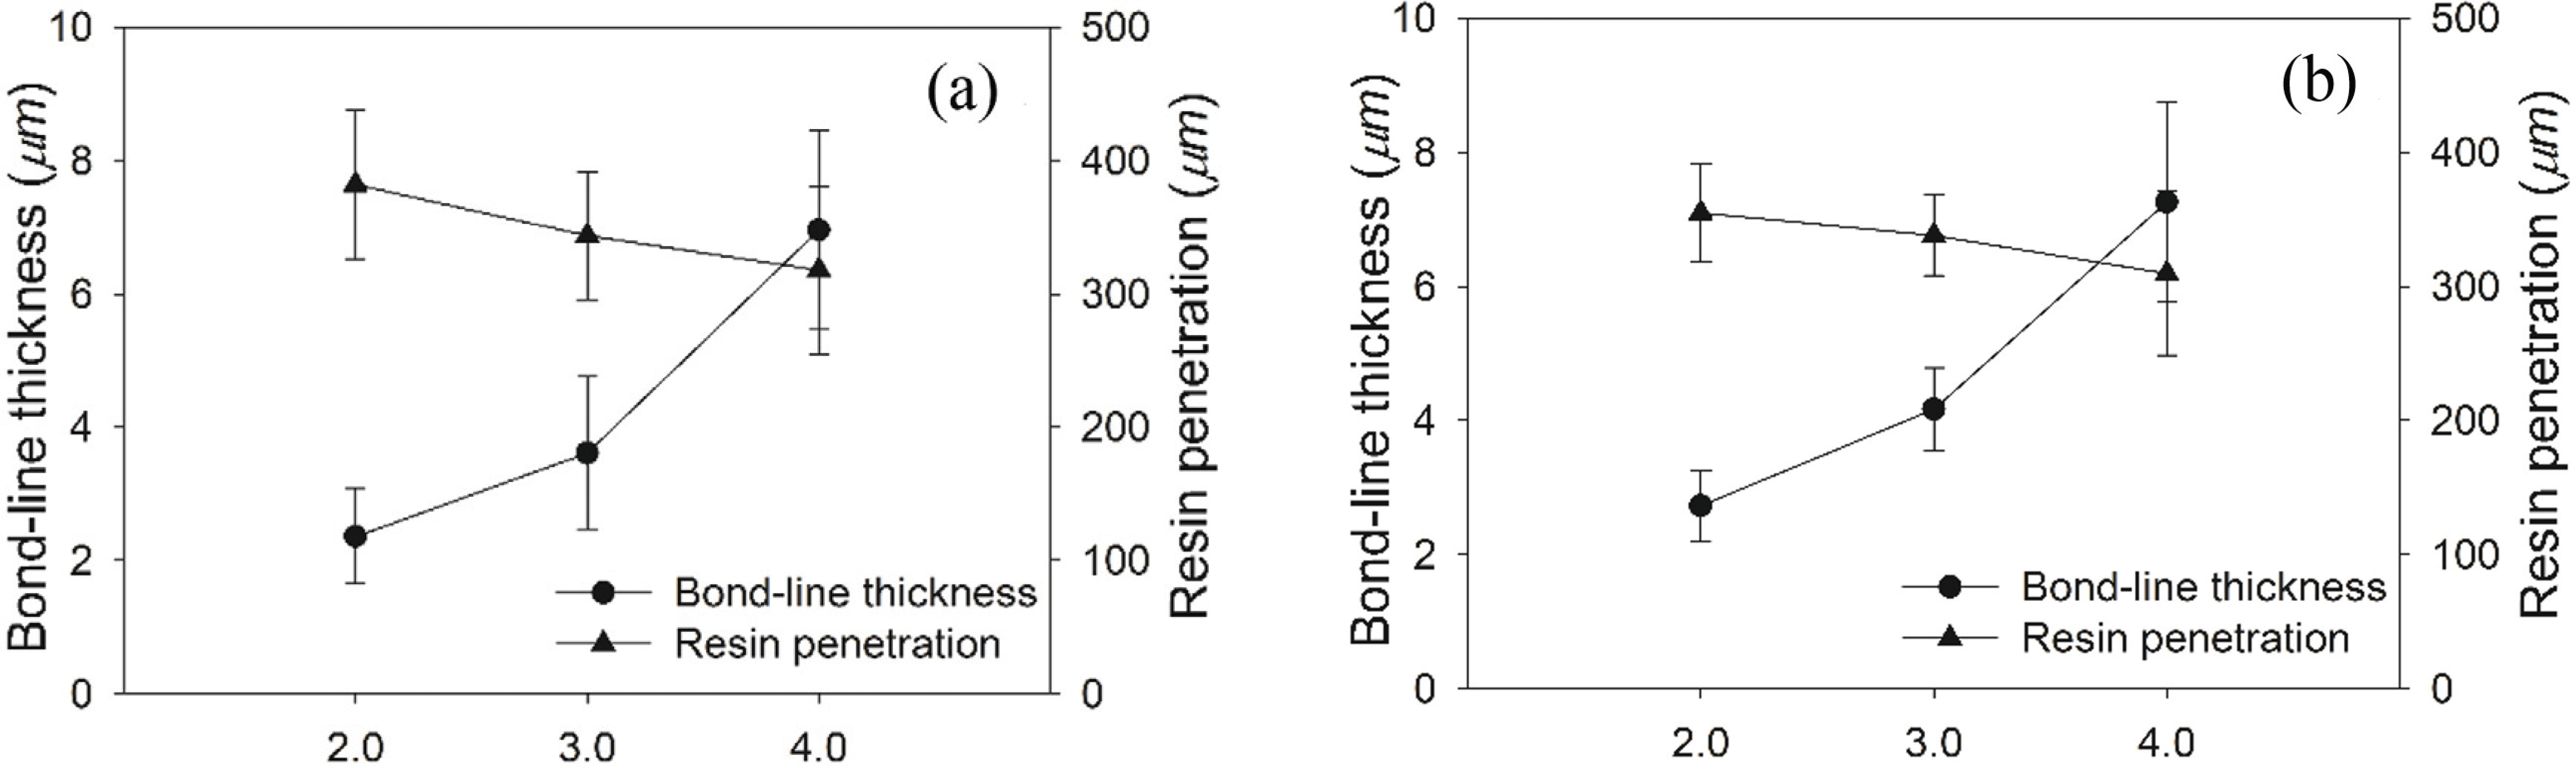
Regardless of the use of the second initial molar ratio, the result showed a quite similar trend of bond-line thickness and depth of resin penetration, which the bond-line thickness increased while the resin penetration decreased as the first initial F/U mole ratio increased (Fig. 10). This trend was clearly affected by resin’s viscosity and molecular weight, which also increased as a function of initial F/U mole ratio (Tables 2 and 3). This result is in agreement with the previous work that reported the relationship between bond-line thickness and resin penetration (Jeong et al., 2019; Jeong and Park, 2019b; Lubis et al., 2019) The result also showed that an increased in bond-line thickness increased the TSS of plywood, indicating that cohesion of UF resins in the bond-line greatly affected the final adhesion strength of plywood. Although UF resins at the first initial F/U mole ratio of 4.0 had less resin penetration than others, it still provided a proper combination of bond-line thickness and resin penetration that gave a strong cohesion and adhesion strength in plywood.
4. CONCLUSIONS
Different combinations of the first and second initial F/U mole ratios were employed to improve the performance of low molar ratio UF resin adhesives in plywood. Using a combination of higher first initial F/U mole ratio and lower second initial molar ratio increased the non-volatile solids content, viscosity, and specific gravity of UF resins, while the gelation time and free-formaldehyde of the resins decreased. This resulted in more reactive UF resins prepared using higher level of the first initial F/U mole ratio, such as 3.0 and 4.0, instead of the conventional initial F/U mole ratio of 2.0. This finding is supported by the result of DSC analysis, which shows lower exothermic peak temperature and activation energy for UF resins prepared using higher first initial F/U mole ratio. As the result, tensile shear strength of plywood was greater when bonded with UF resins at higher first initial F/U mole ratio and lower second initial molar ratio. Moreover, the formaldehyde emission of plywood bonded with UF resins at higher first initial F/U mole ratio also decreased. This study showed that the performance low molar ratio UF resins at the expense of low formaldehyde emission, such as 1.0 F/U mole ratio, could be improved by using higher first initial F/U mole ratio and lower second initial molar ratio.