1. INTRODUCTION
Palm oil industry contributes to the abundant of oil palm solid wastes including empty fruit bunches (EFB), palm kernel shell (PKS), mesocarp fiber (MF), oil palm fronds (OPF), oil palm trunk (OPT), which were obtained from plantation and milling activities (Sukiran et al., 2017). The amount of waste of dry palm oil is estimated to be about 10 ton/ha/year. In addition, a production of 1.5 to 25 million tonnes of dry matter (DM) at the mill and 10 to 50 million tonnes of DM in the plantation of oil palm by-products are estimated. Total percentage of OPF from pruning and cutting activities is 26.5% of total source (Loh, 2017; Abnisa, 2013). Mathius et al. (2004) has reported that 5,214 kg of dry OPF are produced from 1 ha oil palm plantation a year and their percentage of DM is by 46.18%. Thus, many researchers have developed the utilization of oil palm such as for biopellets (Wistara et al., 2017), densified wood (Hartono et al., 2016a; Hartono et al., 2016b), meanwhile OPF was developed for many applications, i.e. for animal feeds (Ghani et al., 2017; Chanjula et al., 2017), corrosion inhibitors (Shah et al., 2017), succinic acid (Luthfi et al. 2016), biofuel production and biorefineries (Sukiran et al., 2017; Tan et al., 2016), metal ions removal (Zainol et al., 2017), composite board (Khalid et al., 2015; Wardani et al., 2014).
Moreover, OPF with cellulose content of about 43.91% has a big potential to be raw material of cellulose nanocrystals (CNCs) or cellulose nanofibril (CNF). CNF is a new class of material because of its special characteristics such as high mechanical strength (100-140 Gpa), low density, environtmentally sustainable, high aspect ratio and surface area. CNCs are generally prepared by removing the amorphous area of cellulose, showing 5-70 nm in diameter and 100-300 nm in length. Similar to CNF, CNCs exhibits a low density (1.6 gcm-3), a high specific surface area (300 m2g-1), high tensile strength (7.5-7.7 GPa) and elasticity (143 GPa) (Gwon et al., 2018). CNCs have been applied for polymer reinforcement, biomedical application, drug delivery, and so forth.
There are a number of studies related to the isolation and characterization of CNF from OPF and other lignocellulosic material (Dungani et al., 2017; Nordin et al., 2017; Saurabh et al., 2016; Fung et al., 2011; Fung et al., 2010; Park et al., 2016). Likewise, CNCs also have been investigated (Bondeson et al., 2006; Lu and Hsieh, 2010; Zaini, 2013). However, most of isolation methods used acid and/or mechanical process with multiple step. Moreover, the methods have some disadvantages such as the use of highly corrosive mineral acids, tedious isolation techniques, and limitation of large-scale production. In order to avoid the disadvantages, a simple and versatile one-step procedure using ammonium persulfate (APS) was invented by Leung et al. (2011).
APS is an oxidant with low long-term toxicity, high water solubility and low cost. In order to apply this method, the lignin content of starting material is recommended to be less than 20%. Accordingly, the choice of starting material becomes important. OPFs with less than 20% lignin content (Leung et al., 2011) can be potencially used as a starting material.
Different conditions such as APS concentration, reaction time and temperature can affect on the characteristics of the resulted CNF. However, The information on the characteristics of CNCs from OPF by APS procedure is still limited.
2. MATERIALS and METHODS
Oil palm fronds (OPF) were obtained from the experimental plot of Dramaga, Bogor, Indonesia. OPF was dried in oven at 105 °C. Next, Dried OPF was grinded using hammer mill and sieved with more than 100 mesh size. APS and NaOH were purchased from Merck (Jakarta, Indonesia). Aquadest was used as chemical solvent.
One liter of different concentration (1, 1.5 and 2 M) of APS was prepared and each of chemical was subjected to 10 g OPF, which were used as the starting biomass materials. The mixture was heated at 60 °C for 16 h under constant mechanical stirring. Centrifugation of the treated suspension was carried out at 12,000 rpm for 10 min. The washing process was repeated four times until the pH of the suspension was close to 4. Next, the sample was sonicated using Digital Ultrasonic Cleaner, model ST-UB3300LDT in an ice bath for 30 min prior to lyophilization. The lyophilized sample was stored in a drying cabinet.
A drop of diluted cellulose nanofibers suspension stained negatively with 0.5 % aqueous uranyl acetate was deposited onto a carbon-coated Cu grids and allowed to dry in a desiccator at room temperature. The size and shape of CNCs were studied using a transmission electron microscope (Hitachi, H-7100, Japan) operating at 200 kV in the central laboratory of Kangwon National University.
FTIR spectra of APS-treated CNCs were obtained using PerkinElmer FTIR spectrophotometer. Samples were ground and mixed well with KBr (1:100, w/w), then pressed into thin pellets. FTIR analysis was performed in the transmittance mode with a wavenumber range of 4000–400 cm-1 and a resolution of 4 cm-1 at an accumulation of 32 scans. The positions of the peaks were determined by the OriginPro software.
The crystallinities of raw OPF (RO) and APS treated OPF (1M, 1.5M, and 2M) were evaluated by an XRD method. The XRD patterns of the specimens were obtained from an X-ray diffractometer (Shimadzu Maxima XRD-7000) operated at 40 kV and 40 mA with Ni-filtered CuKa radiation. X-ray diffractograms were recorded from 2Ɵ=100 to 600 with the scan rate of 20/min. Crystallinity index (CrI) values were calculated from diffraction intensity data using analytical software XRD 6000/7000. The basis for this method was outlined by Ruland (1961), who determined the crystallinity by subtracting the amorphous contribution from diffraction spectra using an amorphous standard. Ball-milled cellulose was used as an amorphous standard. A scale factor is applied to the spectrum of the amorphous material so that after subtraction of the amorphous spectrum from the original spectrum, no part of the residual spectrum contains a negative signal. Crystallinity Index (CI) is calculated as the ratio between the area of the crystalline contribution and the total area.
3. RESULTS and DISCUSSION
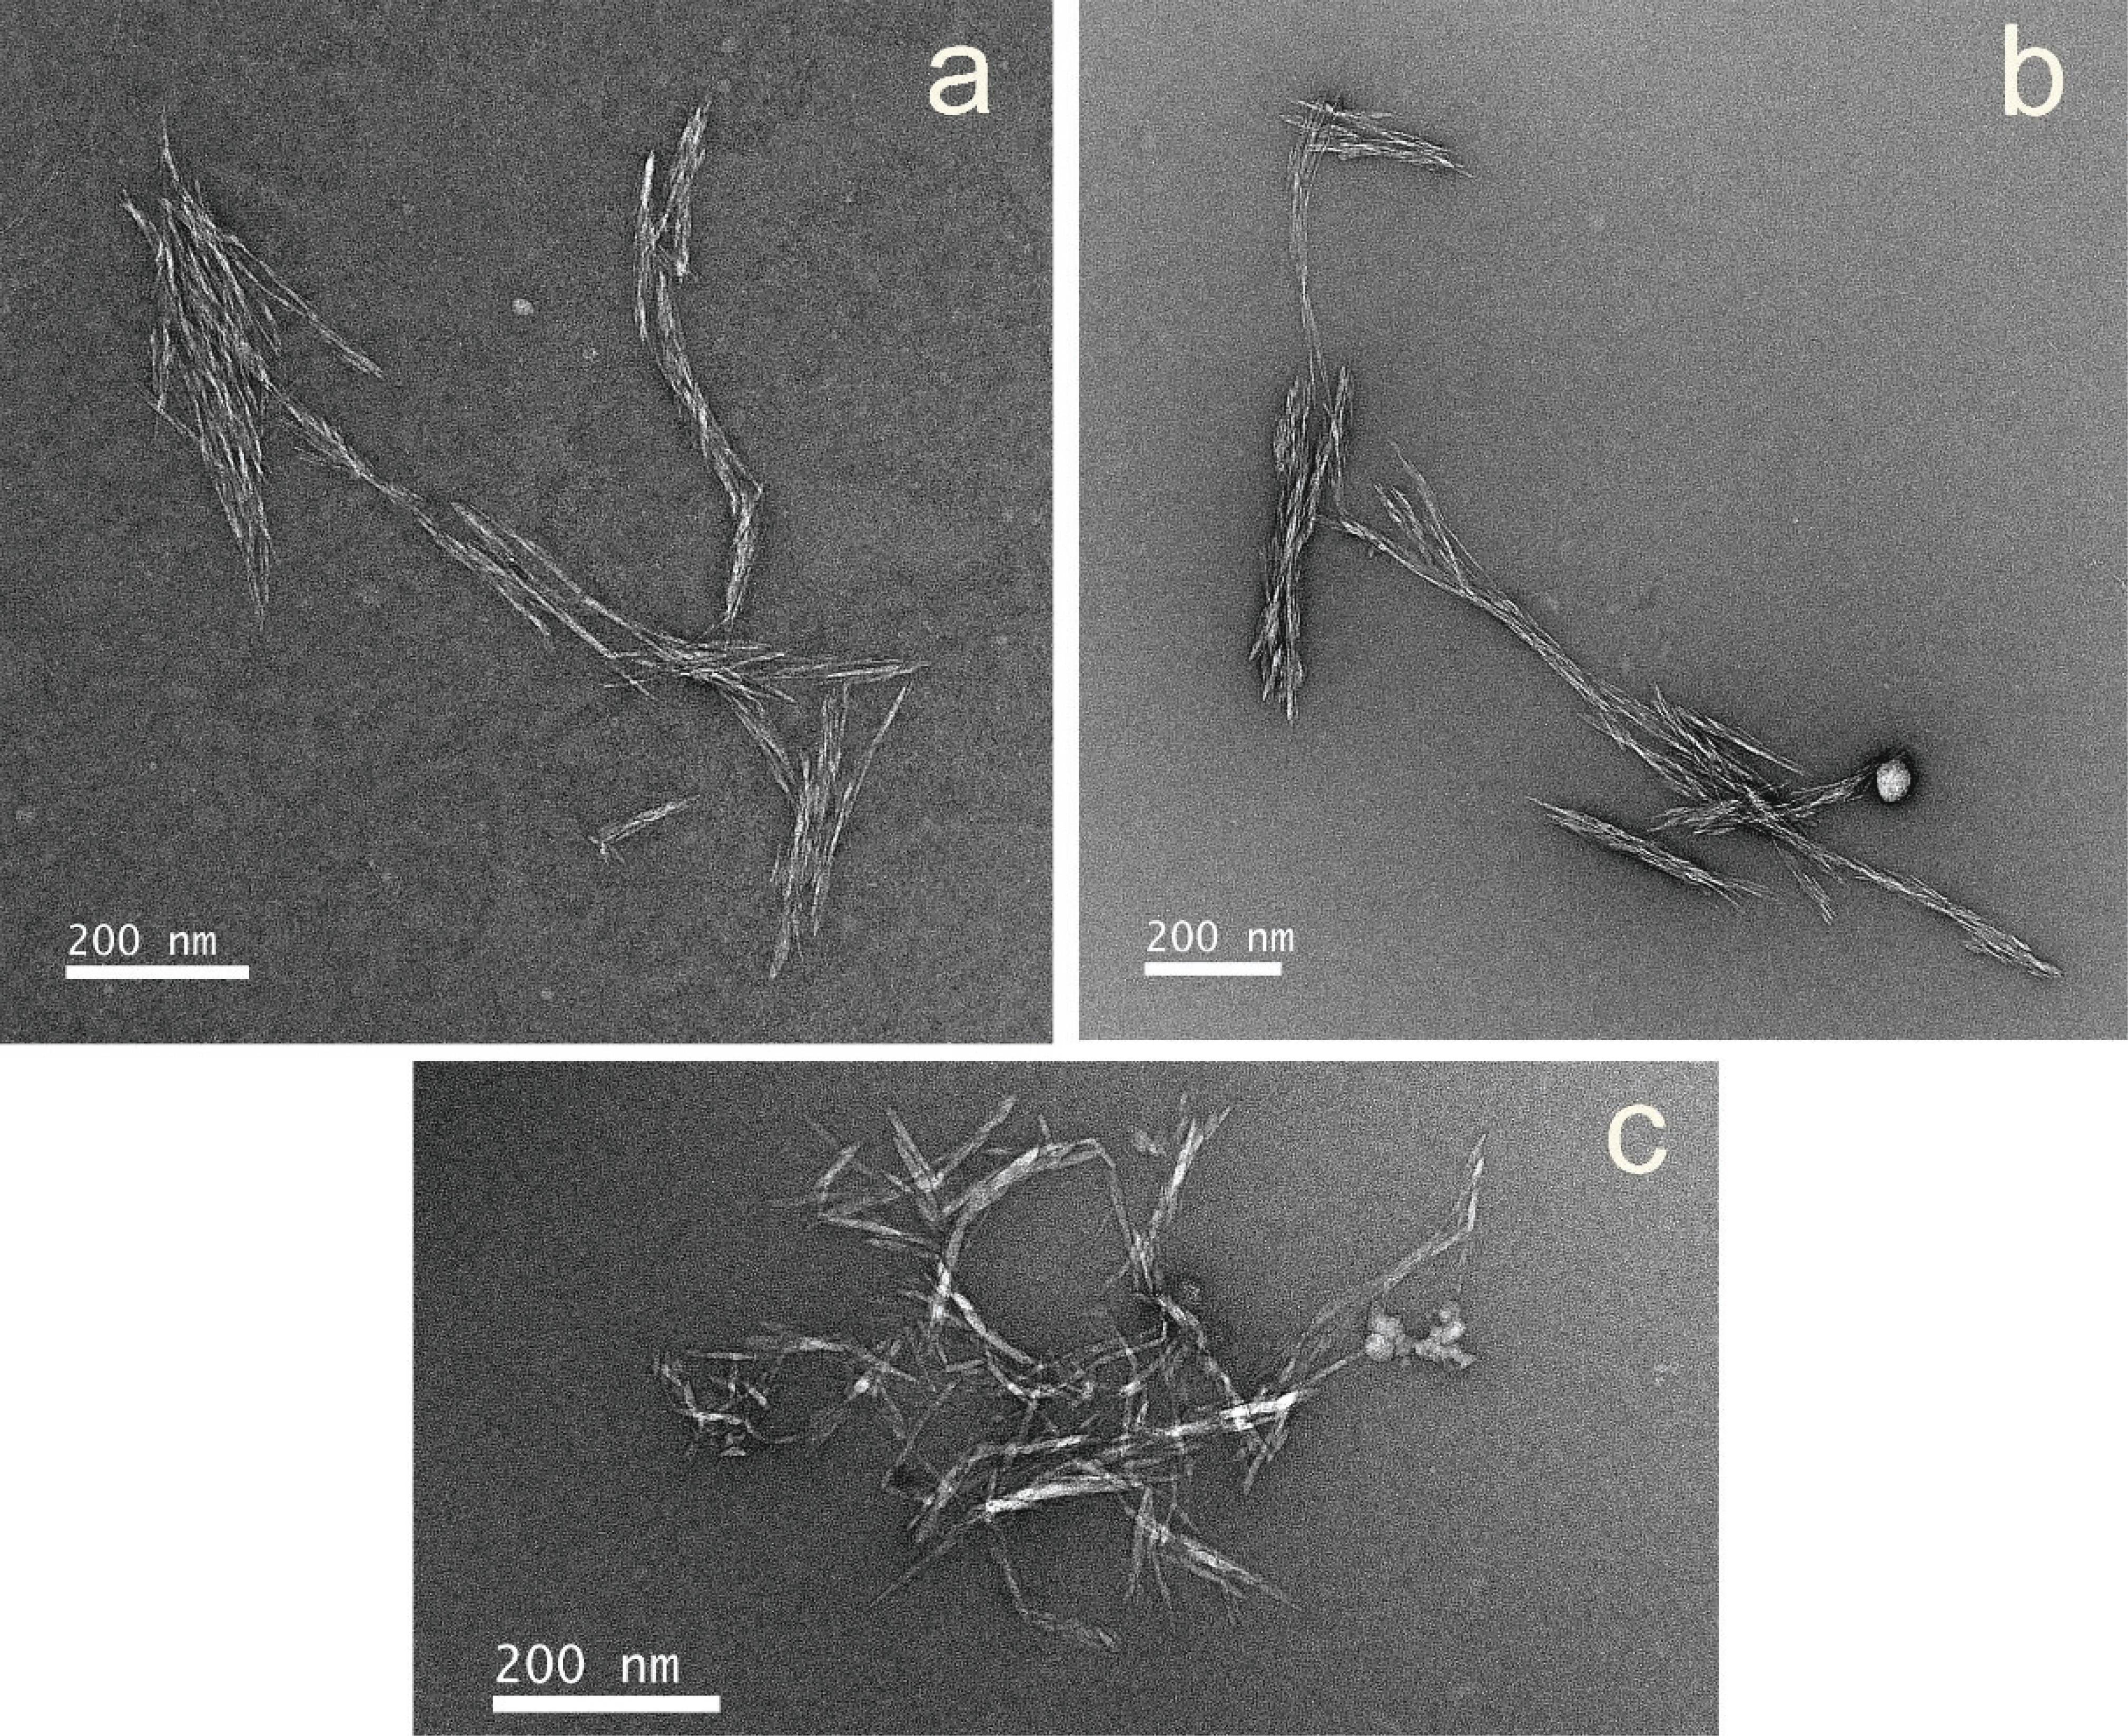
Fig. 1 shows TEM images of CNCs extracted from OPF using different APS concentration. As shown in Fig. 1, the average diameters of all CNCs from OPF were 10 nm with rod-like shape. TEM images showed that each treatment can be used to isolate CNCs from OPF. Based on cellulose nanofibers calculation, the dimension of the resulted CNCs was different by various APS concentration. 2M had an average length of 350.5 nm and diameter of 11.1 nm. Meanwhile, 1.5M showed an average length of 564.6 nm and diameter of 28.6 nm. Finally, 1M exhibited length of 102.2 nm and diameter of 63.5 nm. 2M showed the thinnest diameter and shortest length, compared to those from 1M and 1.5M. This result showed that the dimension of CNCs from OPF was bigger than CNCs extracted from kenaf bast using both sulfuric acid and hydrochloric acid (Zaini et al., 2013).
In terms of average length and diameter of CNCs from OPF, 2M has shown the highest aspect ratio (diameter to length) while 1M was the lowest. The higher APS concentration was resulted in big aspect ratio of CNCs. 2M were expected to have a high reinforcing capability due to the aspect ratio compared to other treatment. Zaini et al. (2014) mentioned that the increament of kenaf CNCs into cellulose acetate butyrate matrix led to a higher storage modulus of resulted composite.
FTIR spectra of RO and OPFCNCs are shown in Fig. 2. All spectra revealed similar characteristics. There is no considerable change of the conformation of the cellulose structure. A wide and intense peak between 3000-3700 cm−1 region which is shown in all spectra was assigned to the O-H bonds streching of polysaccharides (Castro-Guerrero and Gray, 2014; Goh et al., 2016; Jiang et al., 2017; Jo et al., 2016). The peak at around 1430 cm−1 is due to scissoring motion of CH2 representing crystalline region. In addition, the peak at around 1160 cm−1 is ascribed C-O-C bonding of ß-glucosidic bond (Castro-Guerrero and Gray, 2014; Goh et al., 2016; Jiang et al., 2017; Jo et al., 2016). Moreover, The vibration peak at 898 cm-1 is attributed to C–H stretching out of plane ring which are symmetric in polysaccharides of cellulose due to β -linkage or the glycoside bonds (Adel et al., 2011; Troedec et al., 2008; Castro-Guerrero and Gray, 2014; Goh et al., 2016; Jiang et al., 2017). All spectra showed the characteristics of typical cellulose I (Zaini et al., 2013; Tahir et al., 2015; Castro-Guerrero and Gray 2014; Goh et al., 2016; Jiang et al., 2017; Oun et al., 2017).
The peak at 1508 cm-1 is appointed for C=C of the aromatic ring of lignin (Troedec et al., 2008; Goh et al., 2016; Jiang et al., 2017), which is present only in RO spectra. This indicates that lignin was removed after APS treatment in all chemical concentration. In addition, the peak at 1735 cm-1 in the RO and 1 Mare assigned to the C=O stretching of the acetyl and uronic ester groups of hemicelluloses and the ester linkage of the carboxylic groups of the ferulic and p-coumaric acids of lignin and/or hemicellulose (Biagiotti et al., 2004; Liu et al., 2004; Sun et al., 2005; Goh et al., 2016; Jo et al., 2016). The highest intensity of this peak was in RO, decreased in 1 M and disappeared in 1.5 M and 2 M. The disappearance of this peak indicates that lignin and hemicellulose were completely removed.
The intensity of the peak due to waxes and oils at 2850 cm-1 was decreased as APS concentration increased (Troedec et al., 2008; Castro-Guerrero and Gray, 2014; Goh et al., 2016). No peak was observed in the 2800–2700 cm-1 range ascribable to aldehyde or ketone groups (Castro-Guerrero and Gray, 2014), indicating that no aldehyde or ketone groups occurred in the resulted CNCs.
Spectra around 1635 cm-1 is ascribed to C=O band which is corresponding to the sodium carboxylate (COO-Na+) occurred during neutralization of CNCs with NaOH (Castro-Guerrero and Gray, 2014; Oun et al., 2017). The oxidation is also indicated by the presence of the C=O band.
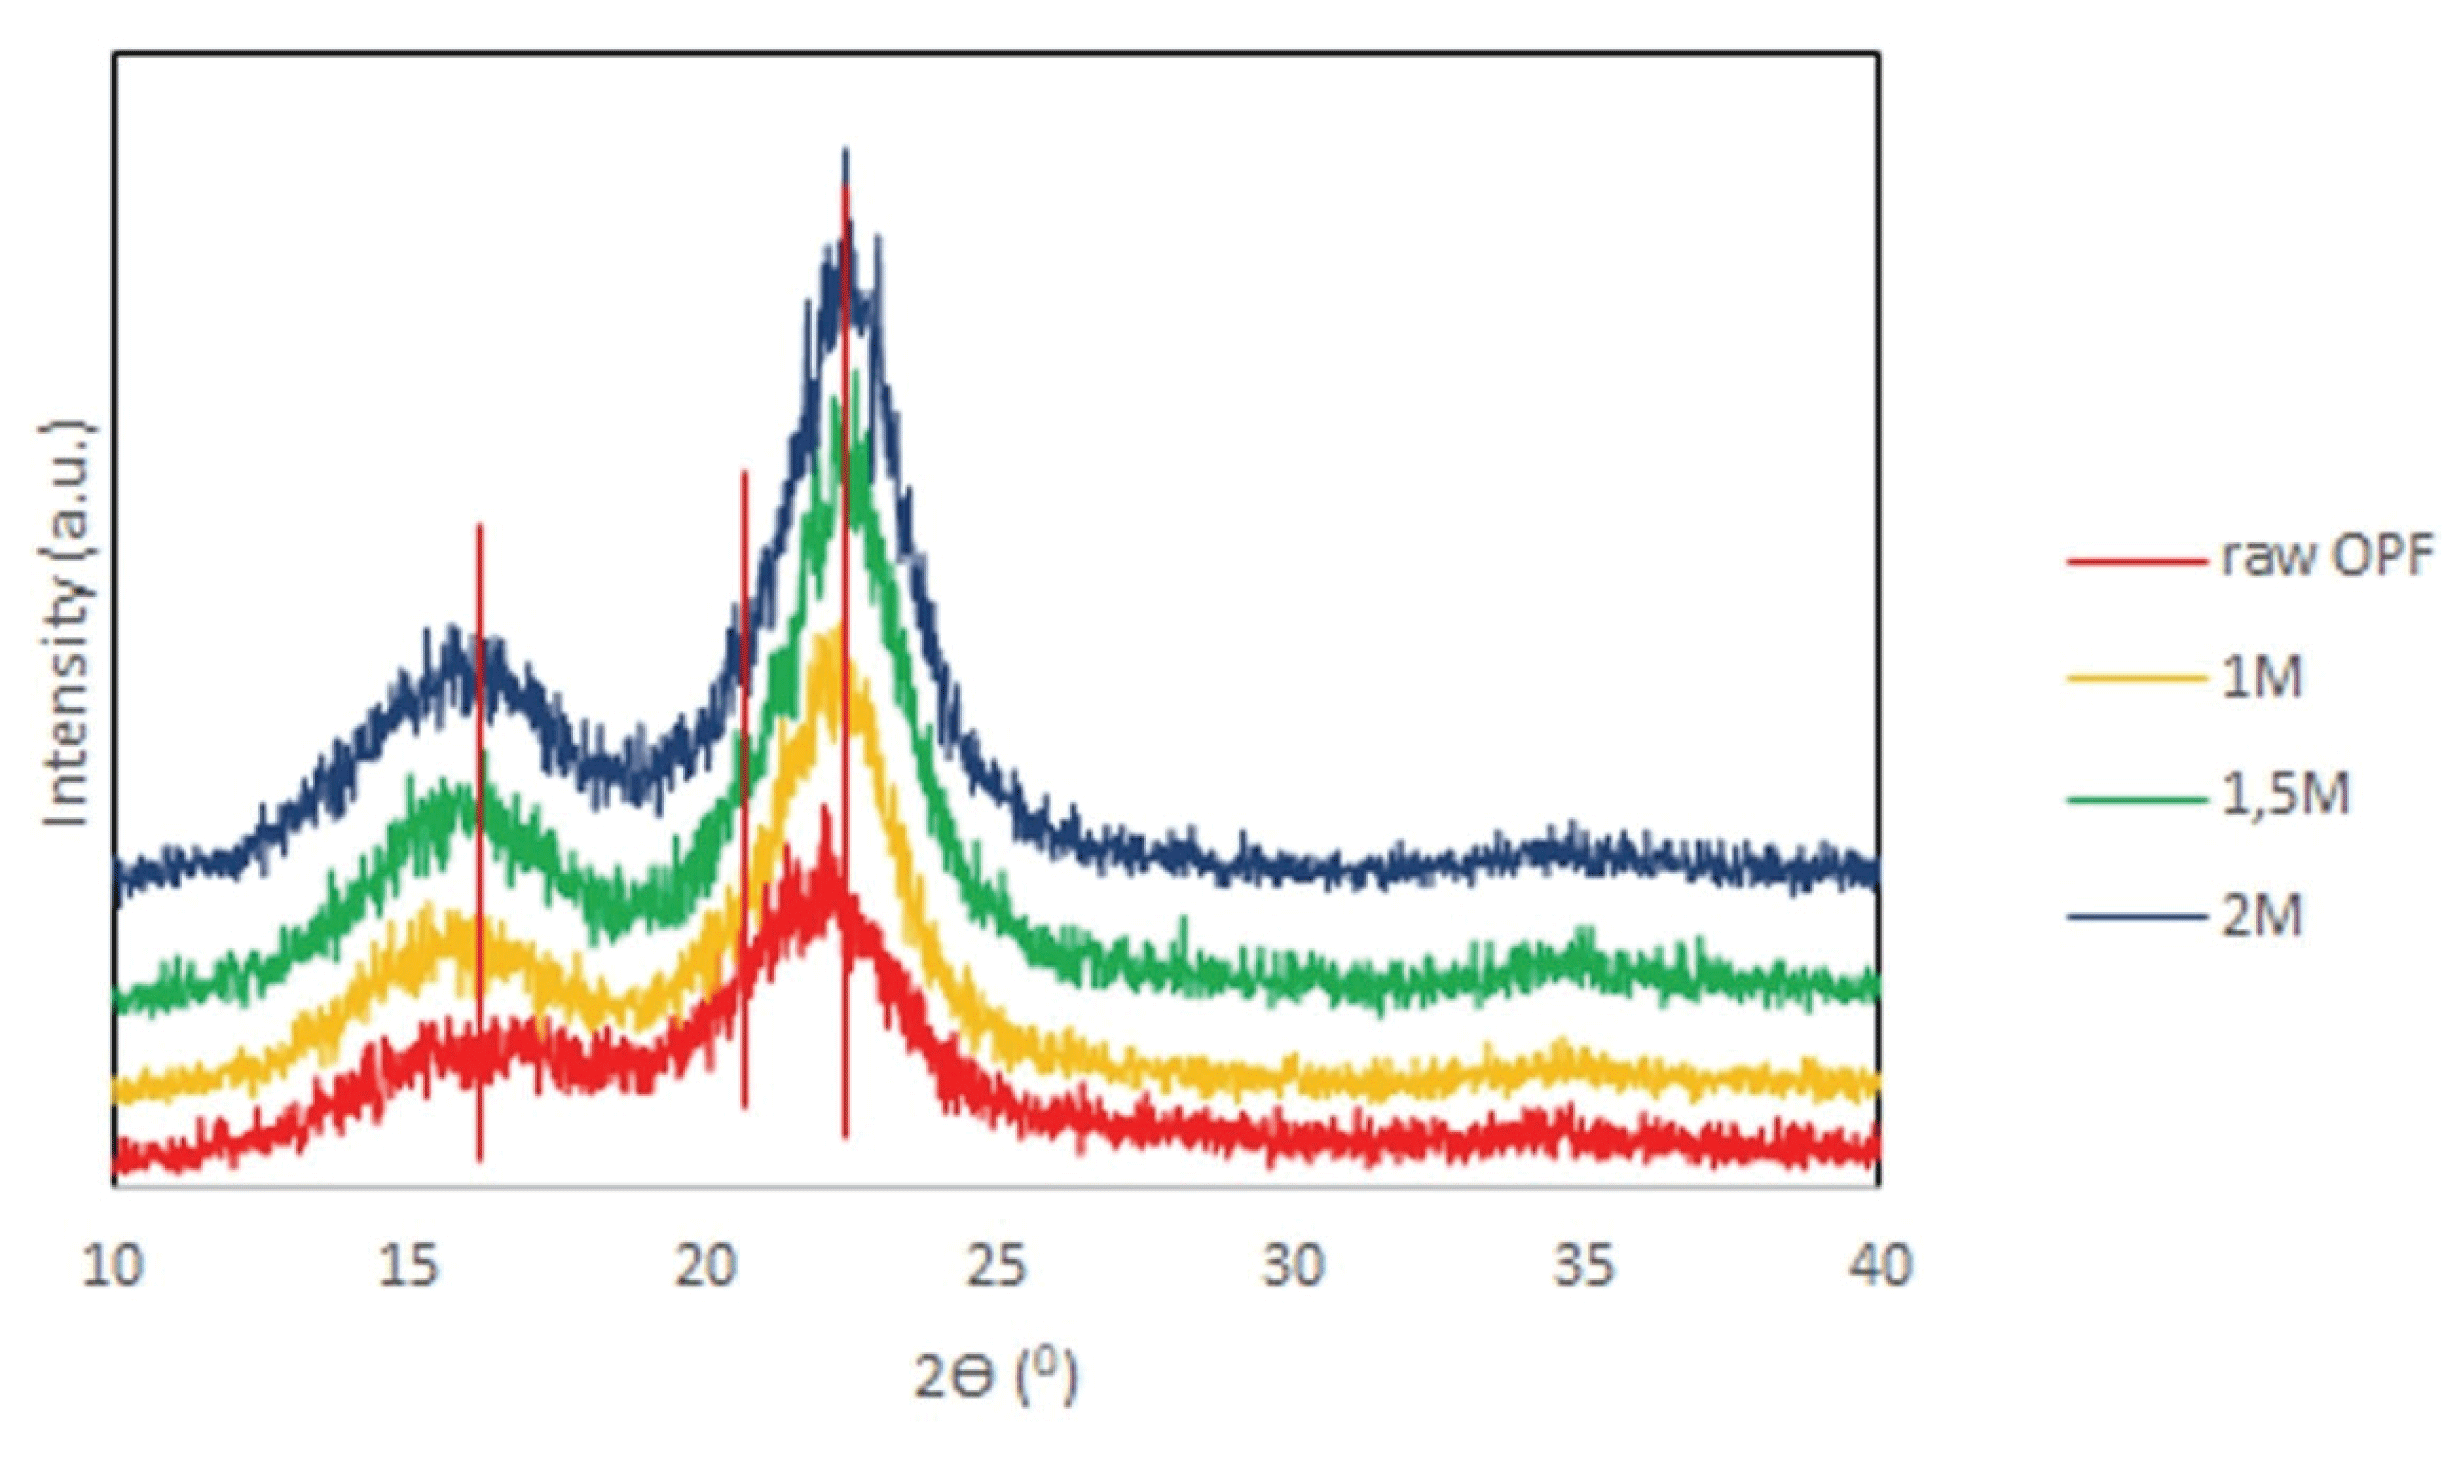
The X-ray diffraction profiles of RO and CNCs are shown in Fig. 3. All diffractograms showed the reflections at 2θ=14.7°, 16.2°, and 22.7°, attributed to the (1-10), (110) and (200) crystallographic planes of typical cellulose I while the amorphous phases ascribed by reflection at 18° (Leung et al., 2011; Oun and Rhim, 2015; Tahir, 2015; Jiang et al., 2017). It was indicating that APS treatment does not change the crystal structure of cellulose I in OPF. This result was also supporting previous FTIR analysis result.
The crystallinity index (CRI) can be seen in Table 1. The Ruland–Vonk method was preferred for crystallinity determination since it provides a more accurate measure of the crystallinity by analyzing the contributions from both amorphous and crystalline cellulose of the XRD diffraction pattern (Park et al., 2010). The crystallinity of CNCs was increased as APS concentration increased. The removal of lignin and hemicelluloses from RO were responsible for the increasing of the crystallinity. Moreover, the removal ability of amorphous area of cellulose after APS treatment must be increased as the concentration of APS increased.
| Concentration of APS | CRI |
|---|---|
| Raw OPF | 26.5% |
| 1M | 49.7% |
| 1.5M | 51.3% |
| 2M | 52.4% |
1M, 1.5M and 2M had double crystallinity compared to RO. The crystallinity index of APS treated fibers was studied using many samples such as flax 75%, flax shives 64%, hemp and triticale 73%, microcrystalline cellulose 83%, wood pulp 81%, bacterial cellulose 70% (Leung et al., 2011). However, all resulted CNCs crystallinity indicated lower value compared to all samples previously mentioned. XRD integral method used by Leung et al. (2011) produces values that are significantly higher than CRI calculation in this study (Park et al., 2016). Meanwhile, as a comparison, cellulose nanofibers isolated from various sources were exhibited crystallinity index of kenaf core 62% (Jonoobi, 2010), kenaf bast 72% (Zaini et al., 2013), cotton 85% (Castro-Guerrero and Gray, 2014), microfibrilllated cellulose 76% (Goh et al., 2016), and cotton linter 93.5% (Oun and Rhim, 2017).
As reinforcement material, thermal stabilities of CNCs are important particularly to fulfill minimal thermal acceptance in composite material processing. Depending on the type of matrix/binder used, generally biocomposites are manufactured at temperature between 150 to 300 °C. Minimum thermal acceptance in composite processing usually needs temperature around 180 –200 °C (Mohanty et al., 2000).
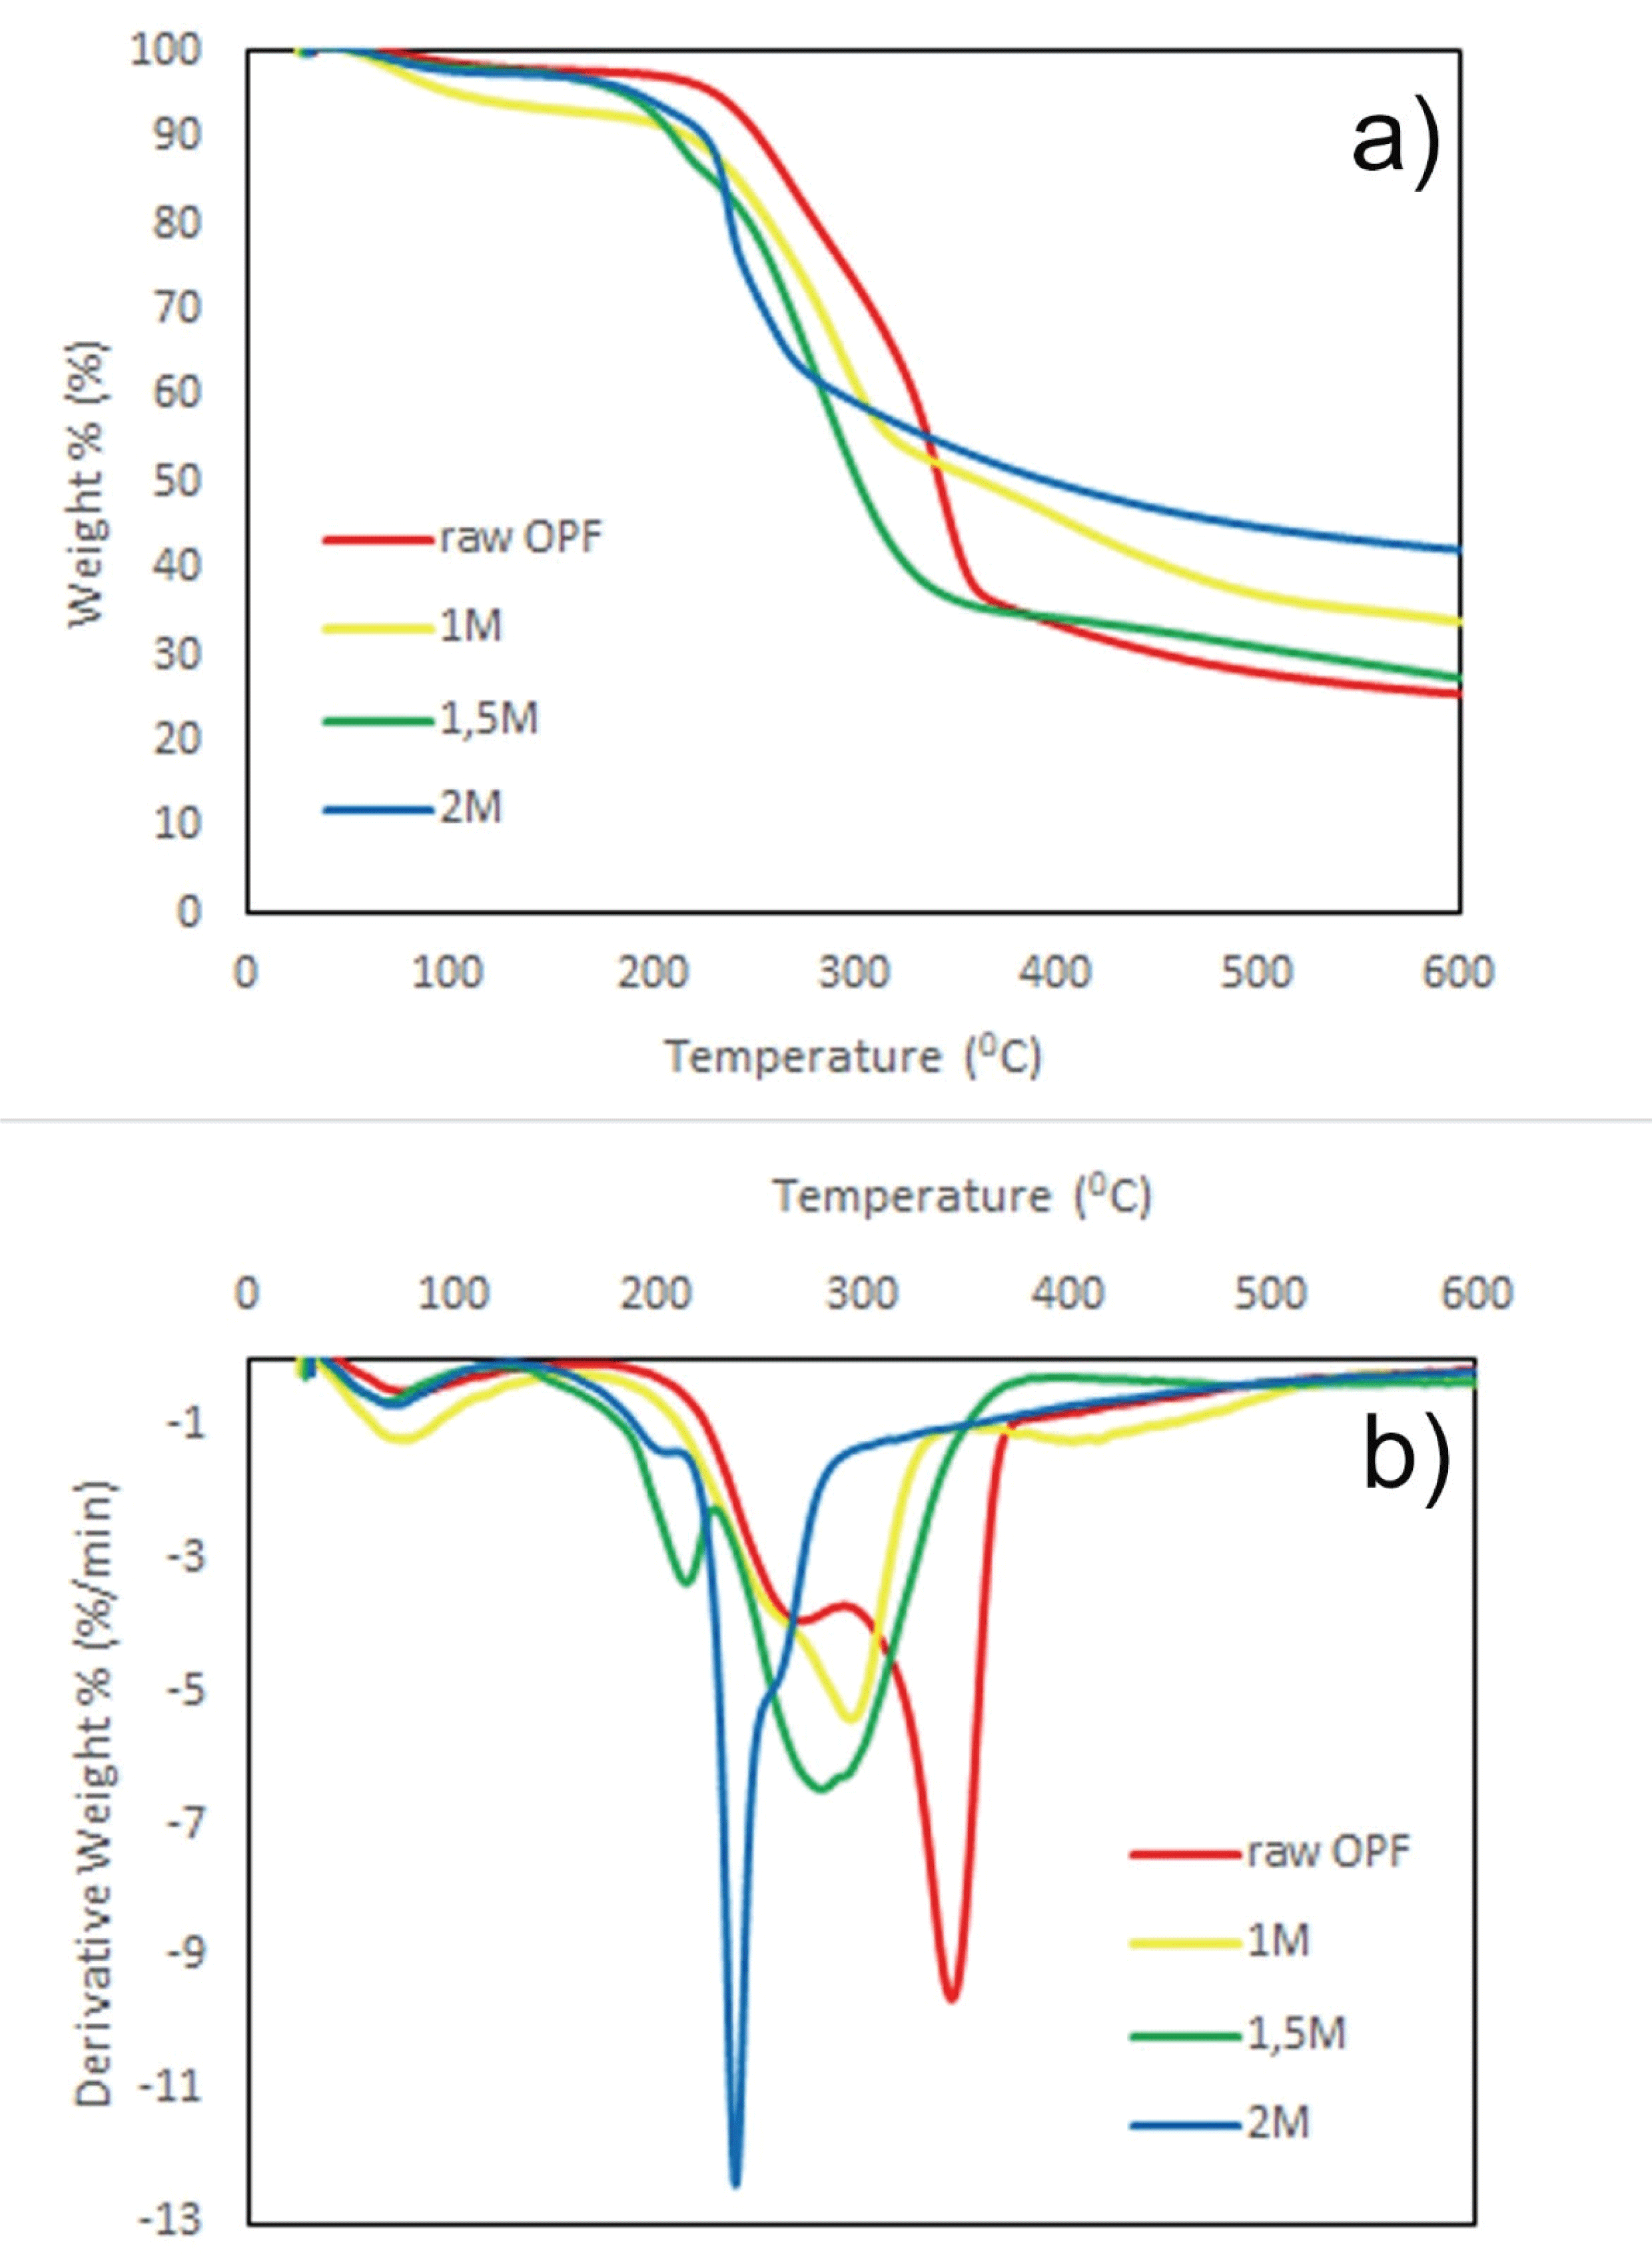
Fig. 4 shows TG and DTG thermograms of RO, 1M, 1.5M, and 2M. All thermograms were shifted to the lower temperature as the APS concentration increase. RO and 1M were observed to start degrading at 165 °C inferring degradations of both hemicellulose and lignin. Hemicellulose is starting to decompose at around 200 °C while lignin degrades in a wider temperature ranging from 100 to 900 °C (Yang et al., 2007). Upon the primary region, degradation of cellulosic material occurred at the temperatures as shown in Table 2.
| Tdec (°C) | Tmaxd(°C) | |
|---|---|---|
| OPF | 344 | 400-600 |
| 1M | 297 | 350-600 |
| 1.5M | 279 | 400-600 |
| 2M | 238 | 350-600 |
Decomposition termperature was decreased as much as 14%, 19%, and 31% for 1M, 1.5M, and 2M, respectively. The possible reason of thermal stability decreasing as APS concentration increase might be explained by increasinglarge surface area because of particle size decrease (Goh et al., 2016; Oun and Rhim, 2017). Low degree of polymerization inclined to degrade at low temperatures. Furthermore, 1.5M and 2M show peaks between temperature 200-250 °C are suspected to be instigated by the presence of sodium carboxyl groups on the surface of CNCs (Oun and Rhim, 2017). However, all the results in this study still met the minimum requirement of composite processing since minimum thermal acceptance usually needs temperature around 180–200 °C. After the temperature reaches 400 °C, cellulose will be fully degraded, transformed to gaseous products and CO2 with non-combustible residues (Oun and Rhim, 2017).
4. CONCLUSION
In this study, CNCs were successfully isolated from OPF using one-step procedure using APS. Needle-like CNCs with tendency to agglomerate showed the diameter ranging from 11 to 63 nm and length from 100 to 600 nm. Concentration of 2 M APS treatment showed the optimal condition for isolating CNCs with thinnest diameter and highest aspect ratio. FTIR and XRD analyses showed no change on the original crystal structures during the oxidation process. Crystallinity was increased as the APS concentration increased while thermal stability decreased.


