


1. INTRODUCTION
Recently, many people have concern on the energy efficiency of buildings because the price for energy is high and the issue on the weather change, caused by the global warming which in turn caused by the increased CO2 accumulation in the air, become one of the major topics of the world. Most of the energy we use in these days is coming from the combustion of the fossil fuel including oil, coal and natural gas. We use the heat released from the combustion of the fossil fuels for heating of the residential buildings or generating electricity that is used for heating, air conditioning or lighting of the houses. Actually, more than 35% of the total energy consumed in our country is used in the construction sector including residential buildings. Therefore, it is important for the decrease of the total energy consumption to increase the energy efficiency of residential housings.
In these days, people who want to build or select their own houses want to have houses with better thermal resistance and higher energy efficiency. Many countries in this world have raised the basic requirements for energy efficiency of buildings to reduce energy consumption and to participate in the world’s movement against the weather change caused by the global warming. The timber construction industry cannot meet these raised requirements for energy efficiency with the conventional method for light-frame timber construction in which only mid-layer insulation is applied, which means installing only the insulation layer between framing members. Sometimes, the thickness of the mid-layer insulation is increased to increase the energy efficiency and the insulation performance of the house by inserting thicker insulation material between the thicker framing members, even though it is questionable whether the increased mid-layer insulation can contribute to the increase of energy efficiency of the whole building.
There may be infinitely many ways to increase the energy efficiency of a house even though we cannot test all the possible methods before determining one. If there is a simple simulation method to estimate exactly the energy efficiency or insulation properties of various composition of building structures, we can save a lot of money and time required for testing those specimens under actual environment. Kang et al. (2007) showed that transfer of heat and air through wall structures can be expressed by sum of properties of each component composing the wall (superposition principle). Kim et al. (2011) tested heat transfer through various composition of light-frame wood wall structures including thick lumber panel interior finish and concluded that the conventional wall structure cannot meet the required heat transfer coefficient for Passive house or even the increased requirement of insulation properties of these days. They also concluded that thick lumber panel interior finish showed higher thermal performance than the conventional gypsum board interior finish. Kim (2013) tested many kinds of wall structures for their thermal performance and compared the results of tests with theoretical models developed by application of superposition principle. In addition, there have been some researches on the thermal performance of wooden and concrete wall structures by using several kinds of the developed or commercially available software (Kang and Kim, 2016; Seo et al., 2017; Seo et al., 2016; Yu et al., 2013). Even though couple of researches on the heat transfer through the wall structures were performed by applying some existing software and experiments, there are not enough test data on the temperature distribution in the wall structure, and analysis on where and how condensation and water accumulation may be developed in the wall structure.
In this study, light-frame timber walls with various composition of insulation layers were exposed to temperature differences between the warm interior and cold exterior sides to measure the temperature change through the wall thickness. In addition, three theoretical models estimating thermal resistance of wall structures with various compositions of insulation layers were constructed and their estimation were compared with the actual measurements of temperature changes through wall thickness. The efficiency of theoretical models and the effects of adding various insulation layers were verified through these comparisons between theoretical and actual temperature changes inside of the walls for wall specimens with various composition of insulation layers.
2. MATERIALS and METHODS
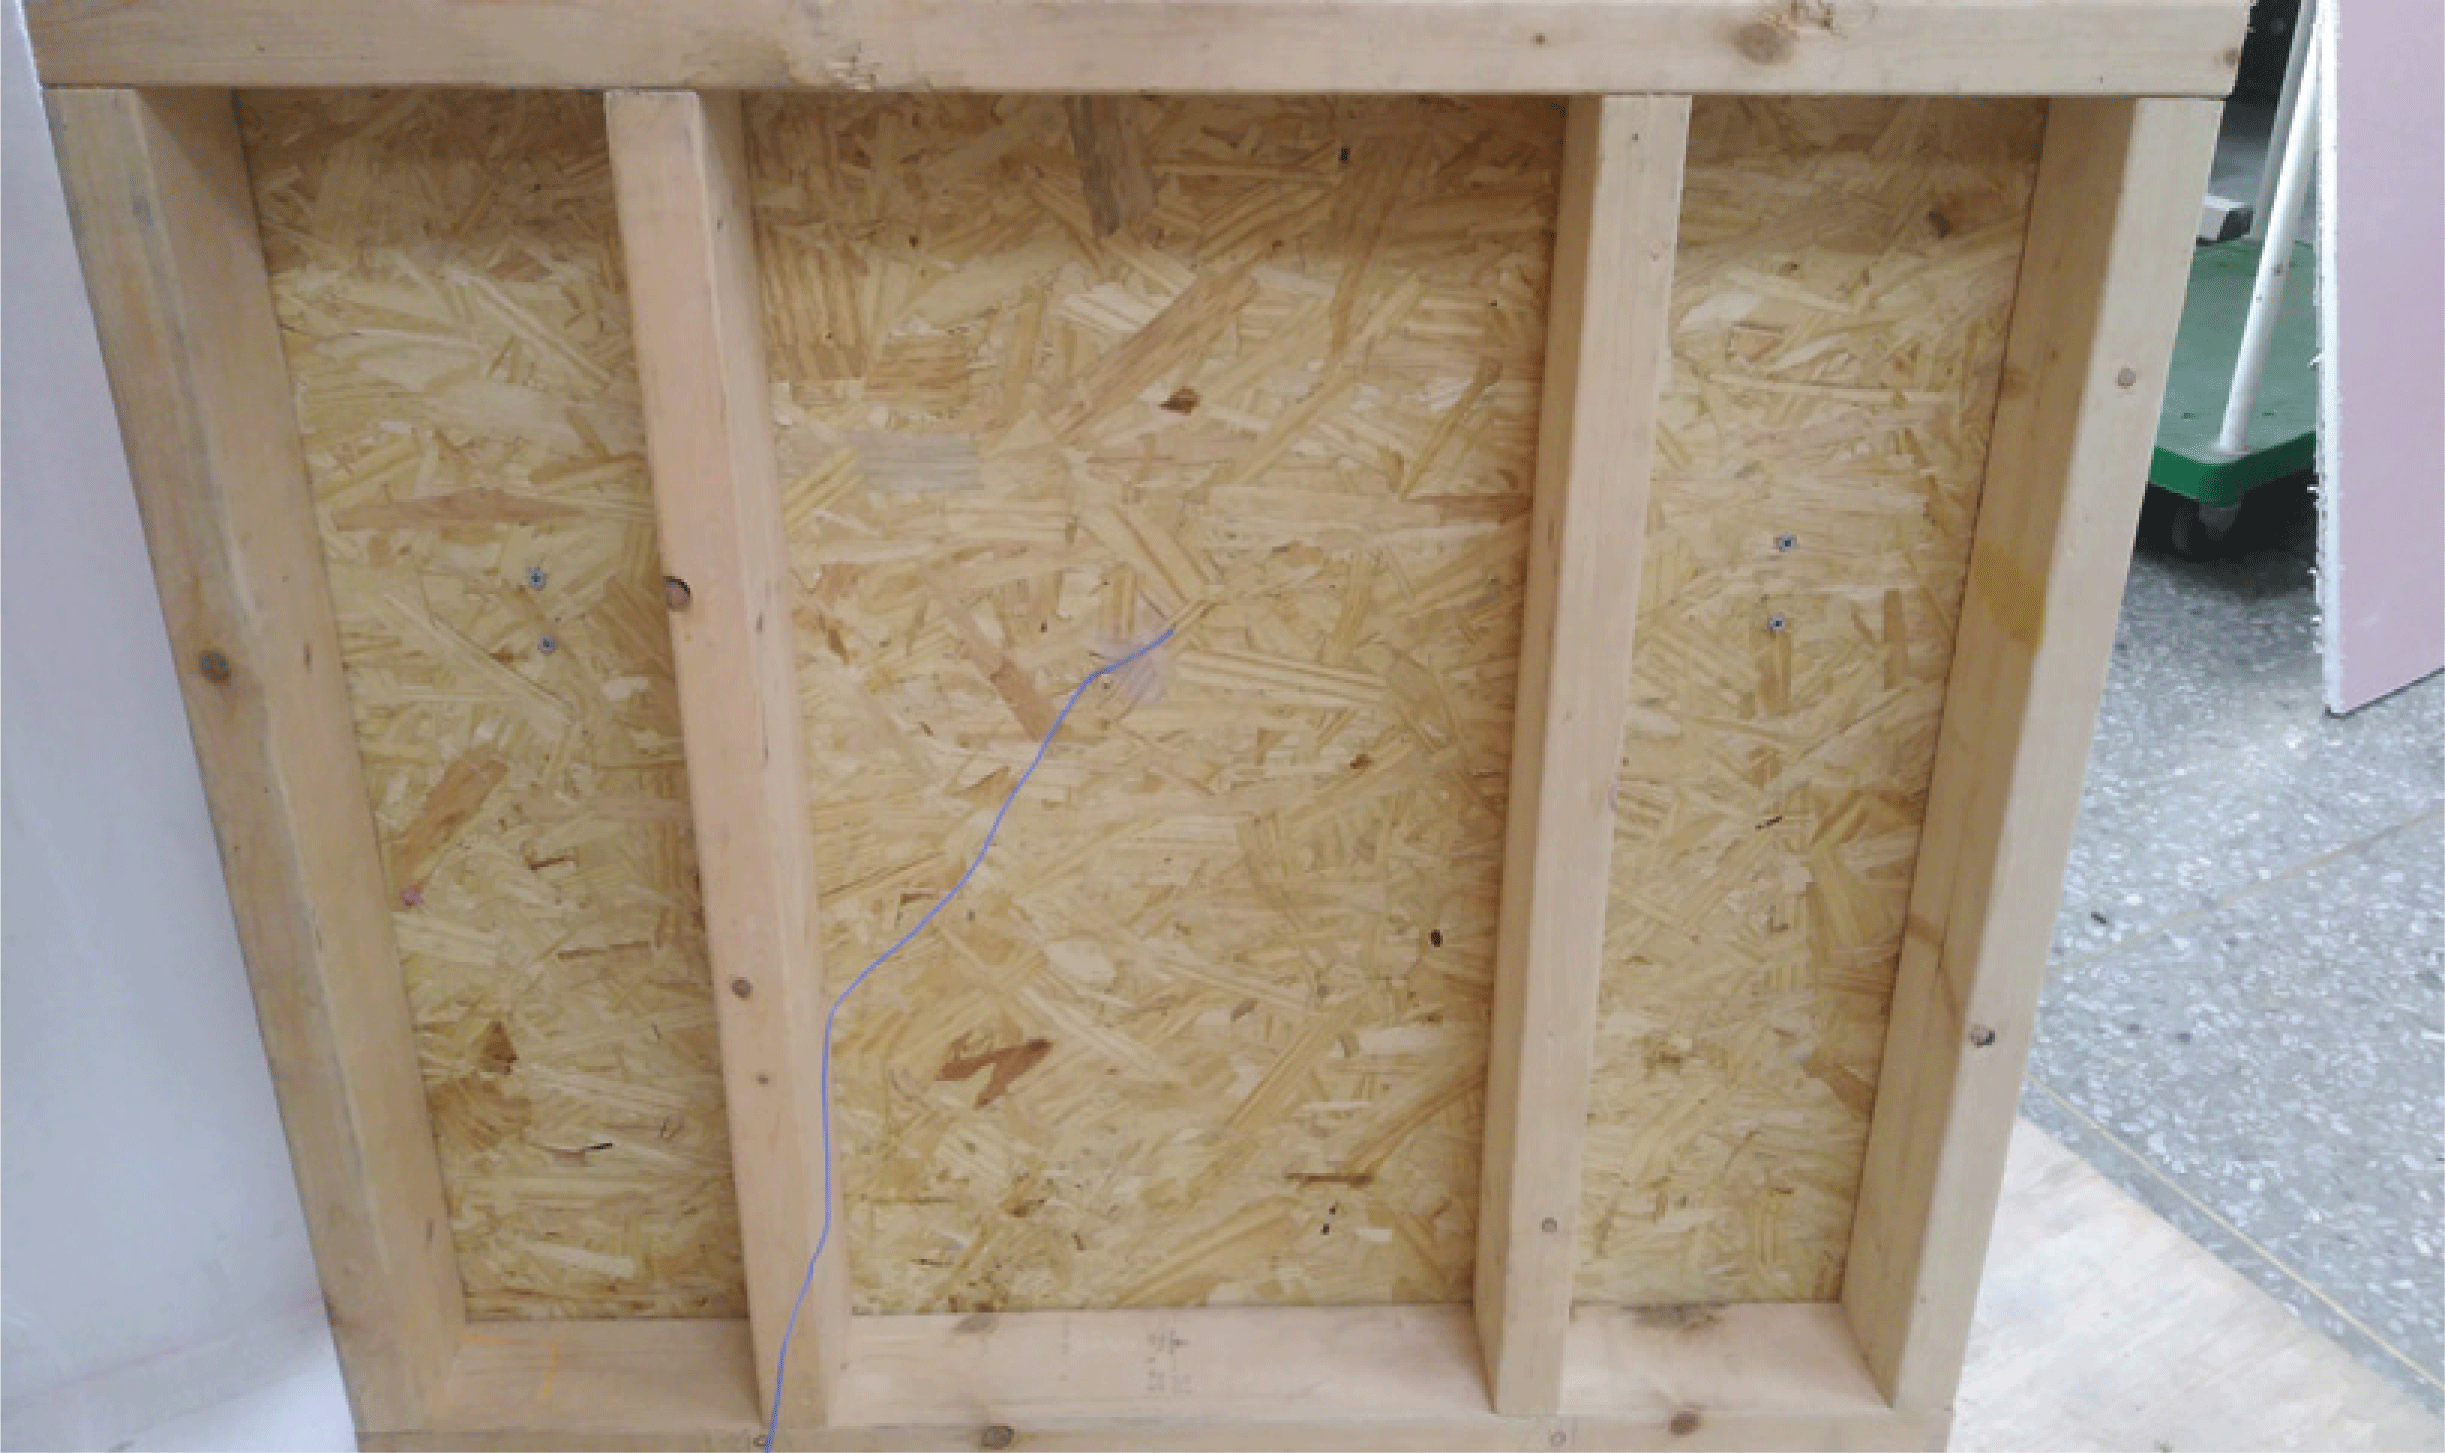
Wall specimens were constructed by applying the light-frame timber construction method with 2 × 4 and 2 × 6 studs. All the framing lumbers were Northern SPF No. 2 dimension lumbers. Wall sheathing was 11.1 mm thick OSB with span rating R-24. The interior side of wall framing was covered with 12 mm thick gypsum board that was attached to the framing members by using 38 mm long screws with 150 mm spacing along the edge and 300 mm spacing in the field. The stud spacing applied to wall specimen construction was 406 mm. 8d nails were applied to attach OSB sheathing with the spacing of 150 mm along the edge and 300 mm in the field. The insulation material was batt-type fiberglass with various thickness for mid-layer insulation, and expanded Styrofoam mat for inner- and outerlayer insulation. The exterior and interior finishing material was not applied when making the specimen. To check the effect of thick wallboard attached on the exterior or interior side of the wall specimen, 35 mm thick larch and Hem-fir lumbers having T&G edge were used as wallboards. The dimension of wall specimen was 900 mm × 900 mm with 406 mm stud spacing and a sample of wall specimen framing is given in Fig. 1.
To apply theoretical models and to compare the thermal resistances, three types of wall specimens were constructed as shown in Table 1.
In this study, three theoretical models estimating the insulation properties of the walls with various composition of insulation layers were constructed as follows:
1) Model 1: Model considering only the thermal transmittances of materials composing the wall specimens, expressed as Eq. (1)
in which, Rtotal: Thermal resistance of whole wall specimen
Ri: Thermal resistance of the ith material composing the wall specimen
2) Model 2: Model 1 plus consideration on the thermal resistances of the interior and exterior surfaces of the wall, expressed as Eq. (2)
in which, Rsf: Thermal resistance of the interior surface of the wall specimen
Rso: Thermal resistance of the exterior surface of the wall specimen
3) Model 3: Model 2 plus consideration on the thermal resistance of the surfaces of wood and wood-based panels inside the wall structure, expressed as Eq. (3)
in which, Rssj: Thermal resistance of the surfaces of wood and wood-based panels inside the wall specimen
The ratio between the temperature change in one layer and the total temperature change through the structure is proportional to the ratio of the thermal resistance of the layer against the total thermal resistance as given in the following equations.
in which, ΔTi: Temperature difference between the surface and the back of the ith layer
ΔTtotal: Total temperature difference between interior and exterior
Ti-1: Temperature of the surface of (i-1)th layer
Ti: Temperature of the back of ith layer
Therefore, the temperature between each layer composing the structure can be calculated as follows:
Equation (6) means that the temperature reduction equal to
The thermal resistance of the construction materials was calculated as the reciprocal of the thermal conductivity multiplied by the thickness of the material. The thermal conductivities of the materials composing wall specimens were measured by guarded hot plate method using thermal conductivity analyser, TCi, of C-THERM technology Co. Ltd. The materials used to measure heat conductivity were 35 mm thick larch lumber, 89 mm thick SPF lumber, 35 mm thick Hem-fir lumber, 11.1 mm thick OSB, 89 mm, 115 mm and 140 mm thick fiberglass insulation, 50 mm thick Styrofoam and 12 mm thick gypsum board. The thermal resistances of house wrap, interior and exterior surfaces of the wall specimen were obtained from the references (Kim, 2013; Kim, et al. 2011).
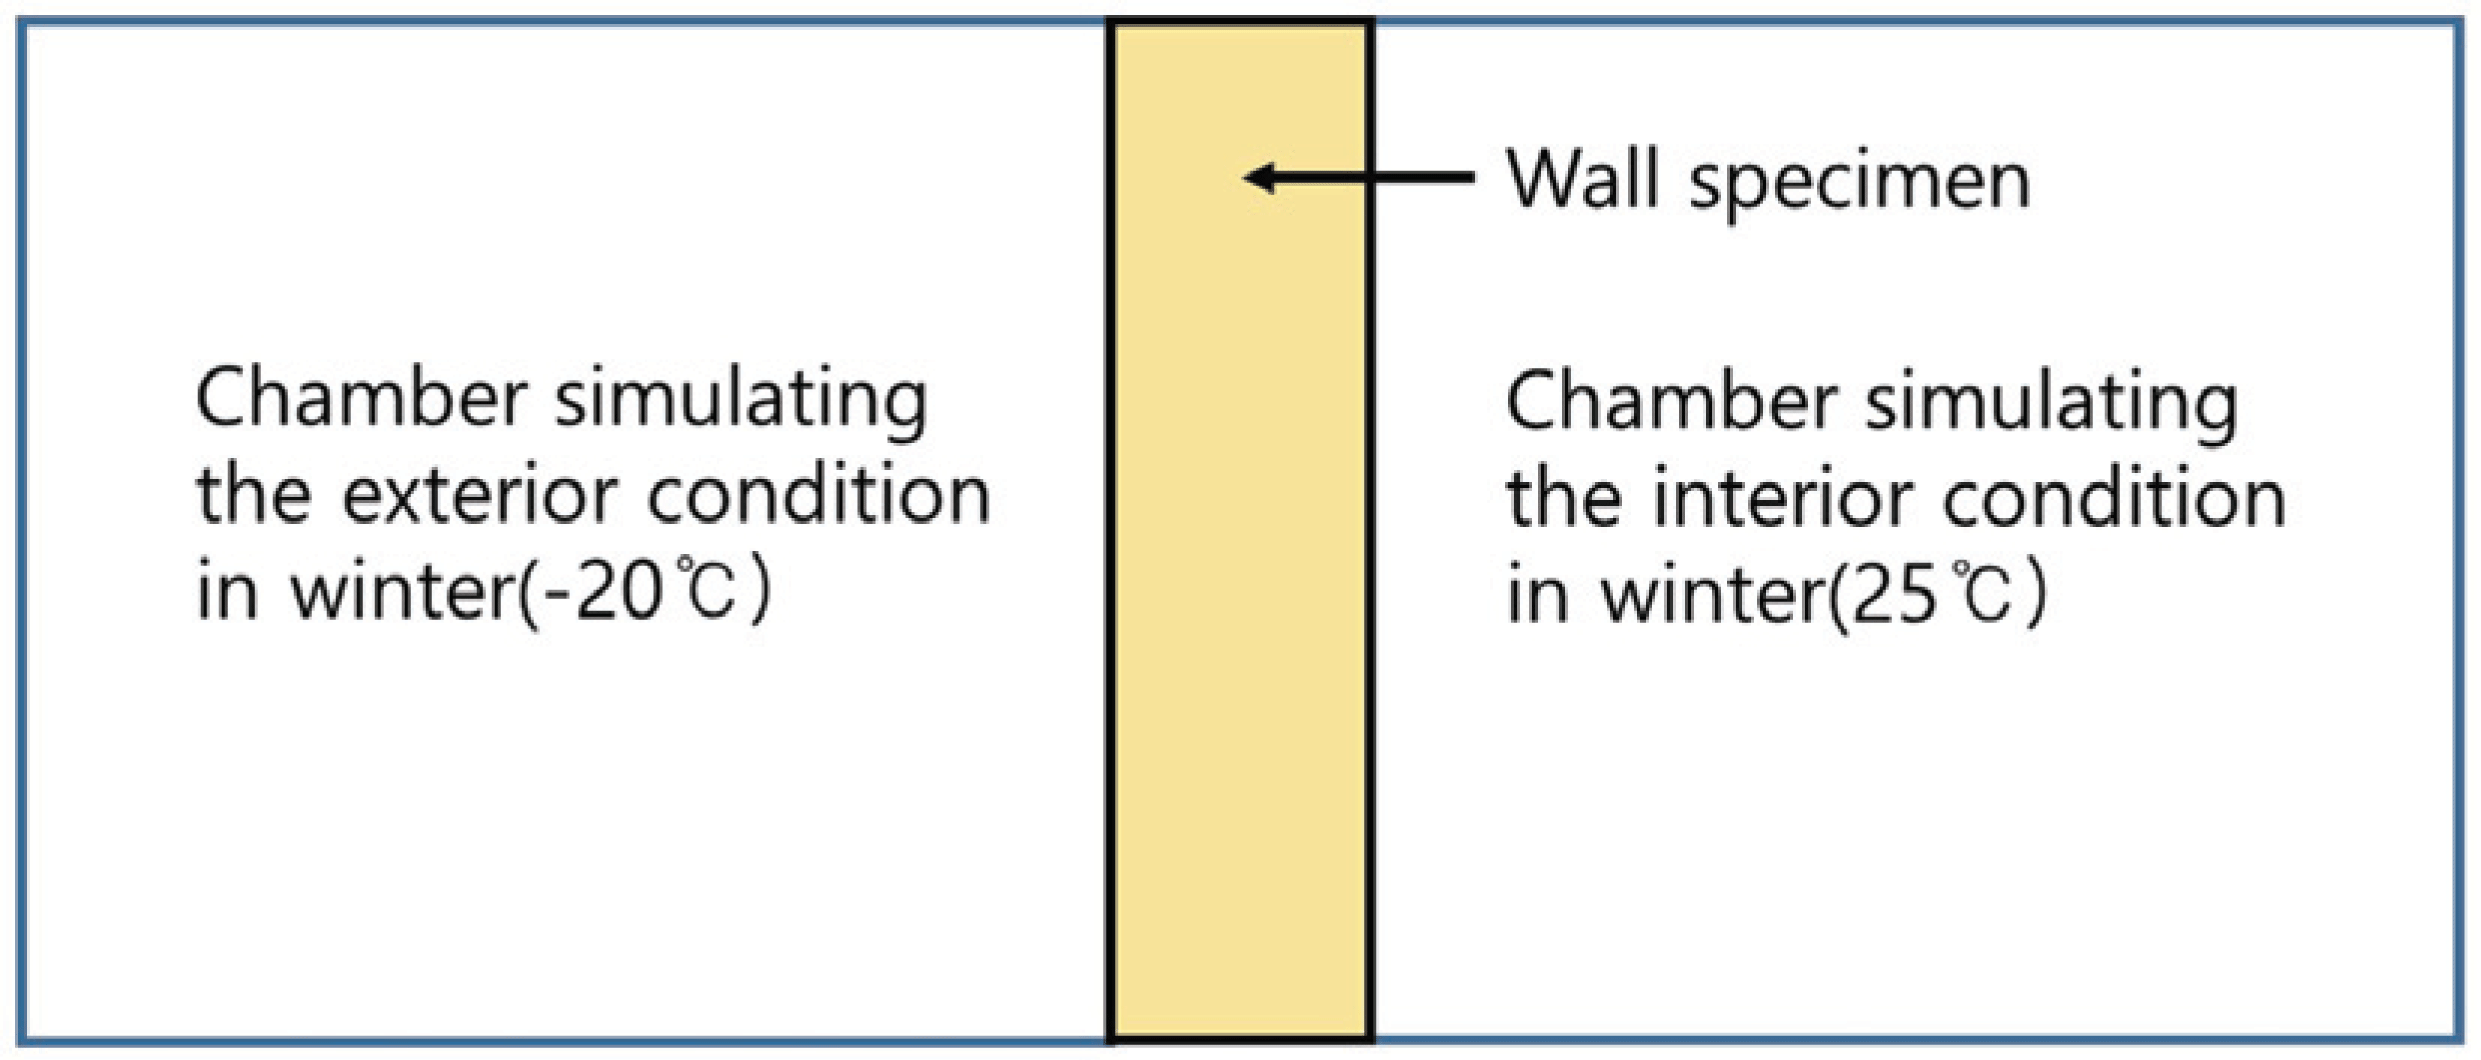
To measure the temperature change through the wall thickness, wall specimen was placed between two chambers maintaining constant temperatures in which one chamber was simulating the cold exterior condition (-20°C) during winter and the other chamber was simulating the warm interior condition (25°C) as shown in Fig. 2. In Fig. 2, the perimeter of wall specimen was covered by 200 mm thick Styrofoam to prevent heat loss through the edges of wall specimen. Clamping was applied on four sides of the instrument given in Fig. 2 to secure tight contact between wall specimen and two chambers. Temperature sensors were placed on the exterior and interior surfaces of the wall specimen, inside surfaces of wood-based panel and gypsum board, and between insulation layers in the wall specimen to measure the temperature changes through the wall thickness.
Wall specimens with various compositions of insulation layers were tested by using the instrument as shown in Fig. 2. The temperature measurements obtained from the tests were compared with the temperatures estimated by using three theoretical models given as equations (1), (2) and (3).
3. RESULTS and DISCUSSION
The thermal resistances of materials used to construct the wall specimens were obtained as given in Table 2. To obtain the thermal resistances of the materials, the thermal conductivities of the materials were measured first for larch, SPF, Hem-fir, OSB, fiberglass, Styrofoam and gypsum board. Then, the reciprocal of the thermal conductivity was multiplied by the thickness of the material to calculate the thermal resistance. The values for the thermal resistances of the house wrap, and the interior and exterior surfaces of wall specimen were determined from references (Kim, 2013; Kim, et al. 2011). The thermal resistance of the exterior surface of wall specimen was determined as 0.05(m2h°C/kcal) and that of the interior surface was determined as 0.13 (m2h°C/kcal). The values of the thermal resistances as shown in Table 2 for various materials used to construct wall specimen were combined together to make simulation models given as equations (1), (2) and (3) for wall specimens having corresponding composition.
Three theoretical models corresponding to equations (1), (2) and (3), namely model 1, model 2 and model 3, were constructed by inserting the thermal resistance values as given in Table 2 for the materials composing the wall specimen. The results of calculation of thermal resistance and temperature change coefficient for three types of wall specimens and three theoretical models are given in Table 3.
Starting from setting the temperature of the interior as T1, the temperature on the interior wall surface (T2) can be obtained by subtracting the temperature change coefficients multiplied by the thermal resistance of the interior surface from T1. The temperature on the inside of the first interior wallboard material (T3) can be obtained by subtracting the temperature change coefficients multiplied by the thermal resistance of the first interior wallboard material from T2. The same process can be repeated by changing the thermal resistance value of the layer as passing through the thickness of wall specimen until it is reached to the exterior.
The results of actual tests using the instrument as given in Fig. 2 and the estimations of temperature change through the thickness of wall specimen by three theoretical models for type I wall specimen are given in Table 4.
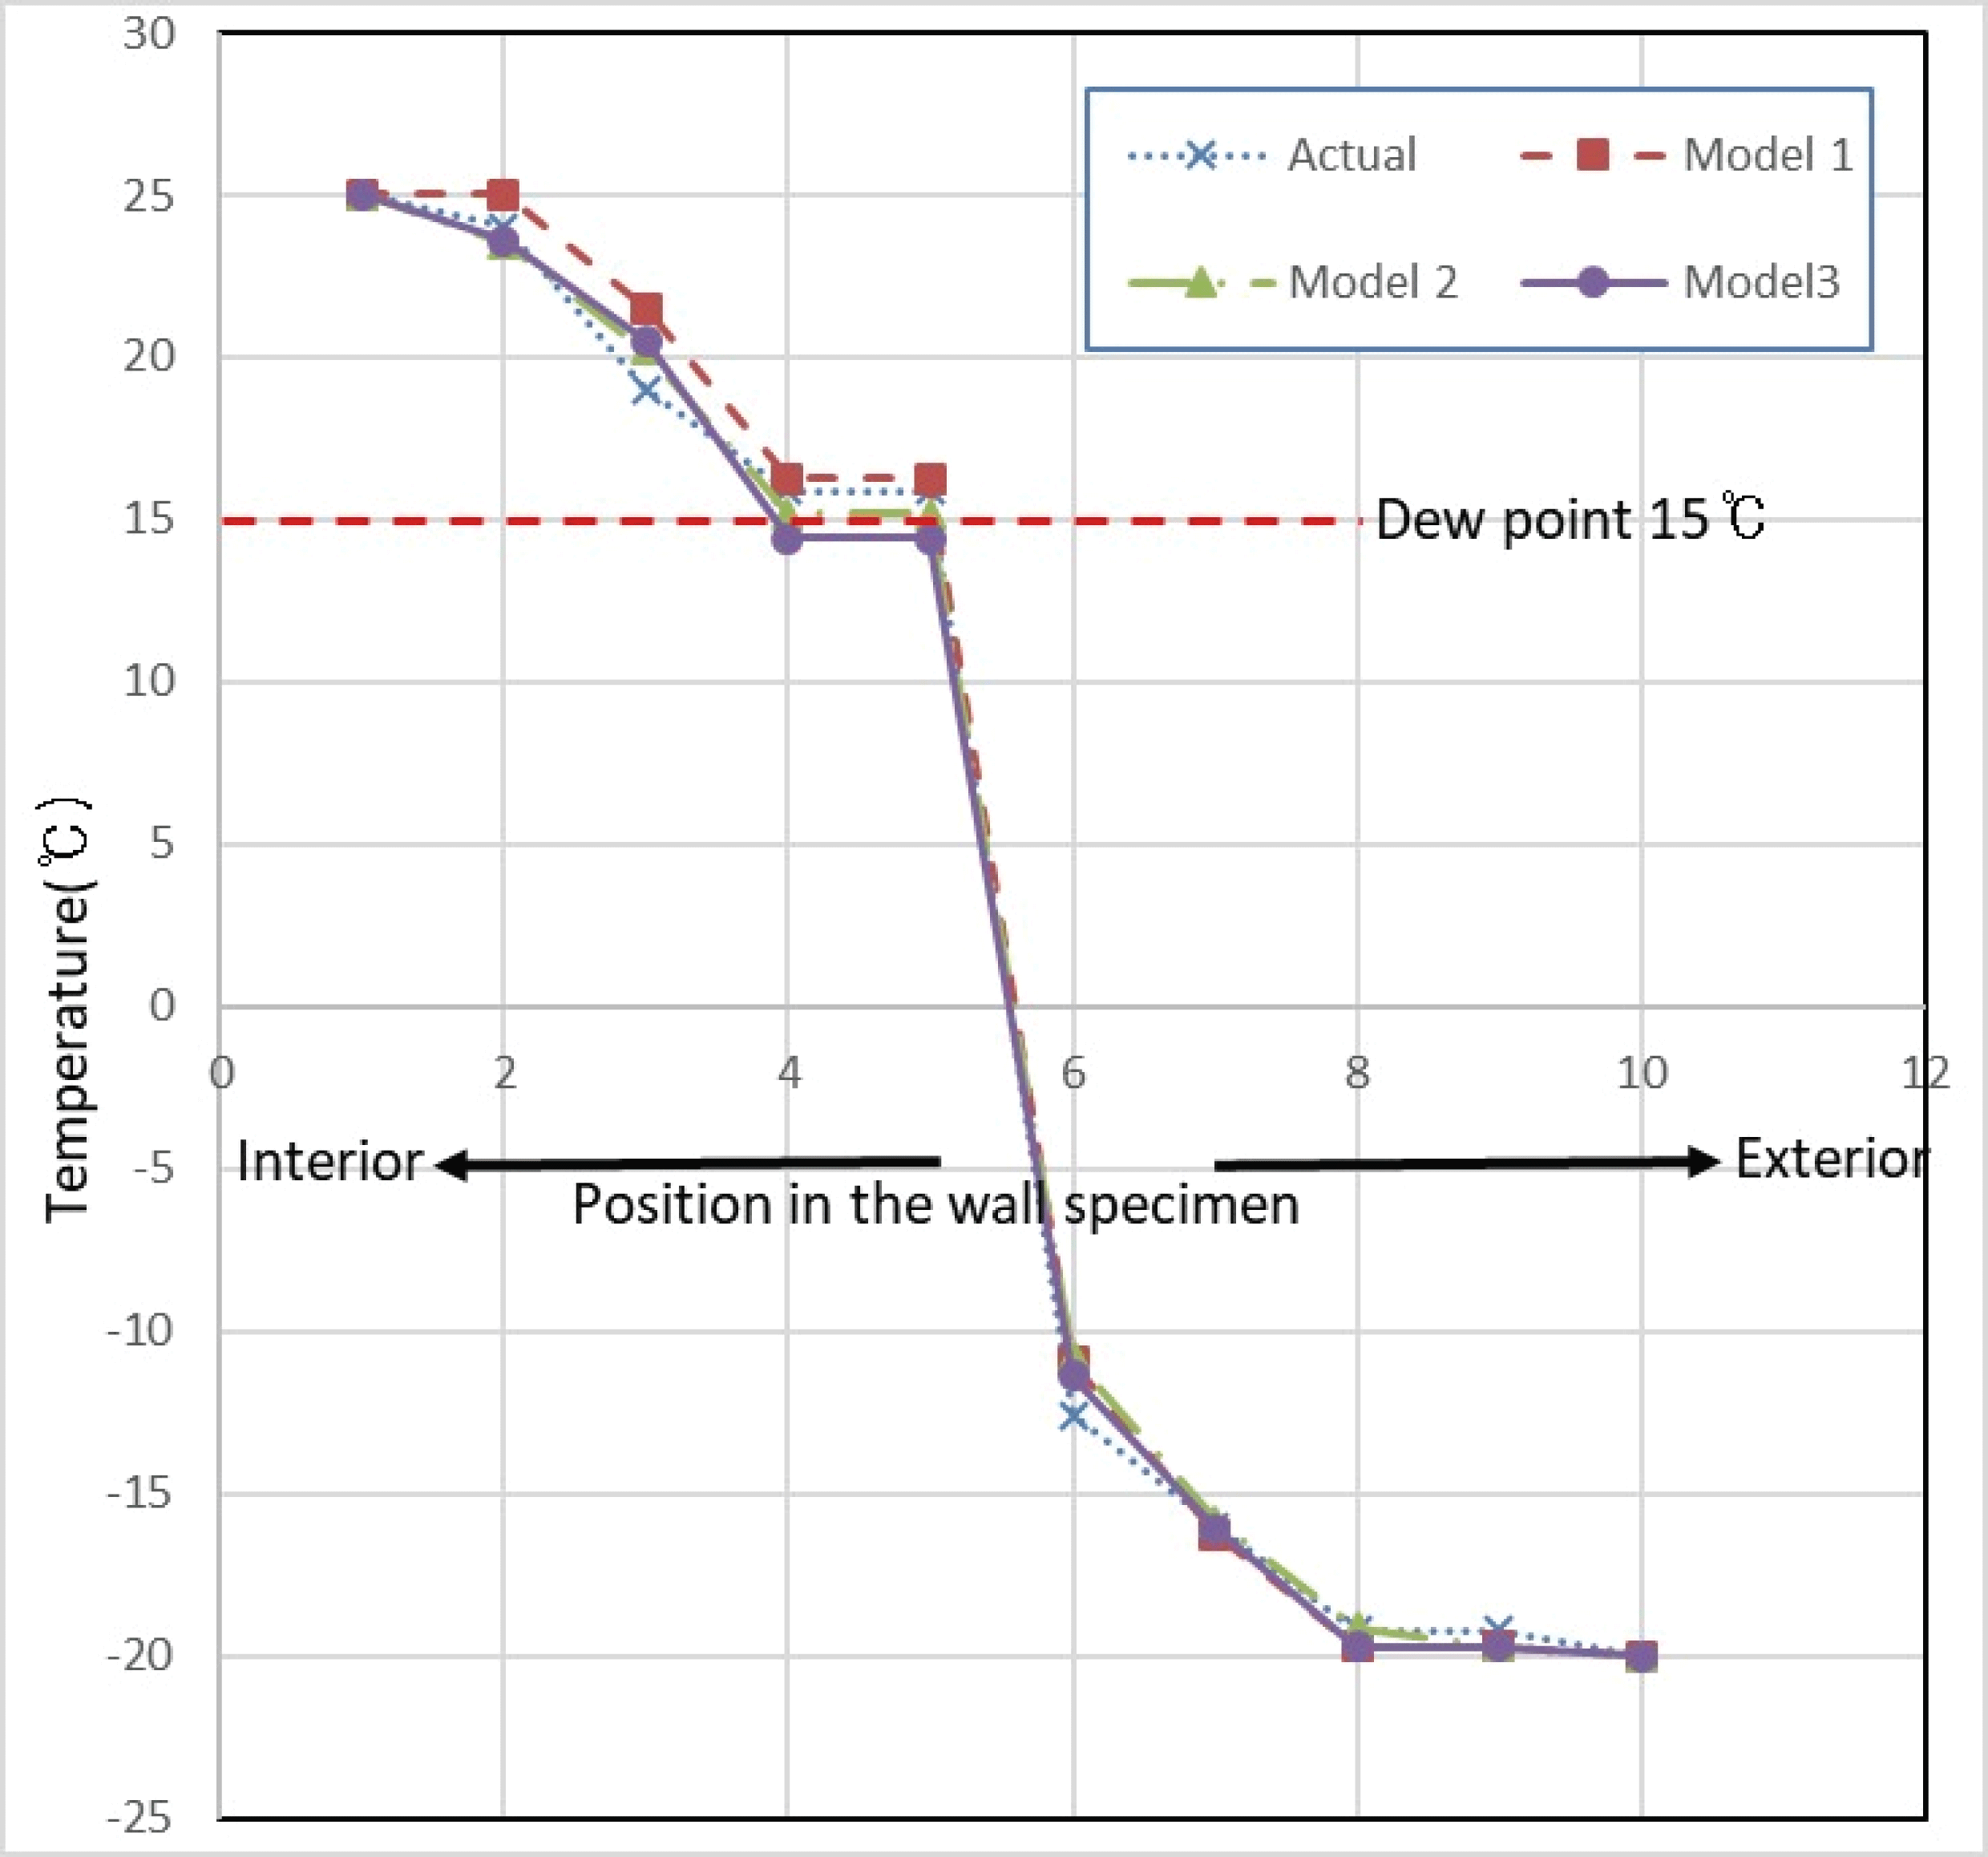
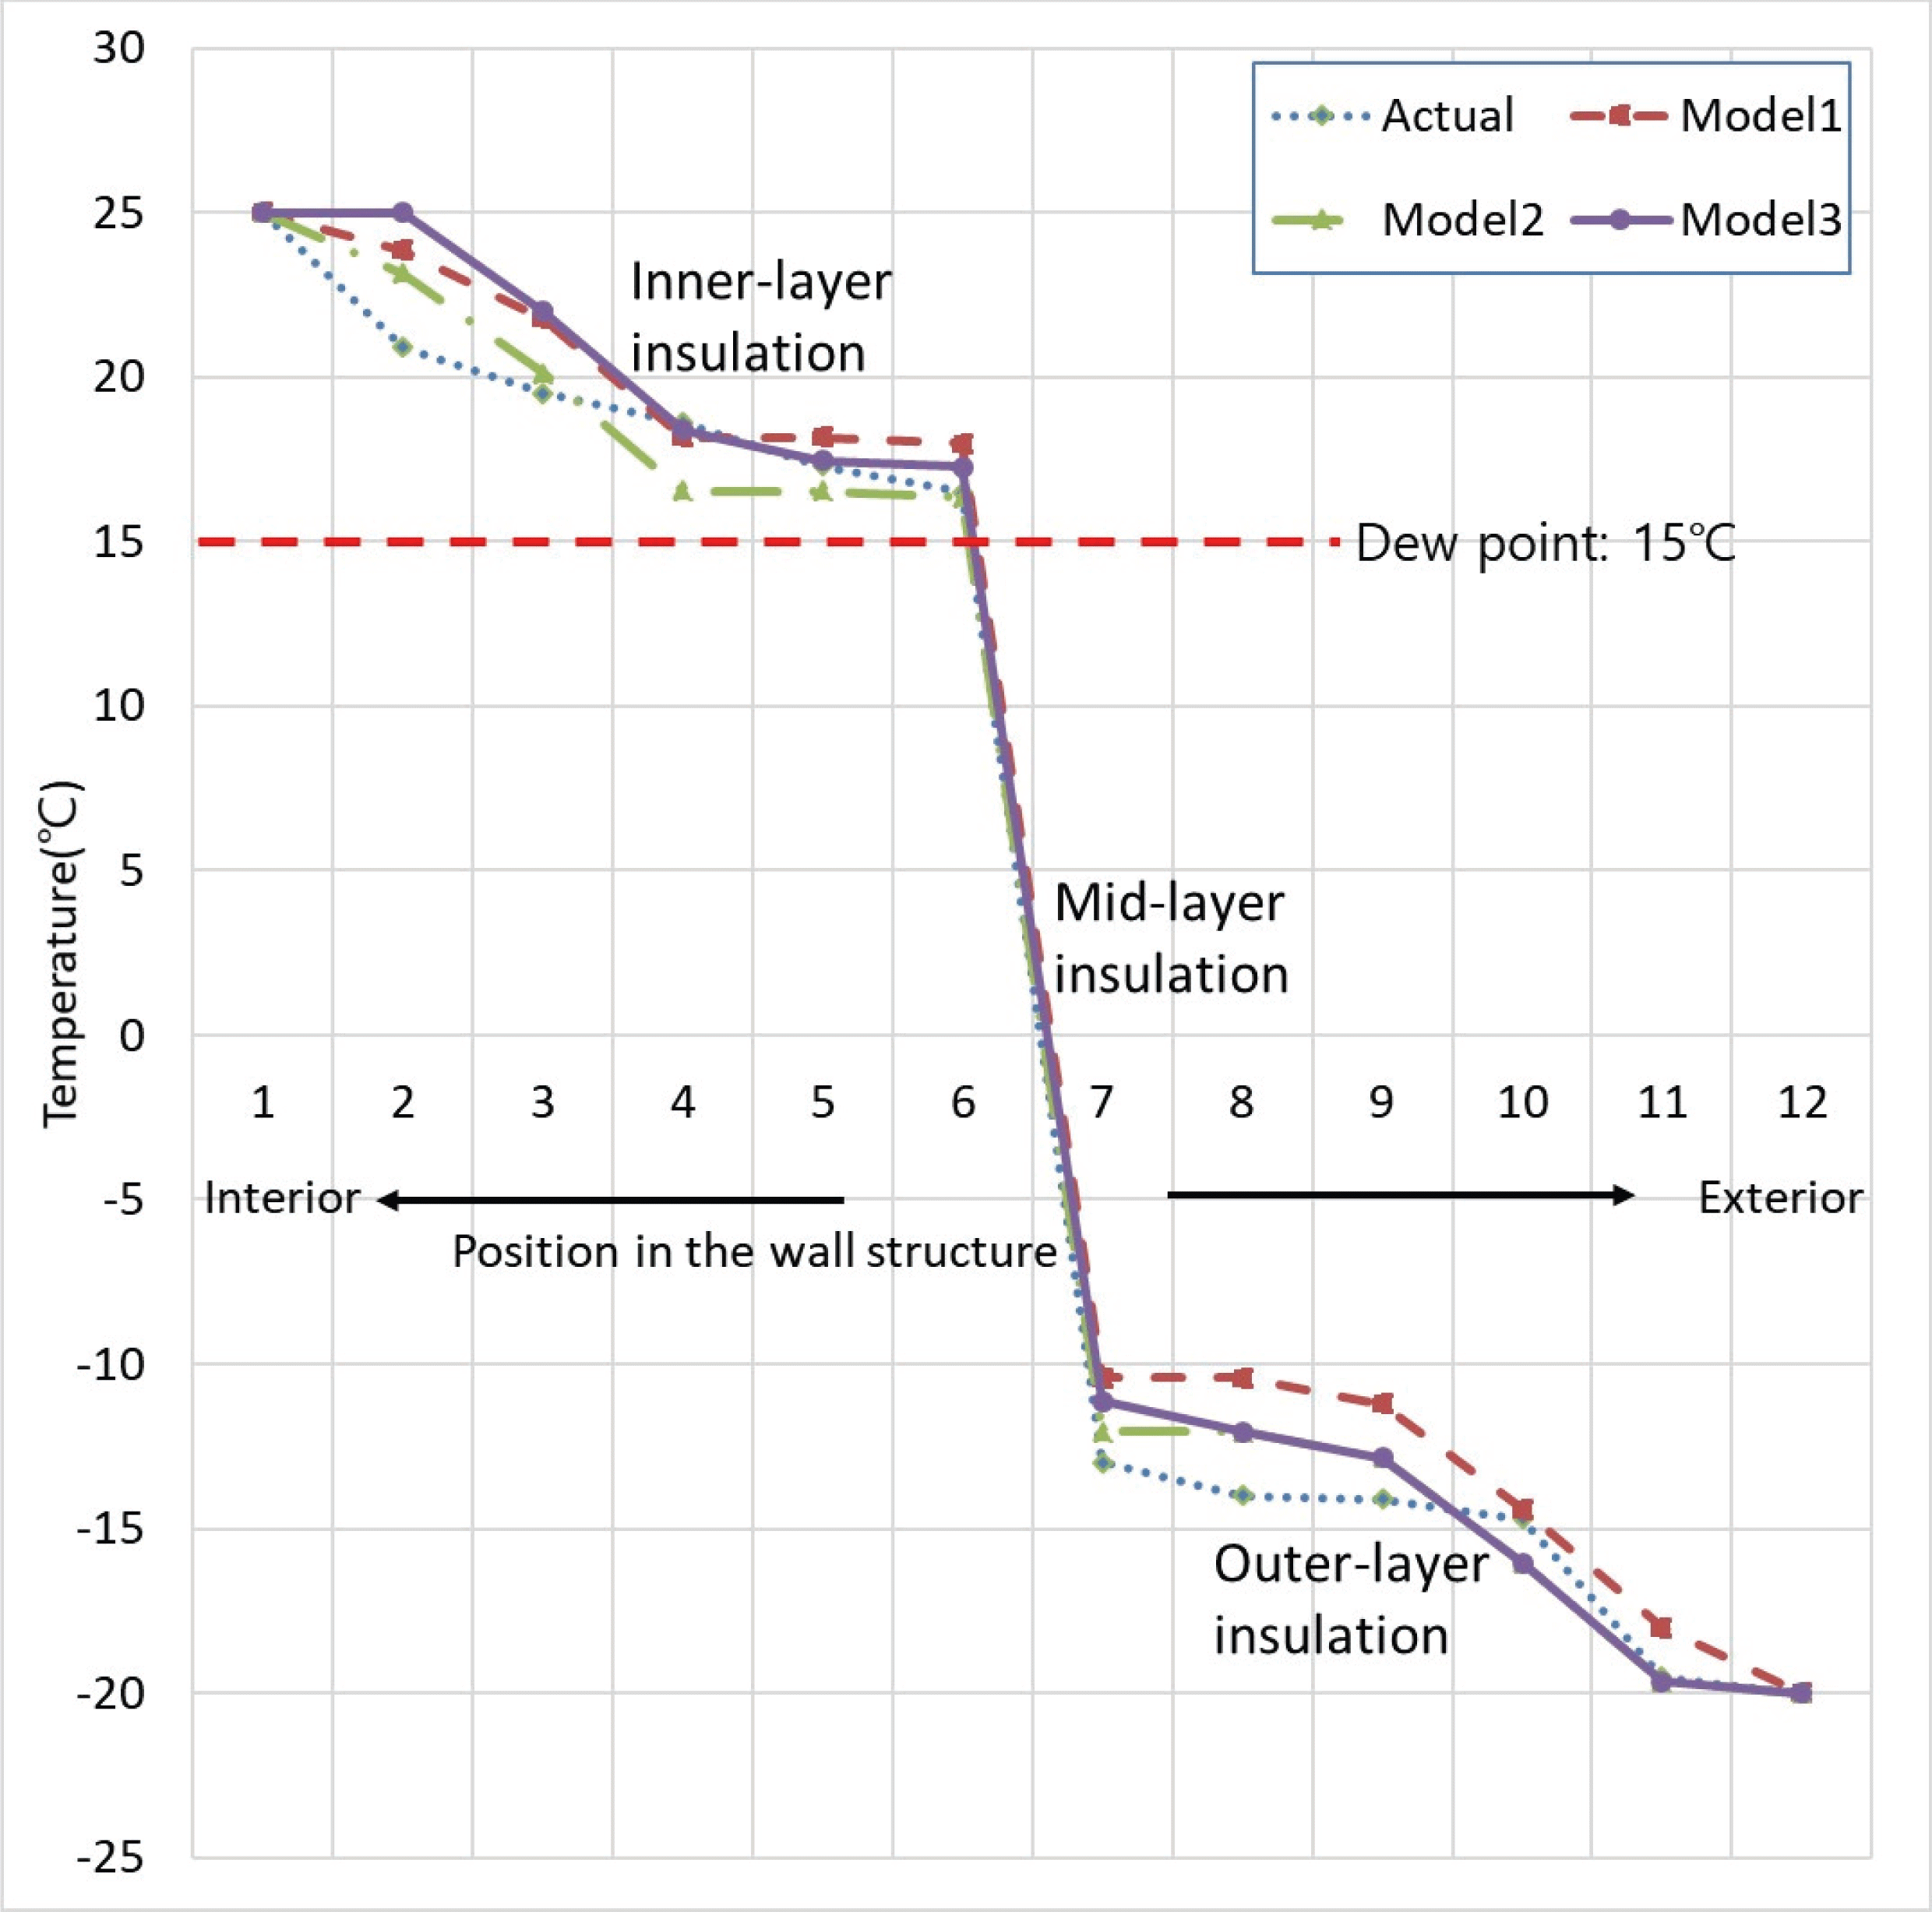
Fig. 3 shows the temperature change through wall thickness when the interior and exterior sides were exposed to warm interior (25°C) and cold exterior (-20°C) condition, respectively, for Type I wall specimen. Temperature changes estimated by Model 1, Model 2 and Model 3 were also shown together with the actual measured temperature in Fig. 3. If the temperature and RH of the interior air be assumed to be 25°C and 50% that may be common interior condition in winter, the approximate dew point calculated by the general well-known equation based the current temperature and relative humidity is 15°C which is located in the interior side of the wall structure, which means lower temperature than the dew point in the mid-layer insulation and may cause condensation and water accumulation inside of the wall structure.
The results of the actual tests and theoretical estimation by using three models for Type II wall specimen are given in Table 5.
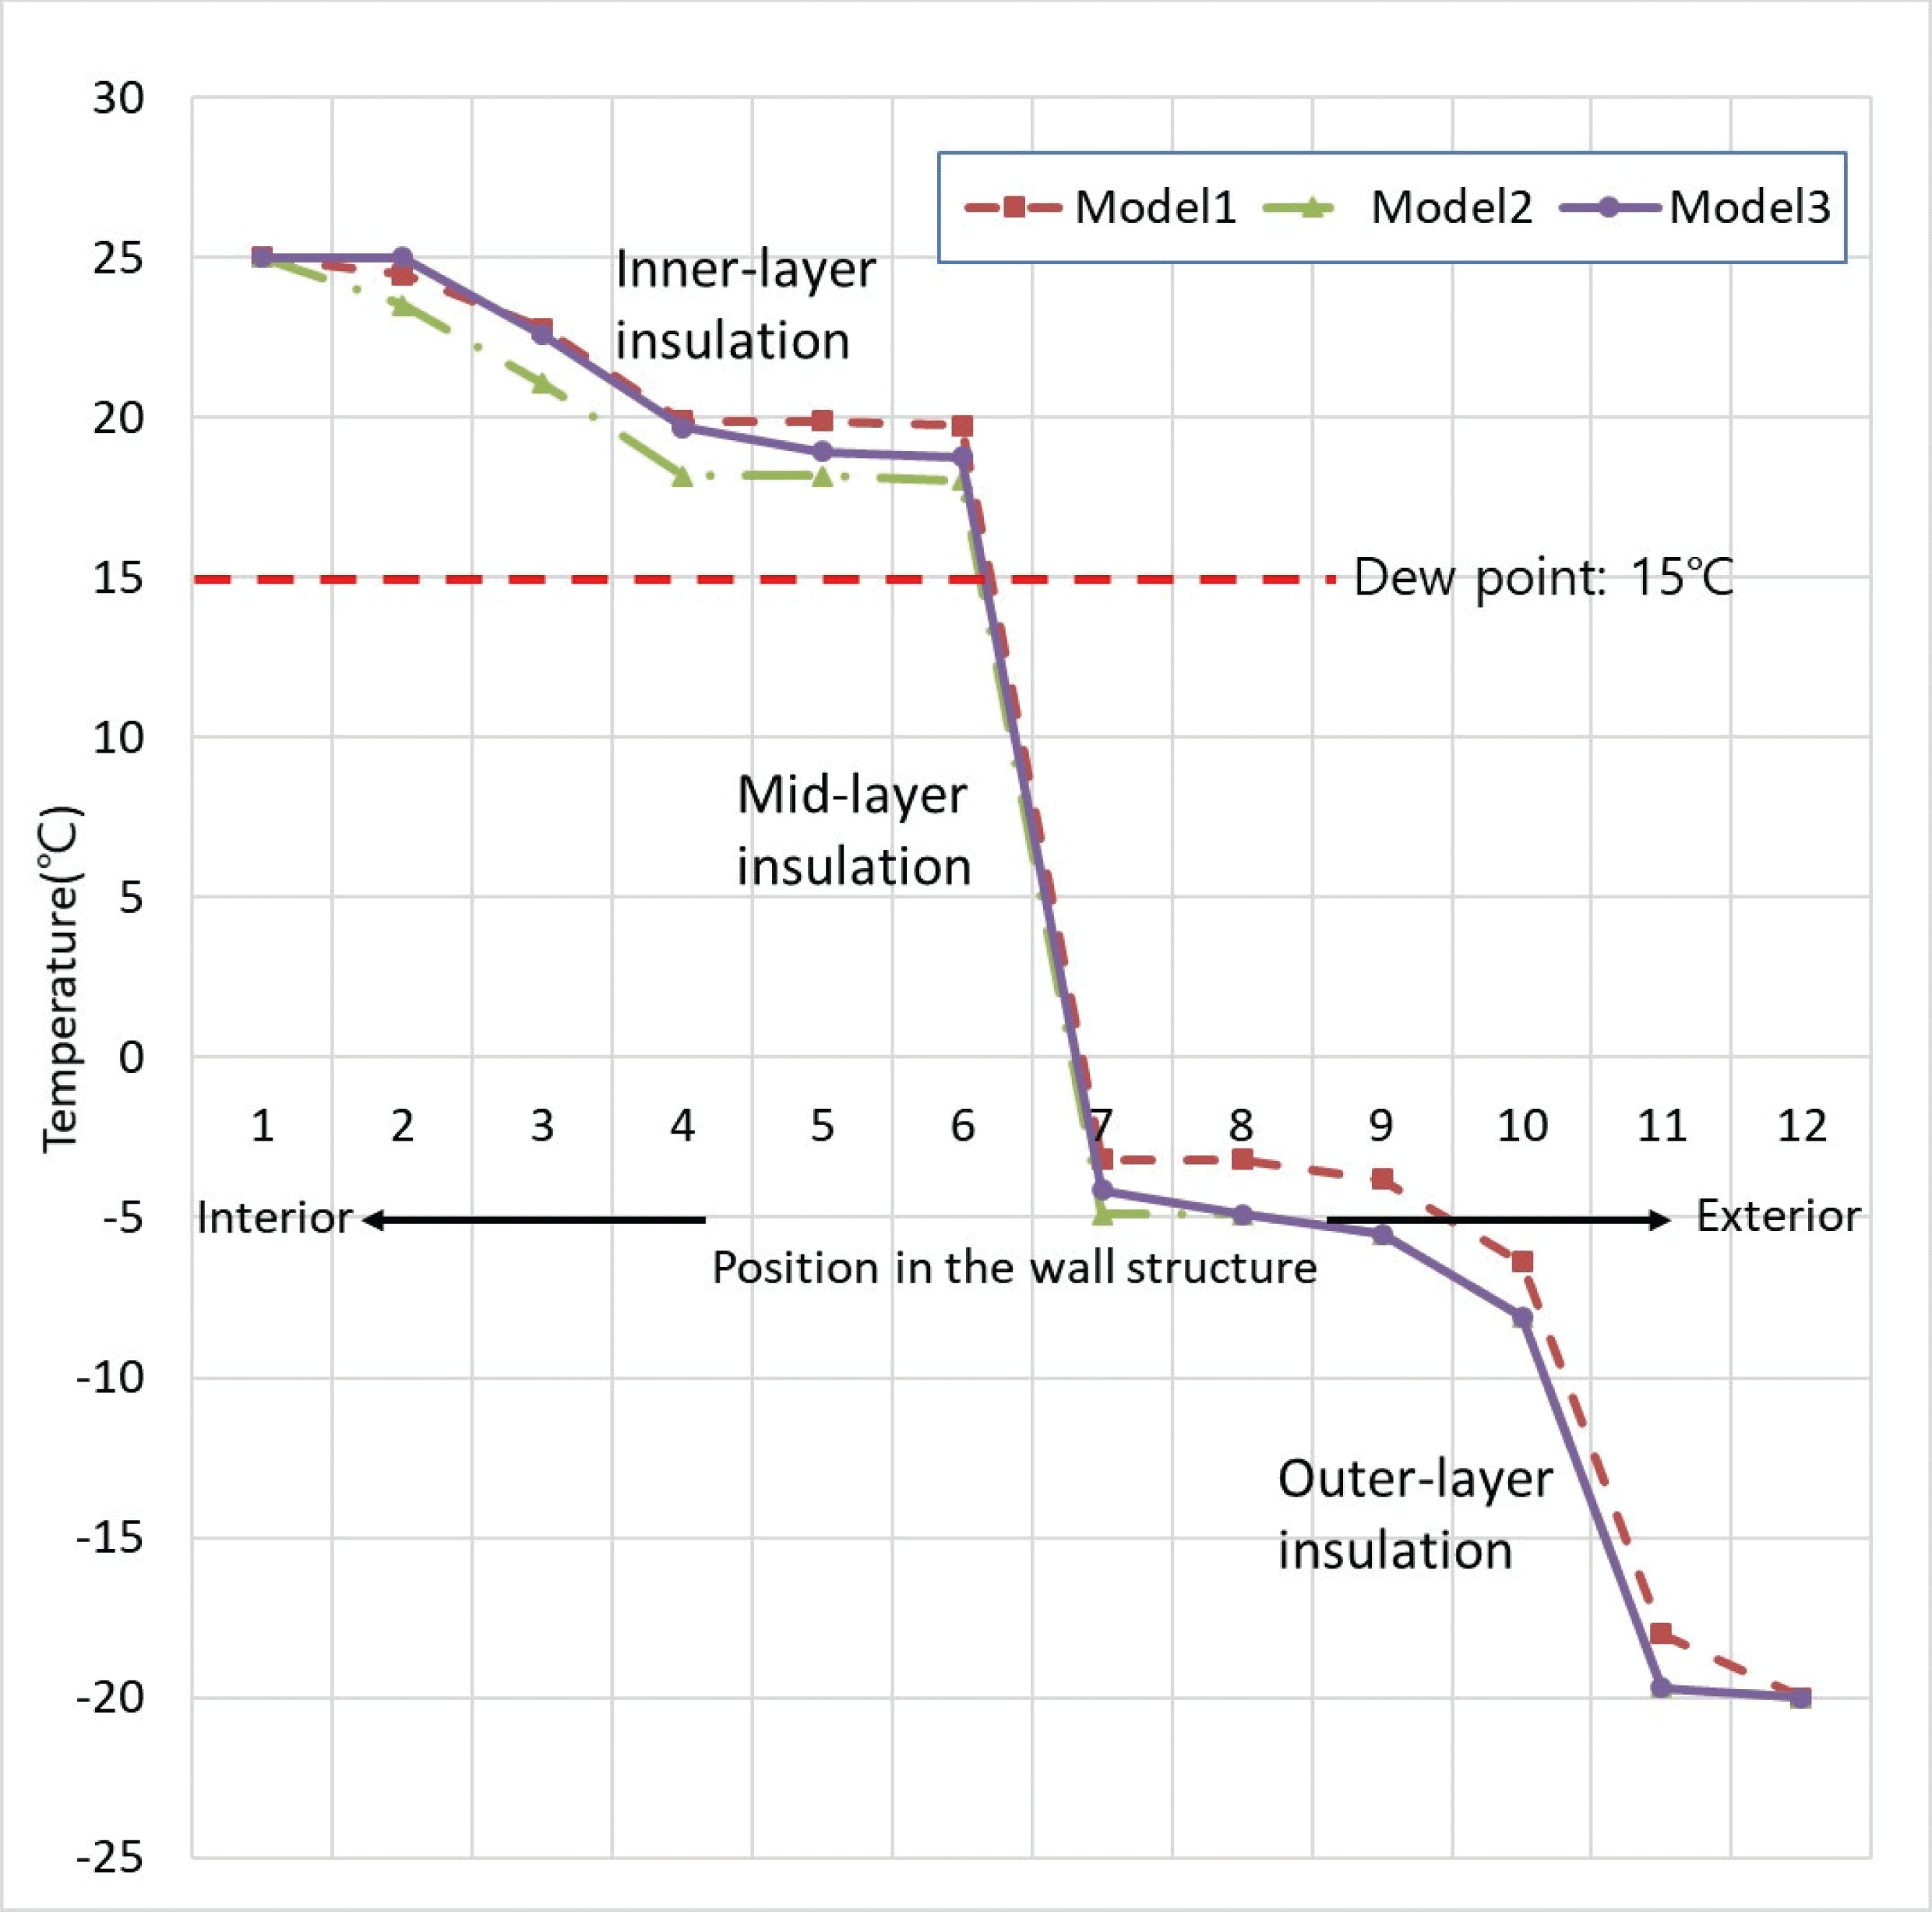
Fig. 4 shows the temperature change through wall thickness when the interior and exterior sides of the second wall specimen were exposed to warm interior (25°C) and cold exterior (-20°C) condition, respectively. Temperature changes estimated by Model 1, Model 2 and Model 3 were also shown together with the actual measured temperature in Fig. 4. As shown in Fig. 4, the dew point may be located in the inner-layer insulation that is made of Styrofoam in which moist air penetration and water accumulation are not possible. However, if warm and moist air penetrates into the mid-layer insulation that is made of fiberglass, condensation and water accumulation may be developed in that layer because the temperature in that layer is maintained under the dew point during winter.
The results of the actual tests and theoretical estimation by using three models for Type III wall specimen are given in Table 6.
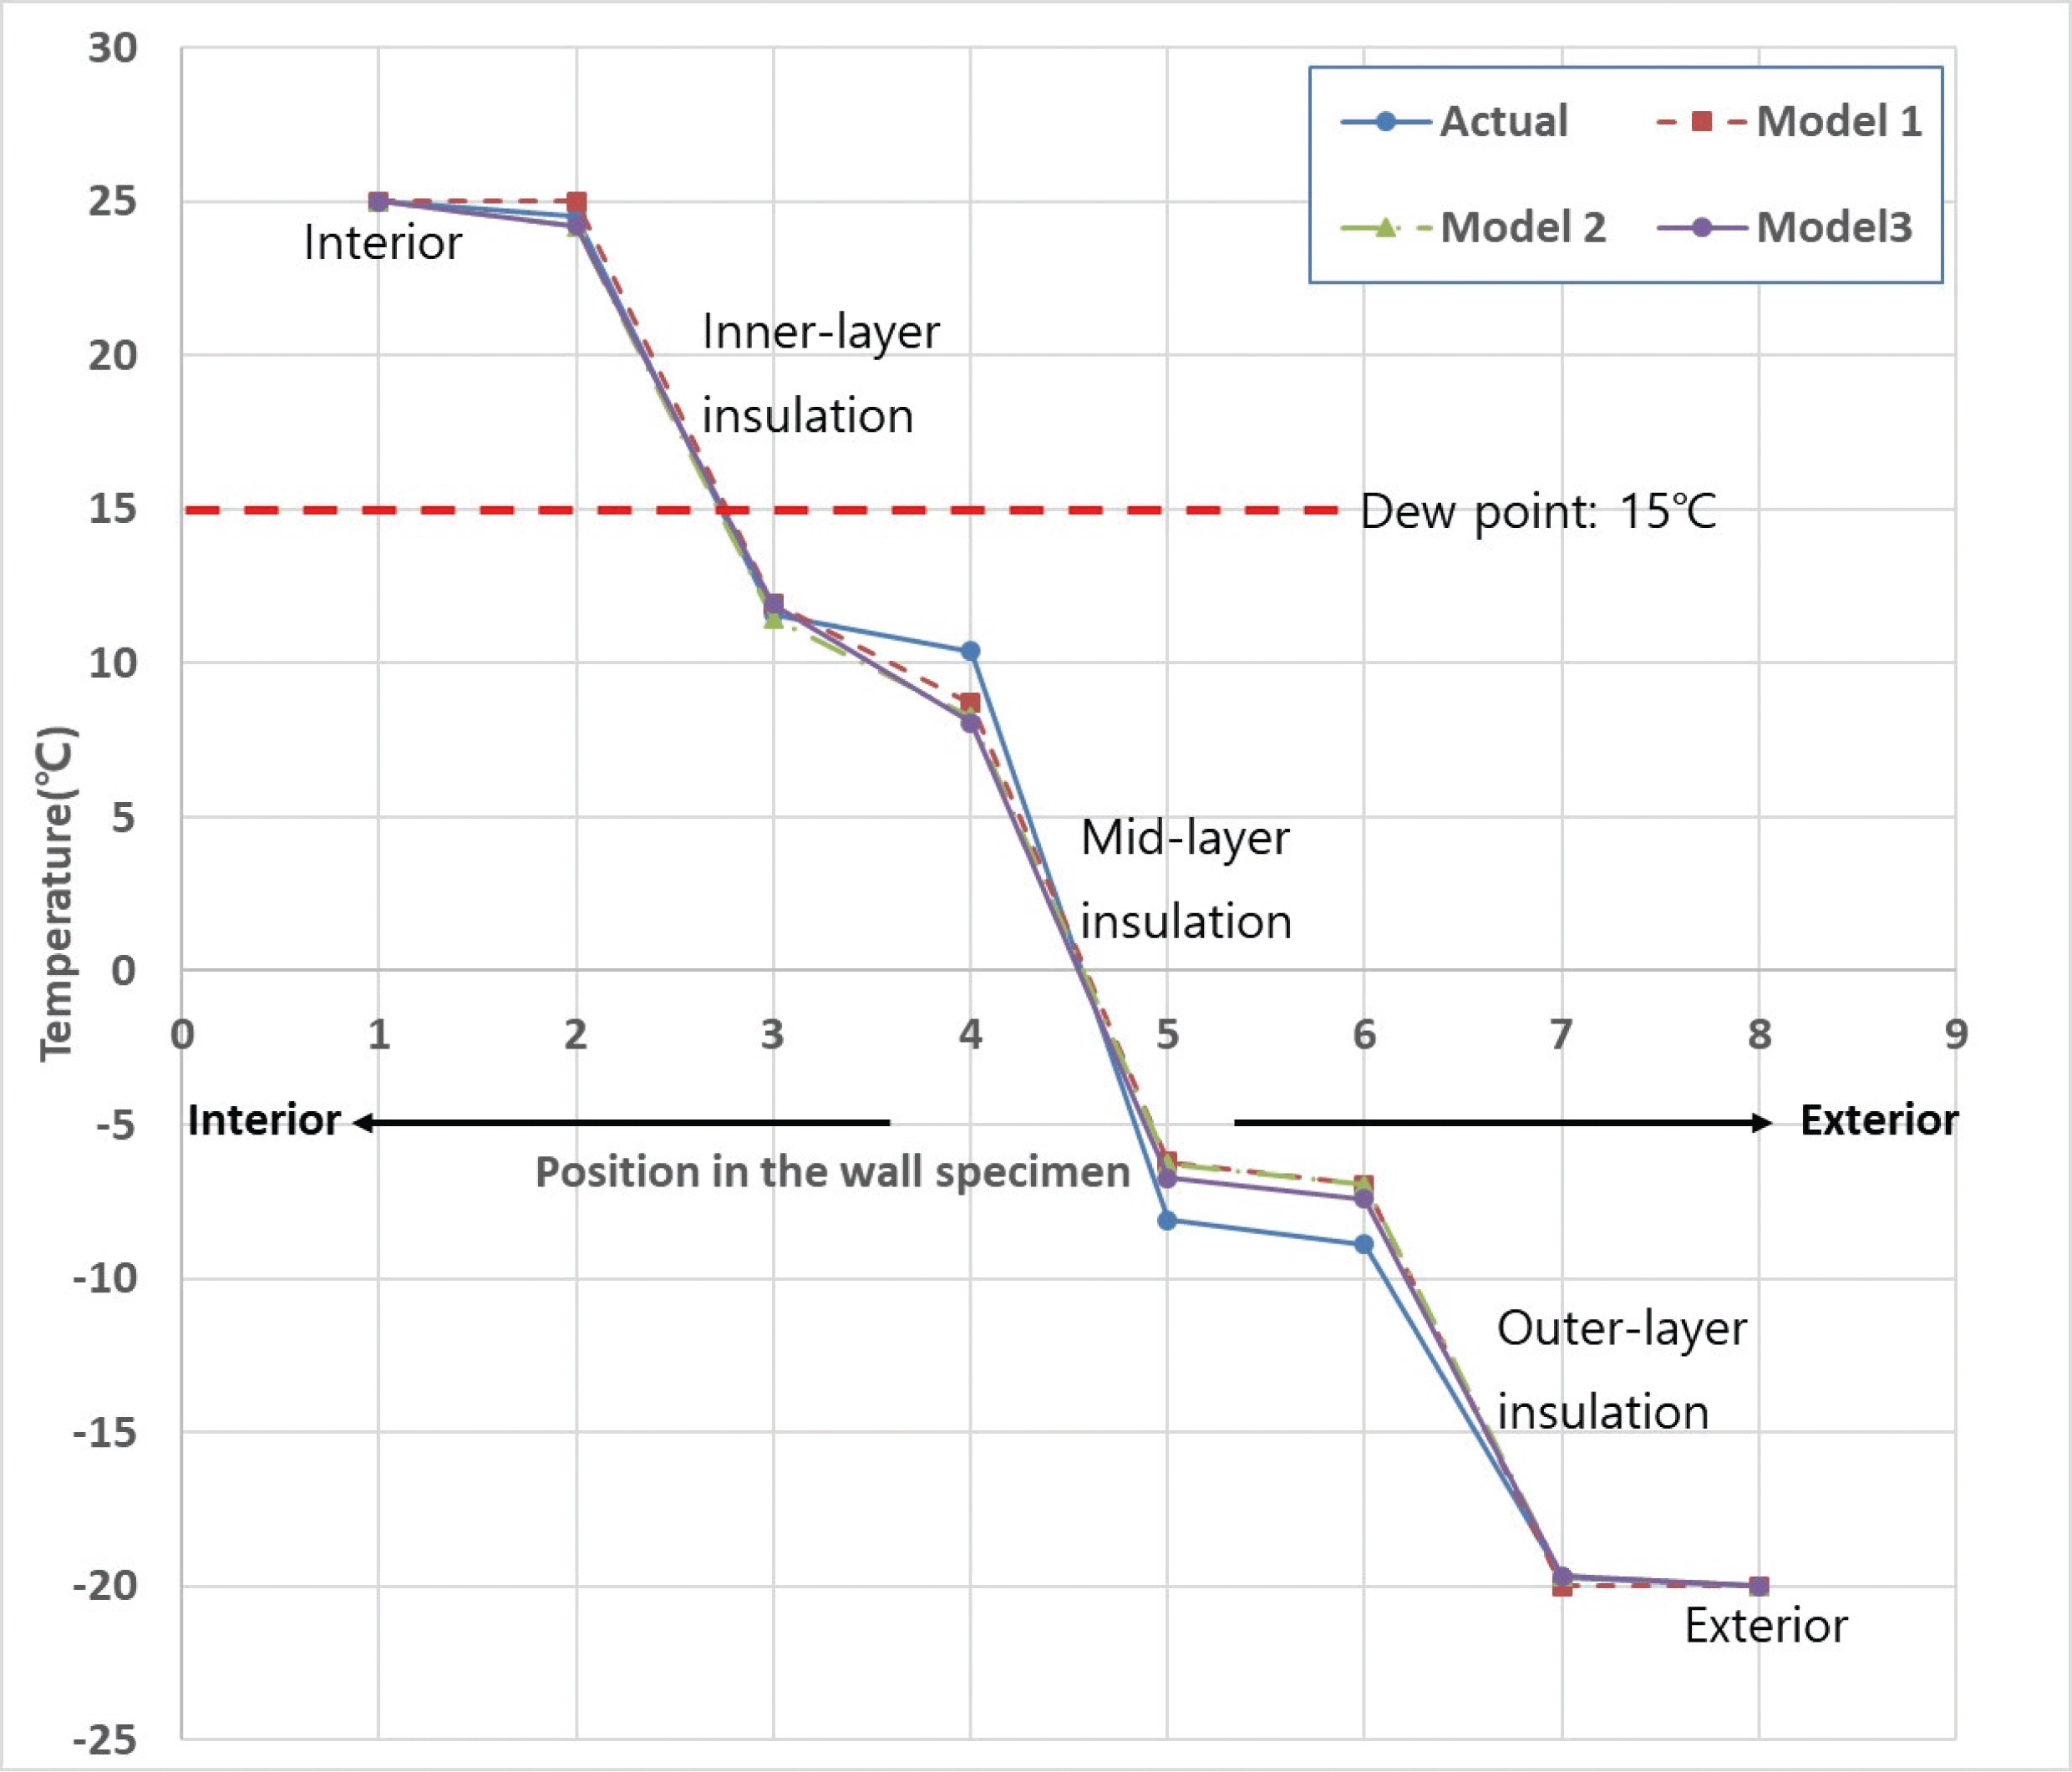
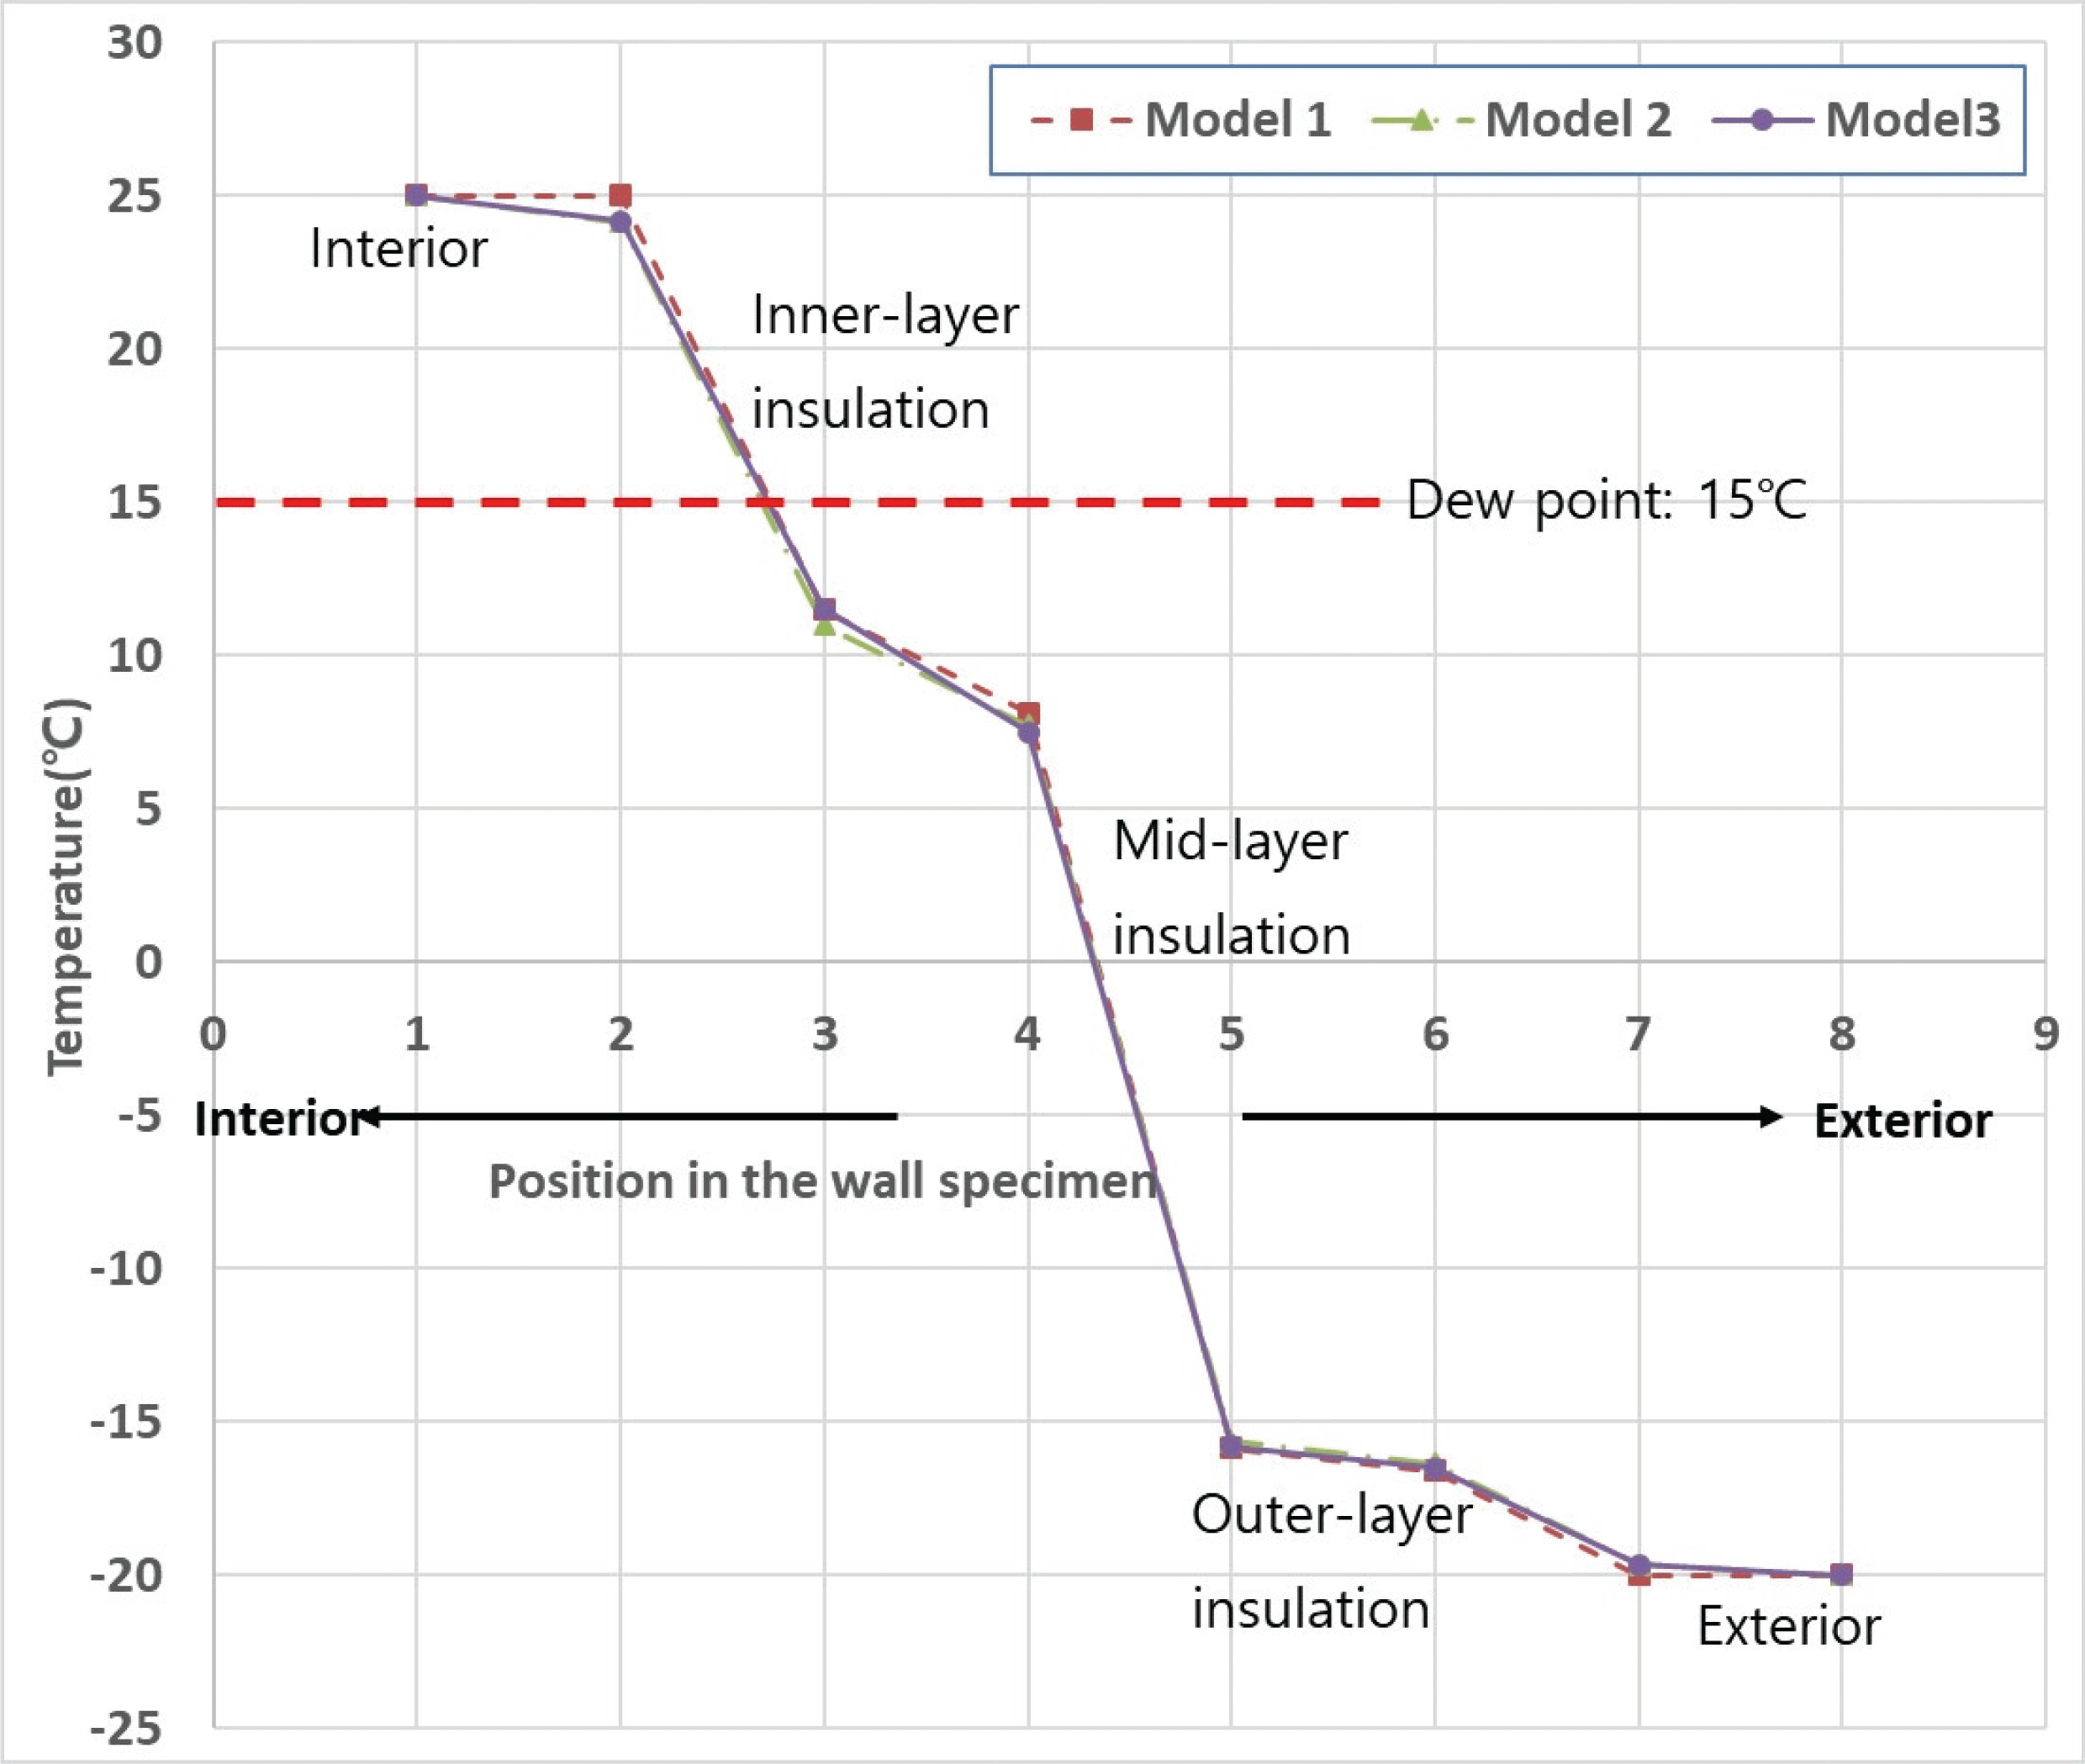
Fig. 5 shows the temperature change through wall thickness when the interior and exterior sides of Type III wall specimen were exposed to warm interior (25°C) and cold exterior (-20°C) condition, respectively. Temperature changes estimated by Model 1, Model 2 and Model 3 were also shown together with the actual measured temperature in Fig. 5. As shown in Fig. 5, the dew point may be located in the inner side of the mid-layer insulation that is made of fiberglass in which warm moist air can penetrate and develop condensation causing water accumulation in the wall structure.
To verify the effect of increasing the thicknesses of inner-layer or outer-layer insulation on the overall temperature change through the thickness of wall structure, the three theoretical models constructed for the third wall specimen was used. First, to check the effect of increasing the thickness of the outer-layer insulation, the thickness of the outer-layer insulation was increased to 100 mm in the models and their estimations are given in Fig. 6. As shown in Fig. 6, it has an effect of causing overall increase of the temperature inside of wall structure and moving the location of the dew point into the inside of the mid-layer insulation. However, the dew point may be still located in the mid-layer insulation in which warm moist air may penetrate. Therefore, it can be said that it cannot prevent condensation and water accumulation in the wall structure by simply increasing the thickness of the outer-layer insulation without preventing warm and moist air penetrating into the wall structure.
The same theoretical models were used to verify the effect of increasing the thickness of the inner-layer insulation on the overall temperature change through thickness of wall structure. In the three models, the thickness of the inner-layer insulation was increased to 100 mm and their estimations are given in Fig. 7. As shown in Fig. 7, it has an effect of decreasing the overall temperature inside of the structure and moving the location of the dew point into the inside of the inner-layer insulation. By moving the location of dew point, the temperature of whole area of the mid-layer insulation may be maintained under dew point, which may cause condensation and water accumulation when warm moist air penetrates into wall structure. Therefore, increasing the thickness of inner-layer insulation may cause the increased area of possible condensation in the mid-layer insulation.
4. CONCLUSION
All three models used in this study were relatively exact in estimating the temperature change through the wall thickness when comparing with the actual temperature measurements. All three models produced similar results to each other, which are matching well with the experimental results. Therefore, these models can be used to estimate the thermal effectiveness of wall structures of various composition and the possible location of condensation in wall structure. From the analysis of theoretical models, it can conclude that it is very difficult to prevent condensation in wall structure without preventing warm moist air penetration into wall structure. All the combination of inner-, mid- and outer-layer insulation applied in this study may cause the temperature in the mid-layer of insulation being maintained under dew point, which means that condensation and water accumulation may be possible if warm moist air penetrate into the wall structure. To prevent condensation inside of the wall structure, it is important to prevent warm moist air from meeting with the temperature under dew point in the wall structure. Because dew point is always located inside of the wall structure as shown in this study, it is recommended to prevent condensation in the wall structure that air tightness of the structure be increased or rigid foam insulation be used for the whole structure so that warm moist air cannot penetrate into the wall structure.