1. INTRODUCTION
Urea–formaldehyde (UF) resins as adhesives are most widely used for the manufacture of wood-based composite panels and particularly for plywood, particleboard, and medium-density fiberboard. Therefore, UF resins are considered as one of the most important wood adhesives and are mainly used for the production of wood-based composite panels. UF resin adhesives have several advantages such as fast cure, good performance on the panel, water solubility and low cost. The disadvantage of using UF resin adhesives is that the panels have FE and low water resistance. Due to its low water resistance, the use of wood-based panels combined with UF resins is limited for interior applications (Myer, 1979; Dunky, 1998; Park et al., 2006).
UF resin adhesives are polymeric condensation products of formaldehyde with urea. The synthesis of a UF resin is usually performed by a two-step procedure, that is, an alkaline hydroxymethylation followed by an acid condensation. Hydroxymethylation means the production of so-called hydroxymethylated ureas by adding up to three molecules of bifunctional formaldehyde to one urea molecule, which are cross-linked by methylene bridges after the condensation (Park and Lee, 2015). The reversibility of these reactions is one of the most important features of UF resin and is responsible for both low resistance to hydrolysis due to water or moisture attack and subsequent formaldehyde emission. This is because weakly bonded formaldehyde is hydrolyzed to cause formaldehyde emission (Dunky, 1998). It is also known that the hydrolysis of UF resin in free formaldehyde and water conditions present in the UF resin is responsible for the FE of the wood-based panel (Myers, 1983). That is, after synthesis of UF resin, unreacted formaldehyde can be released from the wood panel even after hot pressing at high temperature (Park and Kim, 2008). In addition, the formation of hydroxymethyl groups mostly depends on the formaldehyde to urea (F/U) mole ratio, with higher mole ratios increasing the tendency to form highly hydroxymethylated species (de Jong and de Jonge, 1952; de Jong et al., 1953). Among them, hydrolysis of weakly bound formaldehyde from hydroxymethyl groups, increase the content of emittable formaldehyde.
The FE problem has been one of the most important issues in UF resin in more than three decades (Myers, 1984; Meyer, 1986; Myers and Koutsky, 1987; Hse et al., 1994; Gu et al., 1995; Park et al., 2016). Much attention has been paid to reducing or controlling FEs from UF resin-bonded panels through resin technology. Reduction of the amount of formaldehyde in UF resin is one of the most effective ways to reduce formaldehyde emissions. Therefore, it has been gradually lowered over two decades by reducing F/U mole ratio. The formaldehyde emission decreased as the mole ratio decreased, but unfortunately, other physical and mechanical properties were influenced negatively at the same time (Roffael, 1975; Sundin and Hanetho, 1978; Meyer et al., 1980; Dunky, 1998; Park et al., 2006). In spite of these disadvantages, much lower F/U mole ratios (below 1.0) have started to be used for the synthesis of UF resins in recent years. However, there are limited studies on the performance of these UF resins with low mole ratio of below 1.0 that were manipulated by splitting the addition of urea into the second or third urea. Thus, this study investigated effects of the number of urea addition and mole ratio to the performance of low mole ratio UF resins by characterizing molecular weights, cure kinetics, and adhesion strength.
2. MATERIALS and METHODS
Materials used for the synthesis of UF resin adhesives in this work were technical grade of urea granules (99%) and formalin (37%). Aqueous solutions of formic acid (20 wt%) and sodium hydroxide (20 wt%) were used to adjust the pH during the resin synthesis. Aqueous solution (20 wt%) of NH4Cl were used as a hardener. High purity (≥ 99.9%) high performance liquid chromatography (HPLC) grade of both N,N-dimethyl formamide (DMF) and dimethylsulfoxide (DMSO) were purchased from Sigma-Aldrich without further treatment.
UF resins with 0.7 and 1.0 F/U mole ratio were synthesized by a conventional alkaline-acid two-step reaction with the second or third urea additions in the laboratory. Formalin was placed in a reactor equipped with a mantle heater and stirrer. A proper amount of the first urea was added into the reactor under stirring and heated to 40 °C to obtain an initial F/U mole ratio of 2.0. The pH was adjusted to 7.8 to 8.0 by adding sodium hydroxide. The reactor was heated to 90 °C and maintained for 60 min for the addition reaction. The temperature was then cooled to 80 °C. And then, the pH was adjusted to 4.6 by adding formic acid for the condensation reaction. Subsequently, the temperature was maintained at 70 °C for viscosity measurement. The target viscosity was between the ‘J’ and ‘K’ scale, as measured by a bubble viscometer (VG-9100, Gardner-Holdt Viscometer, FL, USA). As soon as the target viscosity reached, a proper amount of the second urea was added to the reactor to obtain 0.7 or 1.0 F/U mole ratio for each resin. After the complete dissolution of the second urea added, the UF resin was cooled to room temperature, and the pH was adjusted to 8.0 to terminate the condensation reaction. For the third urea addition, the target viscosity of UF resin was adjusted between the ‘J’ and ‘K’ scale after the second urea addition. When the target viscosity reached, a proper amount of the third batch of urea was added to the reactor to obtain 0.7 and 1.0 F/U mole ratio for each resin. After the complete dissolution of third urea, the UF resins were cooled to room temperature, and the pH was adjusted to 8.0 to terminate the condensation reaction.
The viscosity of all resins was measured with a cone-plate viscometer (DV−II+, Brookfield, Middleboro, MA, USA), using spindle No. 2 at 25 °C and 60 rpm. The non-volatile solids content of each sample was calculated by weighing the resin mass before and after its drying in the oven for 3 h at 105 °C. The gelation time of all the resins was measured at 100 °C by adding 3 wt% of NH4Cl (20 wt%) based on the resin solids content using a gel time meter (DAVIS, Sunshine Instruments, USA).
A gel permeation chromatography (GPC) (YL9100, Younglin, Korea) system equipped with a refractive index (RI) detector was used to measure the MW of the resins. The columns used were KD 801, 802, and 806 M (SHODEX,). The GPC was performed at 50 °C of the column and detector temperatures and a flow rate of 0.5 mL/min. (Jeong and Park, 2017). The universal calibration of molecular weights between 106 and 25,200 Da was performed using polyethylene glycol (PEG) standards from Polymer Standards Service GmbH, Germany. An HPLC grade DMF was used as the mobile phase. UF resin samples were dissolved in a mixture of 10% DMSO and 90% DMF and kept in an oven at 50 °C for 3 h before the injection. The sample was then introduced via the injection loop of the GPC through a 0.45 mL filter. The number-average molecular weight (Mn), weight-average molecular weight (Mw), and polydispersity index (PDI) were calculated using the YL-Clarity chromatography software.
A differential scanning calorimeter (DSC) (Discovery 25, TA Instruments, New Castle, DE, USA) was used to characterize curing kinetics of UF resins. About 5 mg resins were mixed with 3% NH4Cl based on the resin solids content. The sample was sealed into a high-pressure pan and covered with a lid for analysis. All samples were scanned at four heating rates (2.5, 5, 10 and 20 °C/min) with a temperature range from 30 to 200 °C under a flow of 50 mL/min. of nitrogen gas. All thermograms of UF resins were analyzed using a software (TRIOS Software, v4.3.0, TA Instruments, New Castle, DE, USA) to obtain peak temperature under an exothermic curve.
Three-ply plywood was prepared using Radiata pine (Pinus radiate D. Don) veneers. UF resins were mixed with 3 % NH4Cl based on the non-volatile resin solids content. Approximately 10 % wheat flour was added to the resins based on their total mass. Then, the glue mix was applied to the veneer surface at a glue spread of 170 g/m2 using a rubber roller. The assembled plywood was cold-pressed under a pressure of 8 kgf/cm2 for 20 minutes and then was hot-pressed at 120 °C under the same pressure for 4 min. Properties of plywood were evaluated according to a standard procedure (KS F 3101, 2016). Nine specimens (25 × 80 × 6 mm) were used for tensile shear strength and then calculated using the peak load determined at a crosshead speed of 2 mm/min in a universal tester (H50KS, Hounsfield, Redhill, England). Ten specimens (150 × 50 mm) from three-ply plywood pieces were also used for the determination of formaldehyde emission using 24-hour desiccator method (KS M 1998-4, 2005).
3. RESULTS and DISCUSSION
The properties of UF resins prepared at different numbers of urea addition and F/U mole ratios are shown in Table 1. The non-volatile resin solids ranged from 59 % to 69 %. As expected, UF resins with 0.7 mole ratio showed greater solids content that those of 1.0 mole ratio. The resin viscosity increased with an increase in the F/U mole ratio and by the number of urea addition. The gelation time decreased with an increase in the number of urea addition, and F/U mole ratio, indicating a better resin reactivity for the third urea addition.
| F/U mole ratio | No. of urea addition | pH | Non-volatile solids content (wt %) | Viscosity (mPa·s) | Gelation time (s) |
|---|---|---|---|---|---|
| 0.7 | 2 | 8.1 | 69.6 | 142 | 615 |
| 3 | 8.2 | 67.2 | 216 | 422 | |
| 1.0 | 2 | 8.1 | 59.7 | 242 | 184 |
| 3 | 8.1 | 60.2 | 459 | 164 |
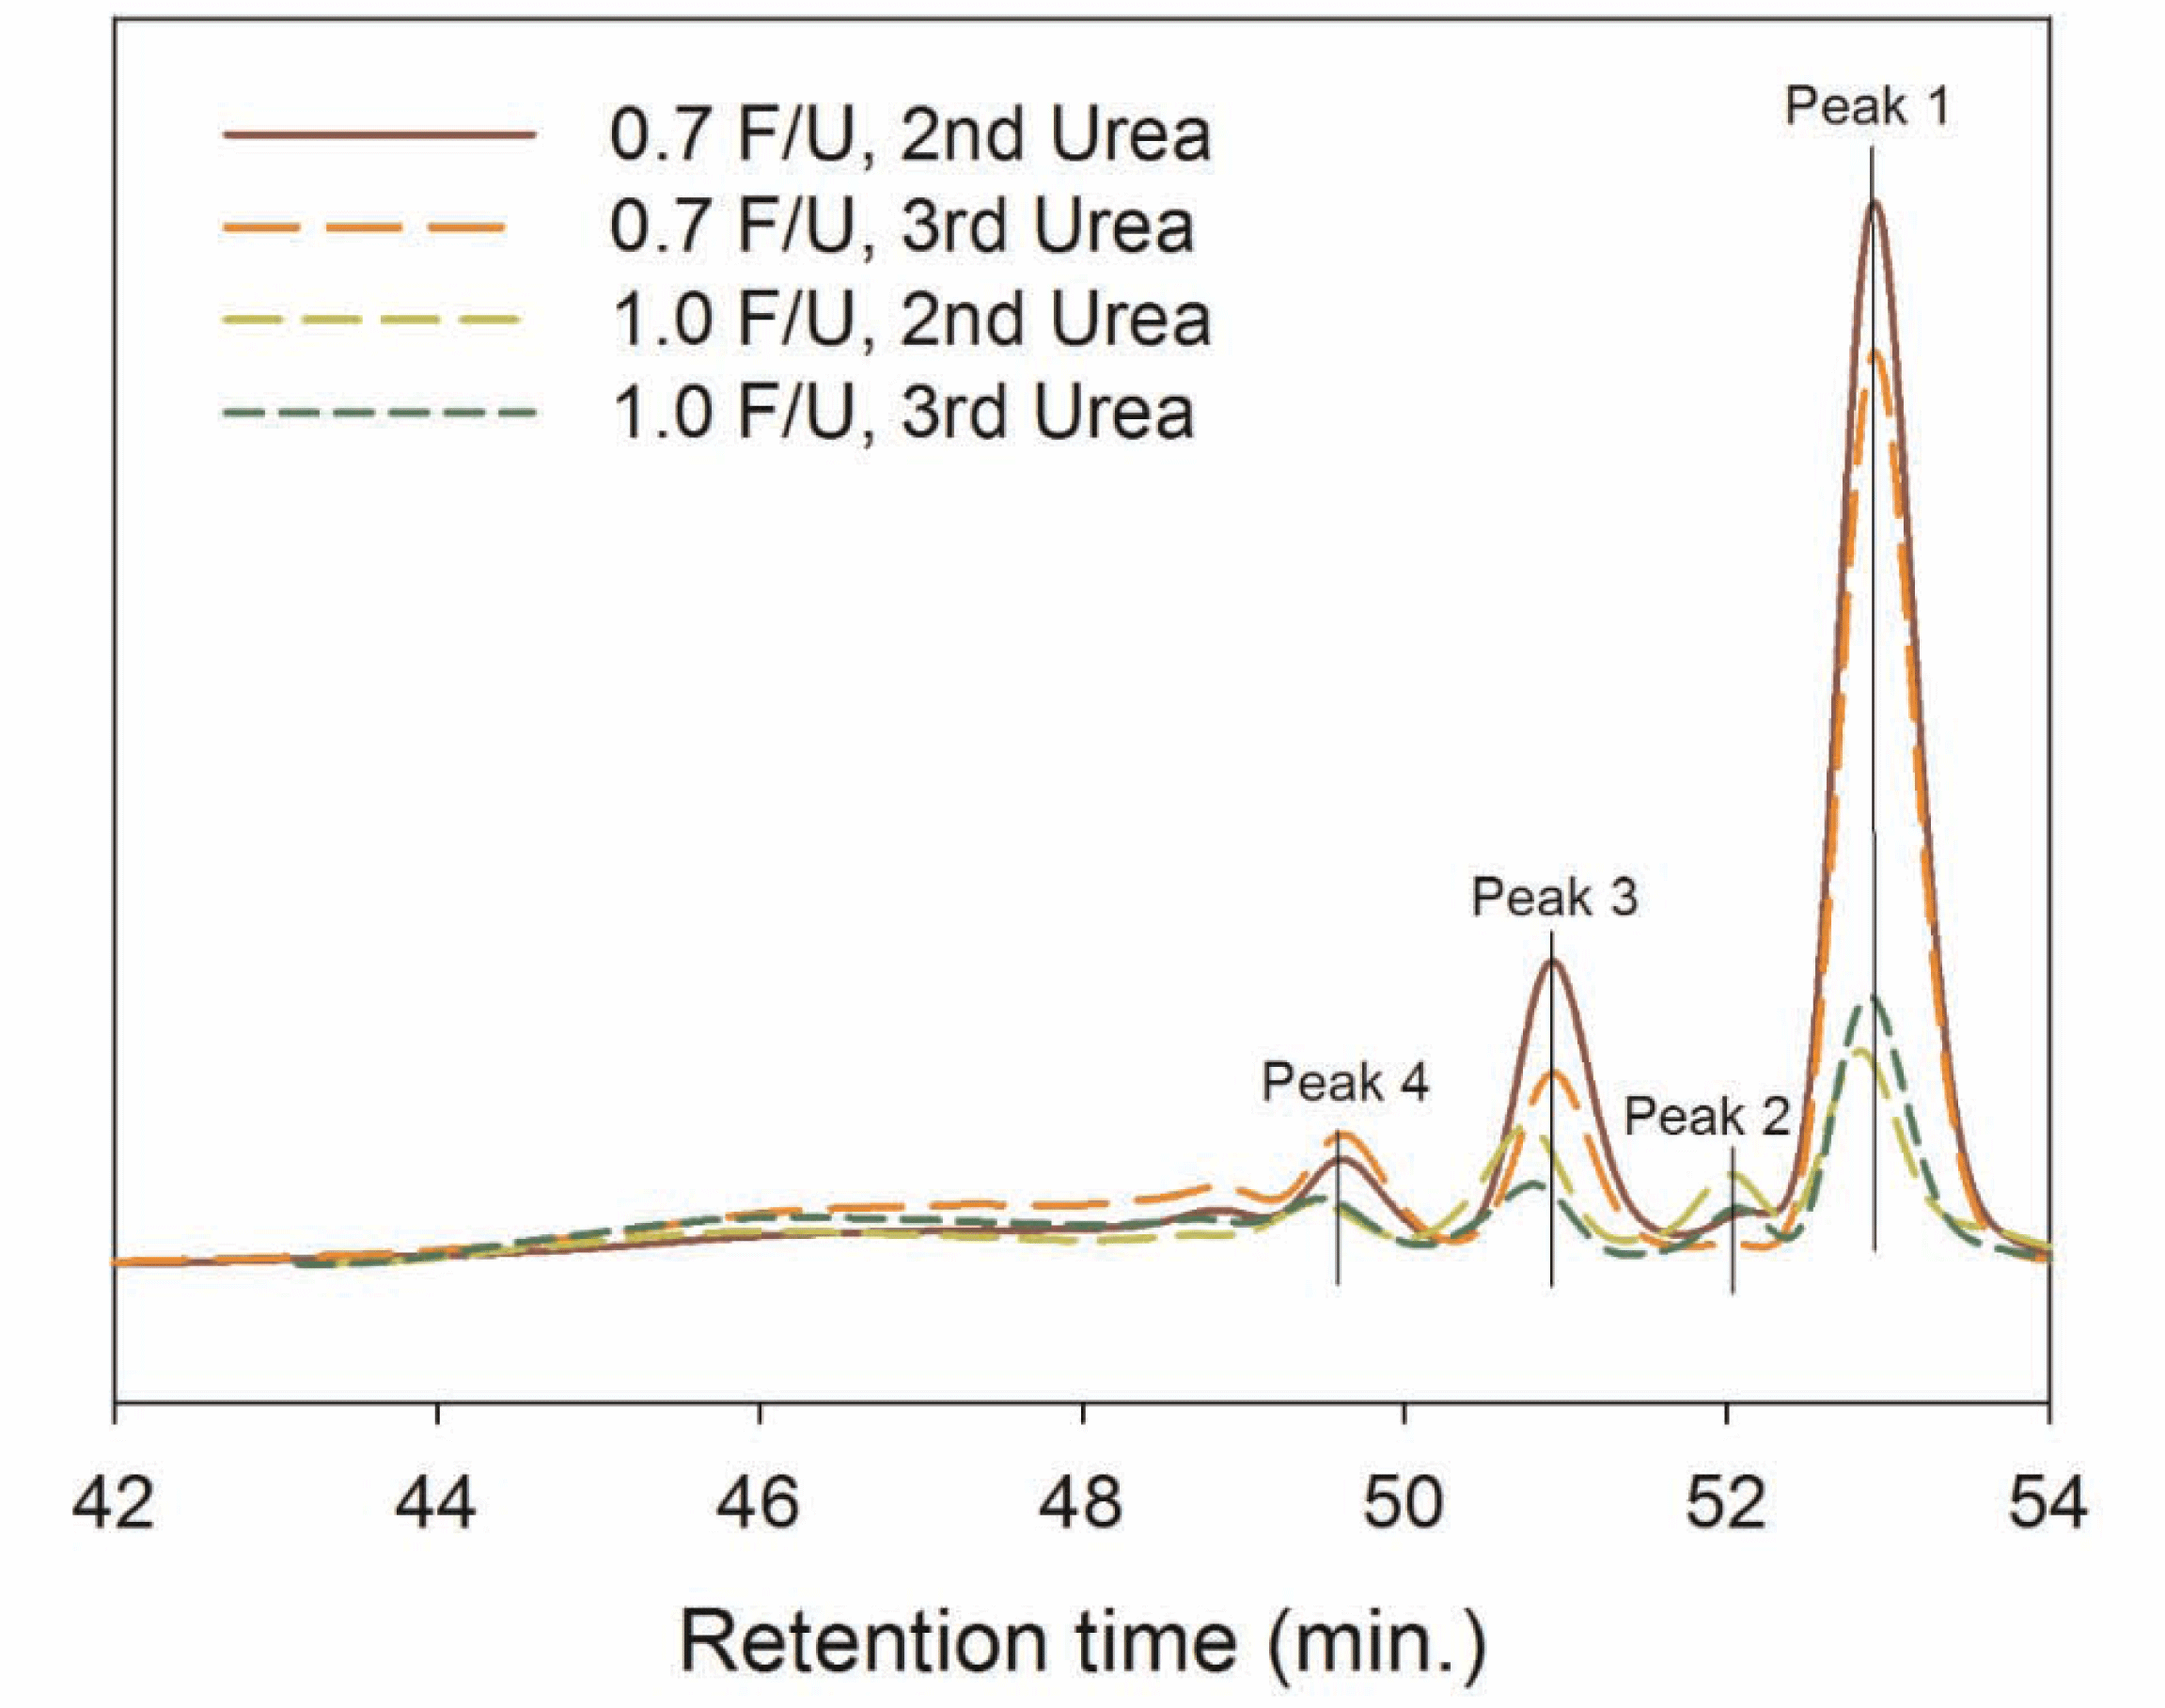
Fig. 1 shows GPC chromatograms of UF resins with different numbers of urea addition and F/U mole ratios. All UF resins showed four peaks from Peak 4, 3, 2 to 1 at the retention time of around 49.5 min, 51 min, 52 min and 53 min in the chromatogram with a descending order of the molar mass. The intensity of low molar mass fraction (i.e. Peak 1) was much greater for 0.7 mole ratio UF resins than those of 1.0 mole ratio. In other words, 0.7 mole ratio UF resins are containing a large fraction of low molecular weight species.
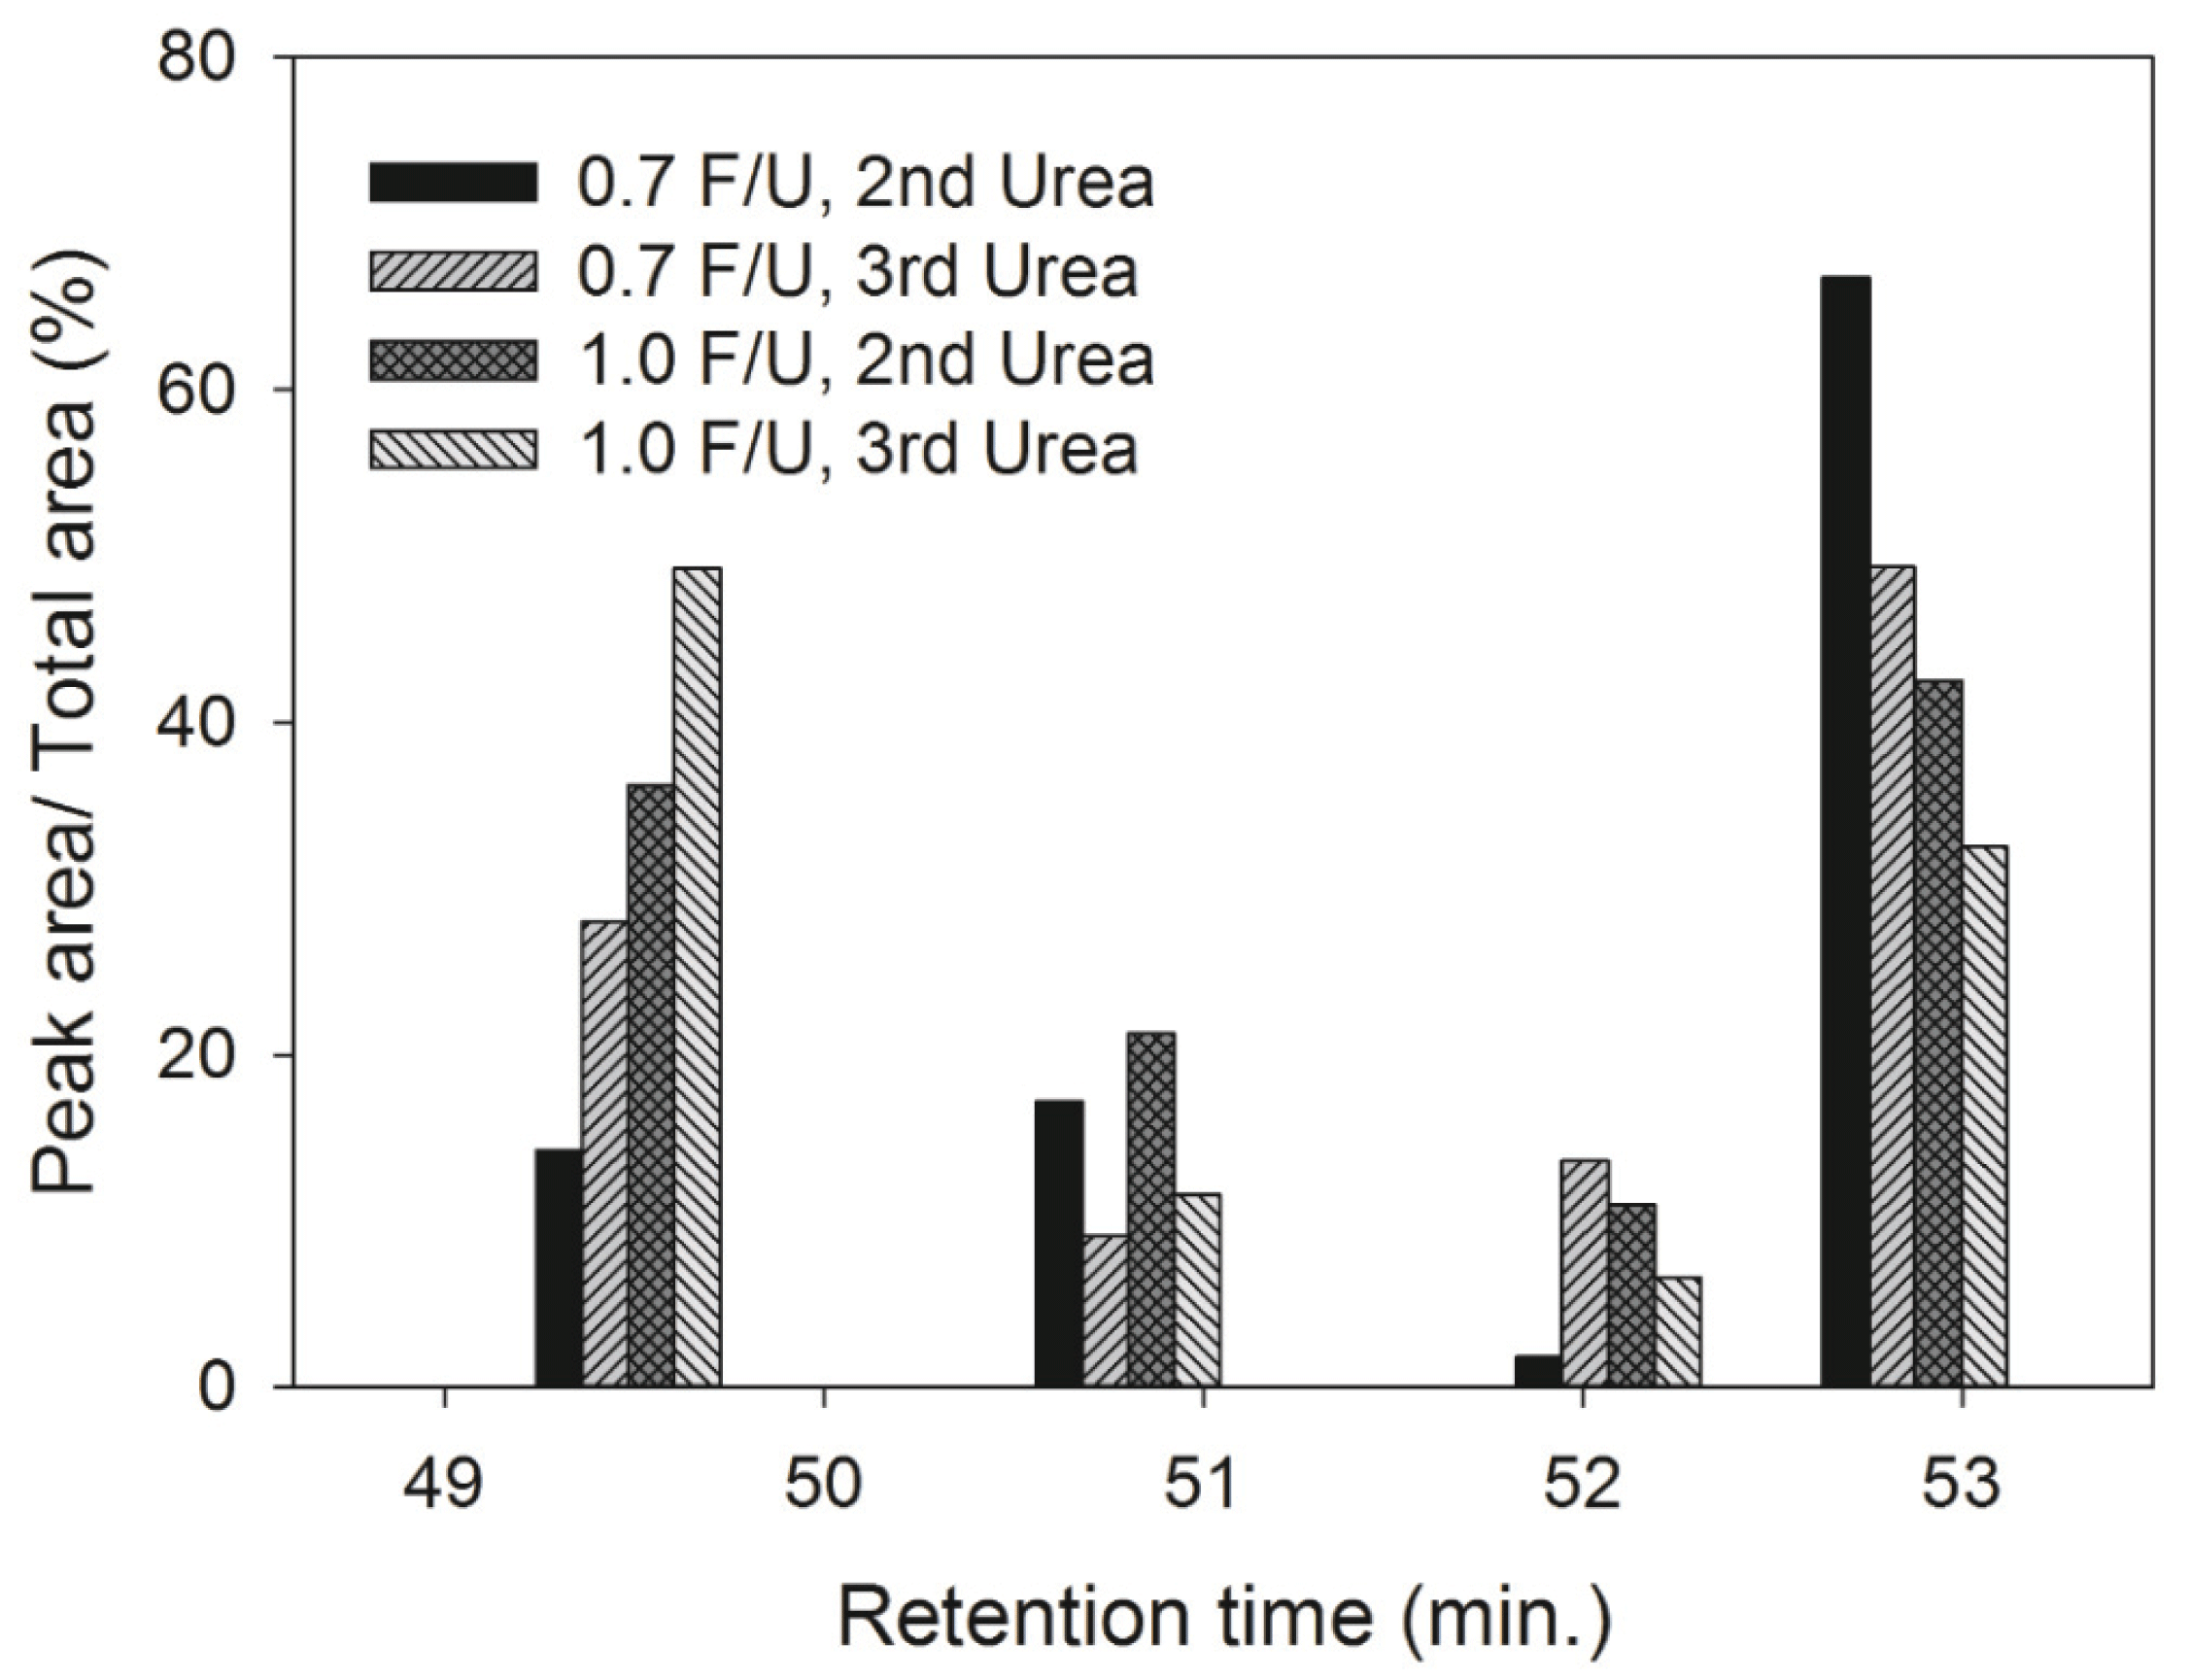
In order to compare the molecular weight fraction of four peaks from GPC chromatograms as shown in Fig. 1, the percentage of each peak area was determined by dividing the each peak area with the total peak area of each GPC chromatogram, and the results were displayed in Fig. 2. The area percentage of Peak 4 that was mainly composed of high molecular weight (HMW) species increased as the number of urea addition and F/U mole ratio increased. However, the area percentage of Peak 1 responsible for low molecular weight (LMW) species decreased with an increase in the number of urea addition and F/U mole ratio. These results indicate that the fraction of HMW increases while the LMW fraction decreases as the number of urea additions and F/U mole ratio.
Using GPC chromatograms, the number average molecular weight (Mn), weight average molecular weight (Mw), and polydispersity index (PDI) of all UF resins were determined, and the results were presented in Fig. 3. As the number of urea addition increased, the Mn and Mw, increased for each F/U mole ratio UF resin. Both Mn and Mw of the 1.0 mole ratio UF resins were greater than those of 0.7 mole ratio. These results are compatible with the gelation time of these resins. In other words, as the number of urea addition and F/U mole ratio increased, the molecular weight increased, which resulted in an increase in the viscosity and short gelation time of the resins. However, PDI did not change much as the number of urea addition and mole ratio increased.
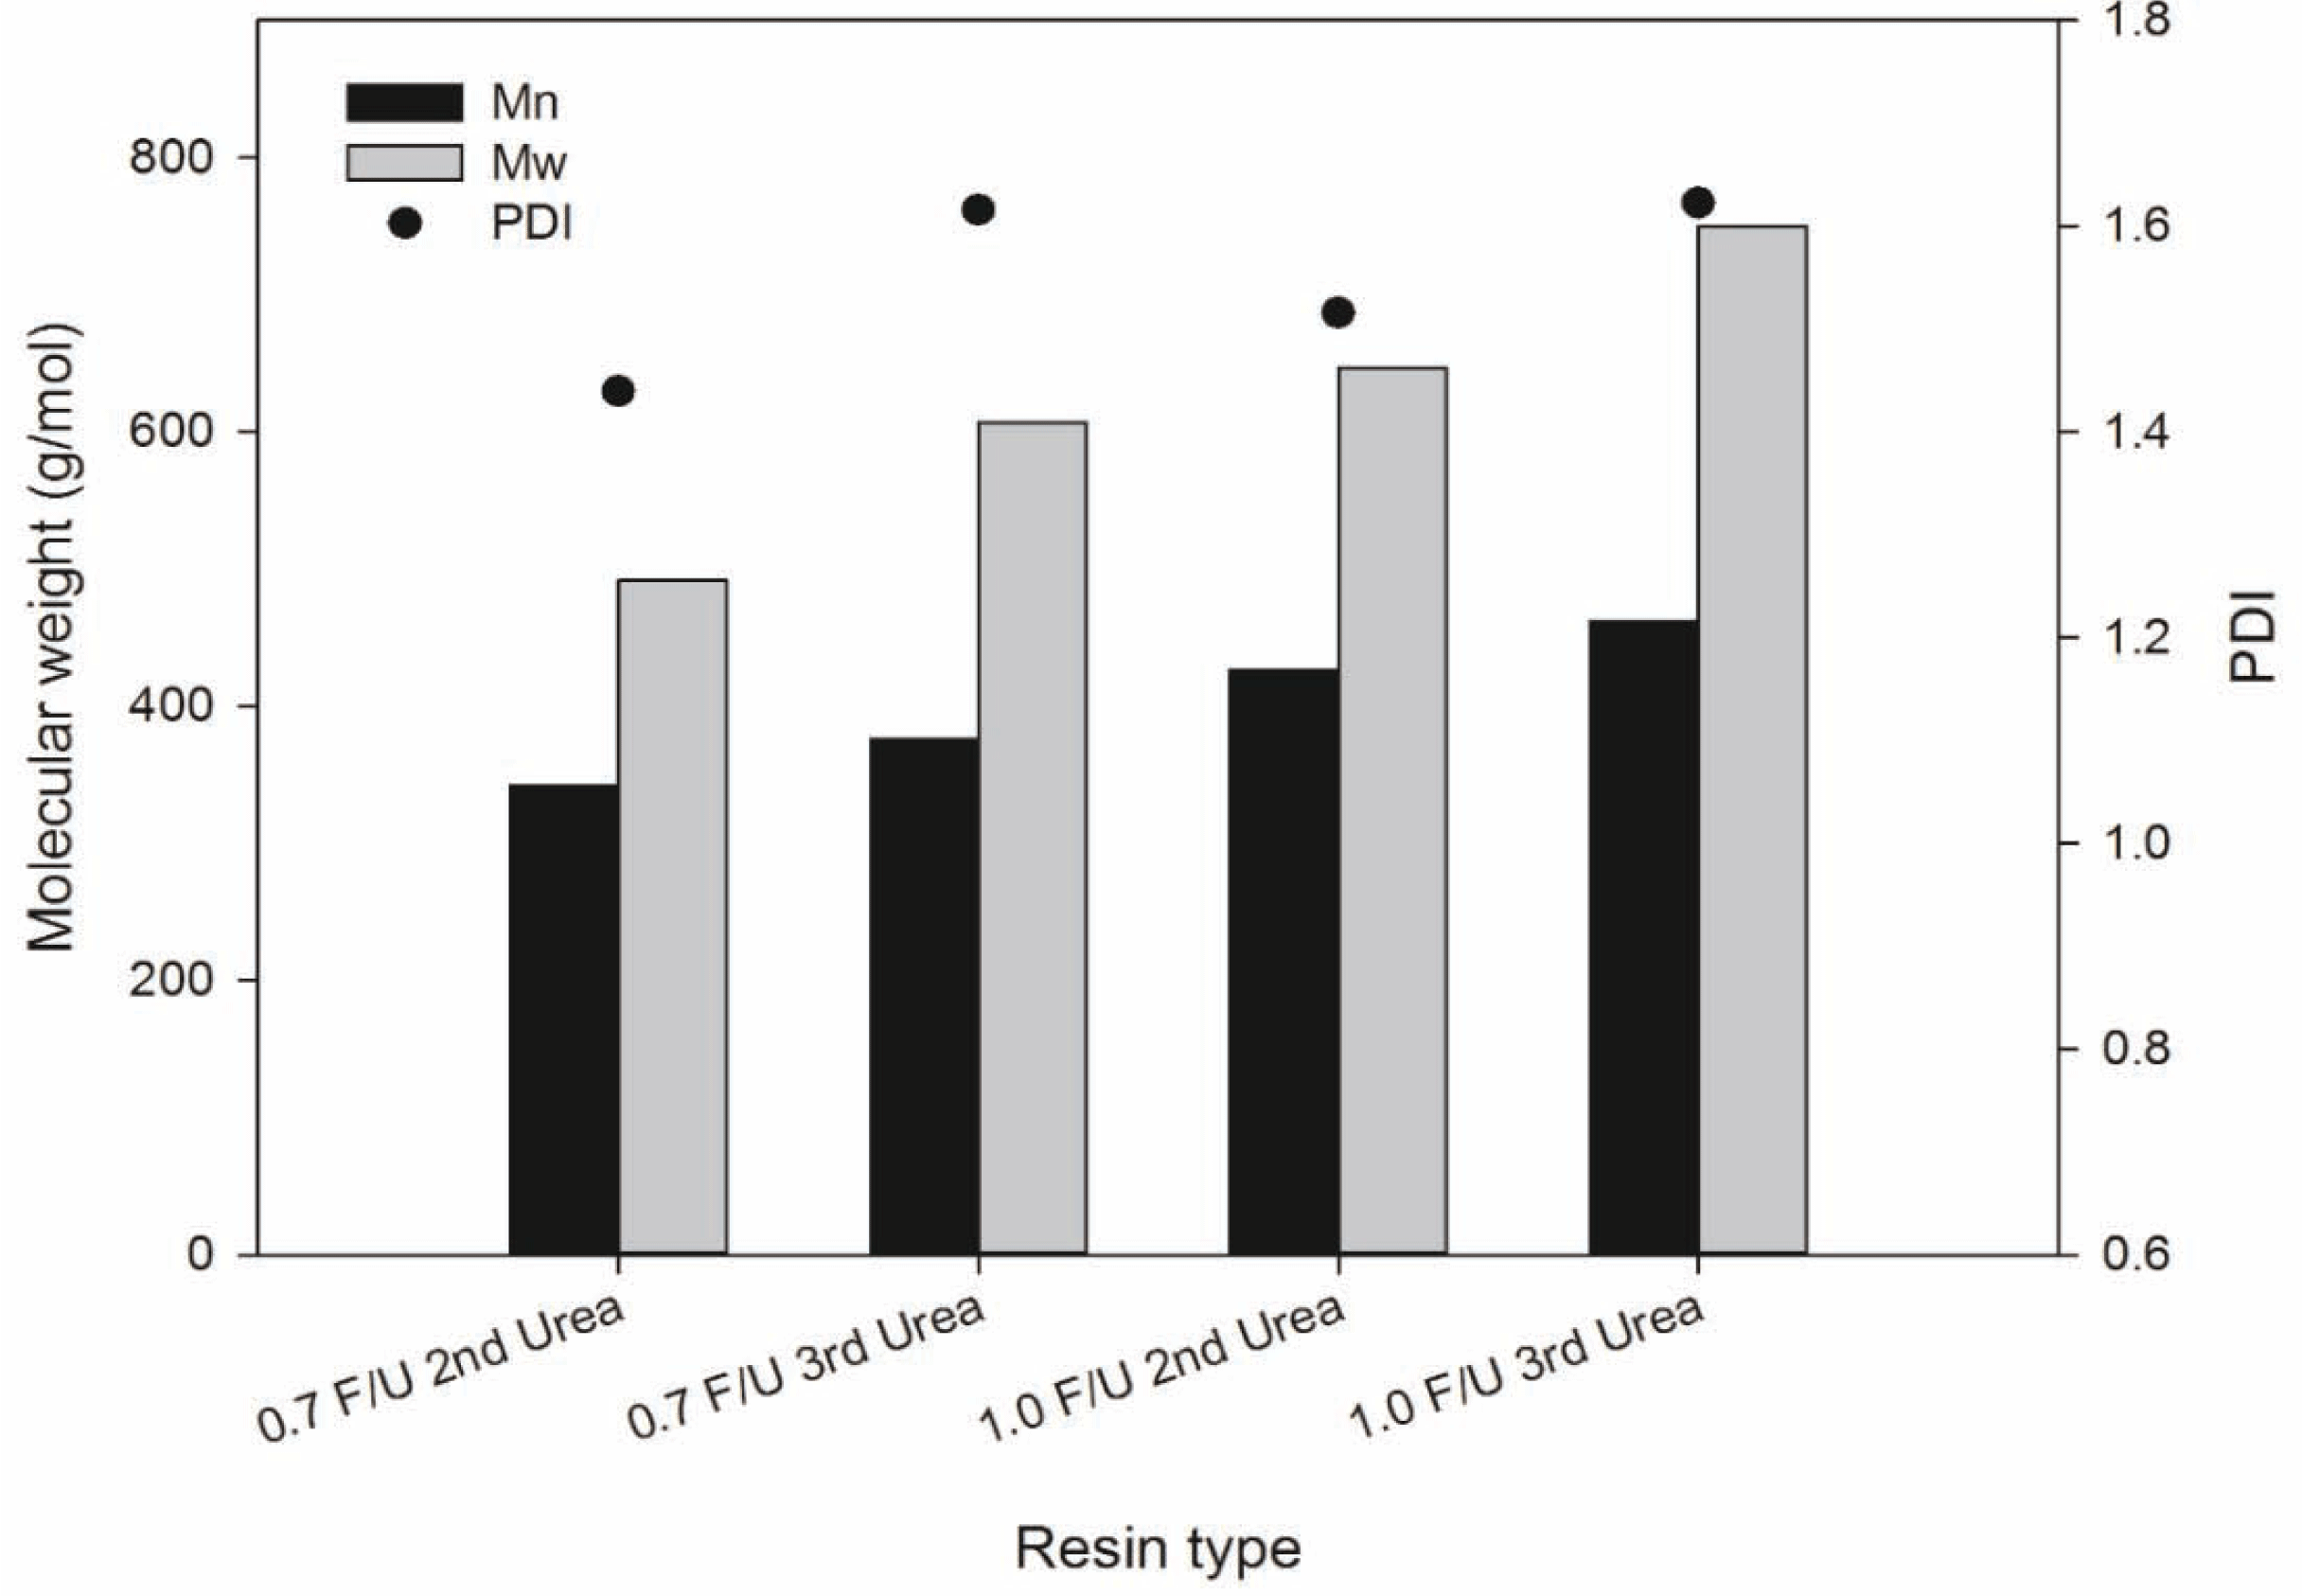
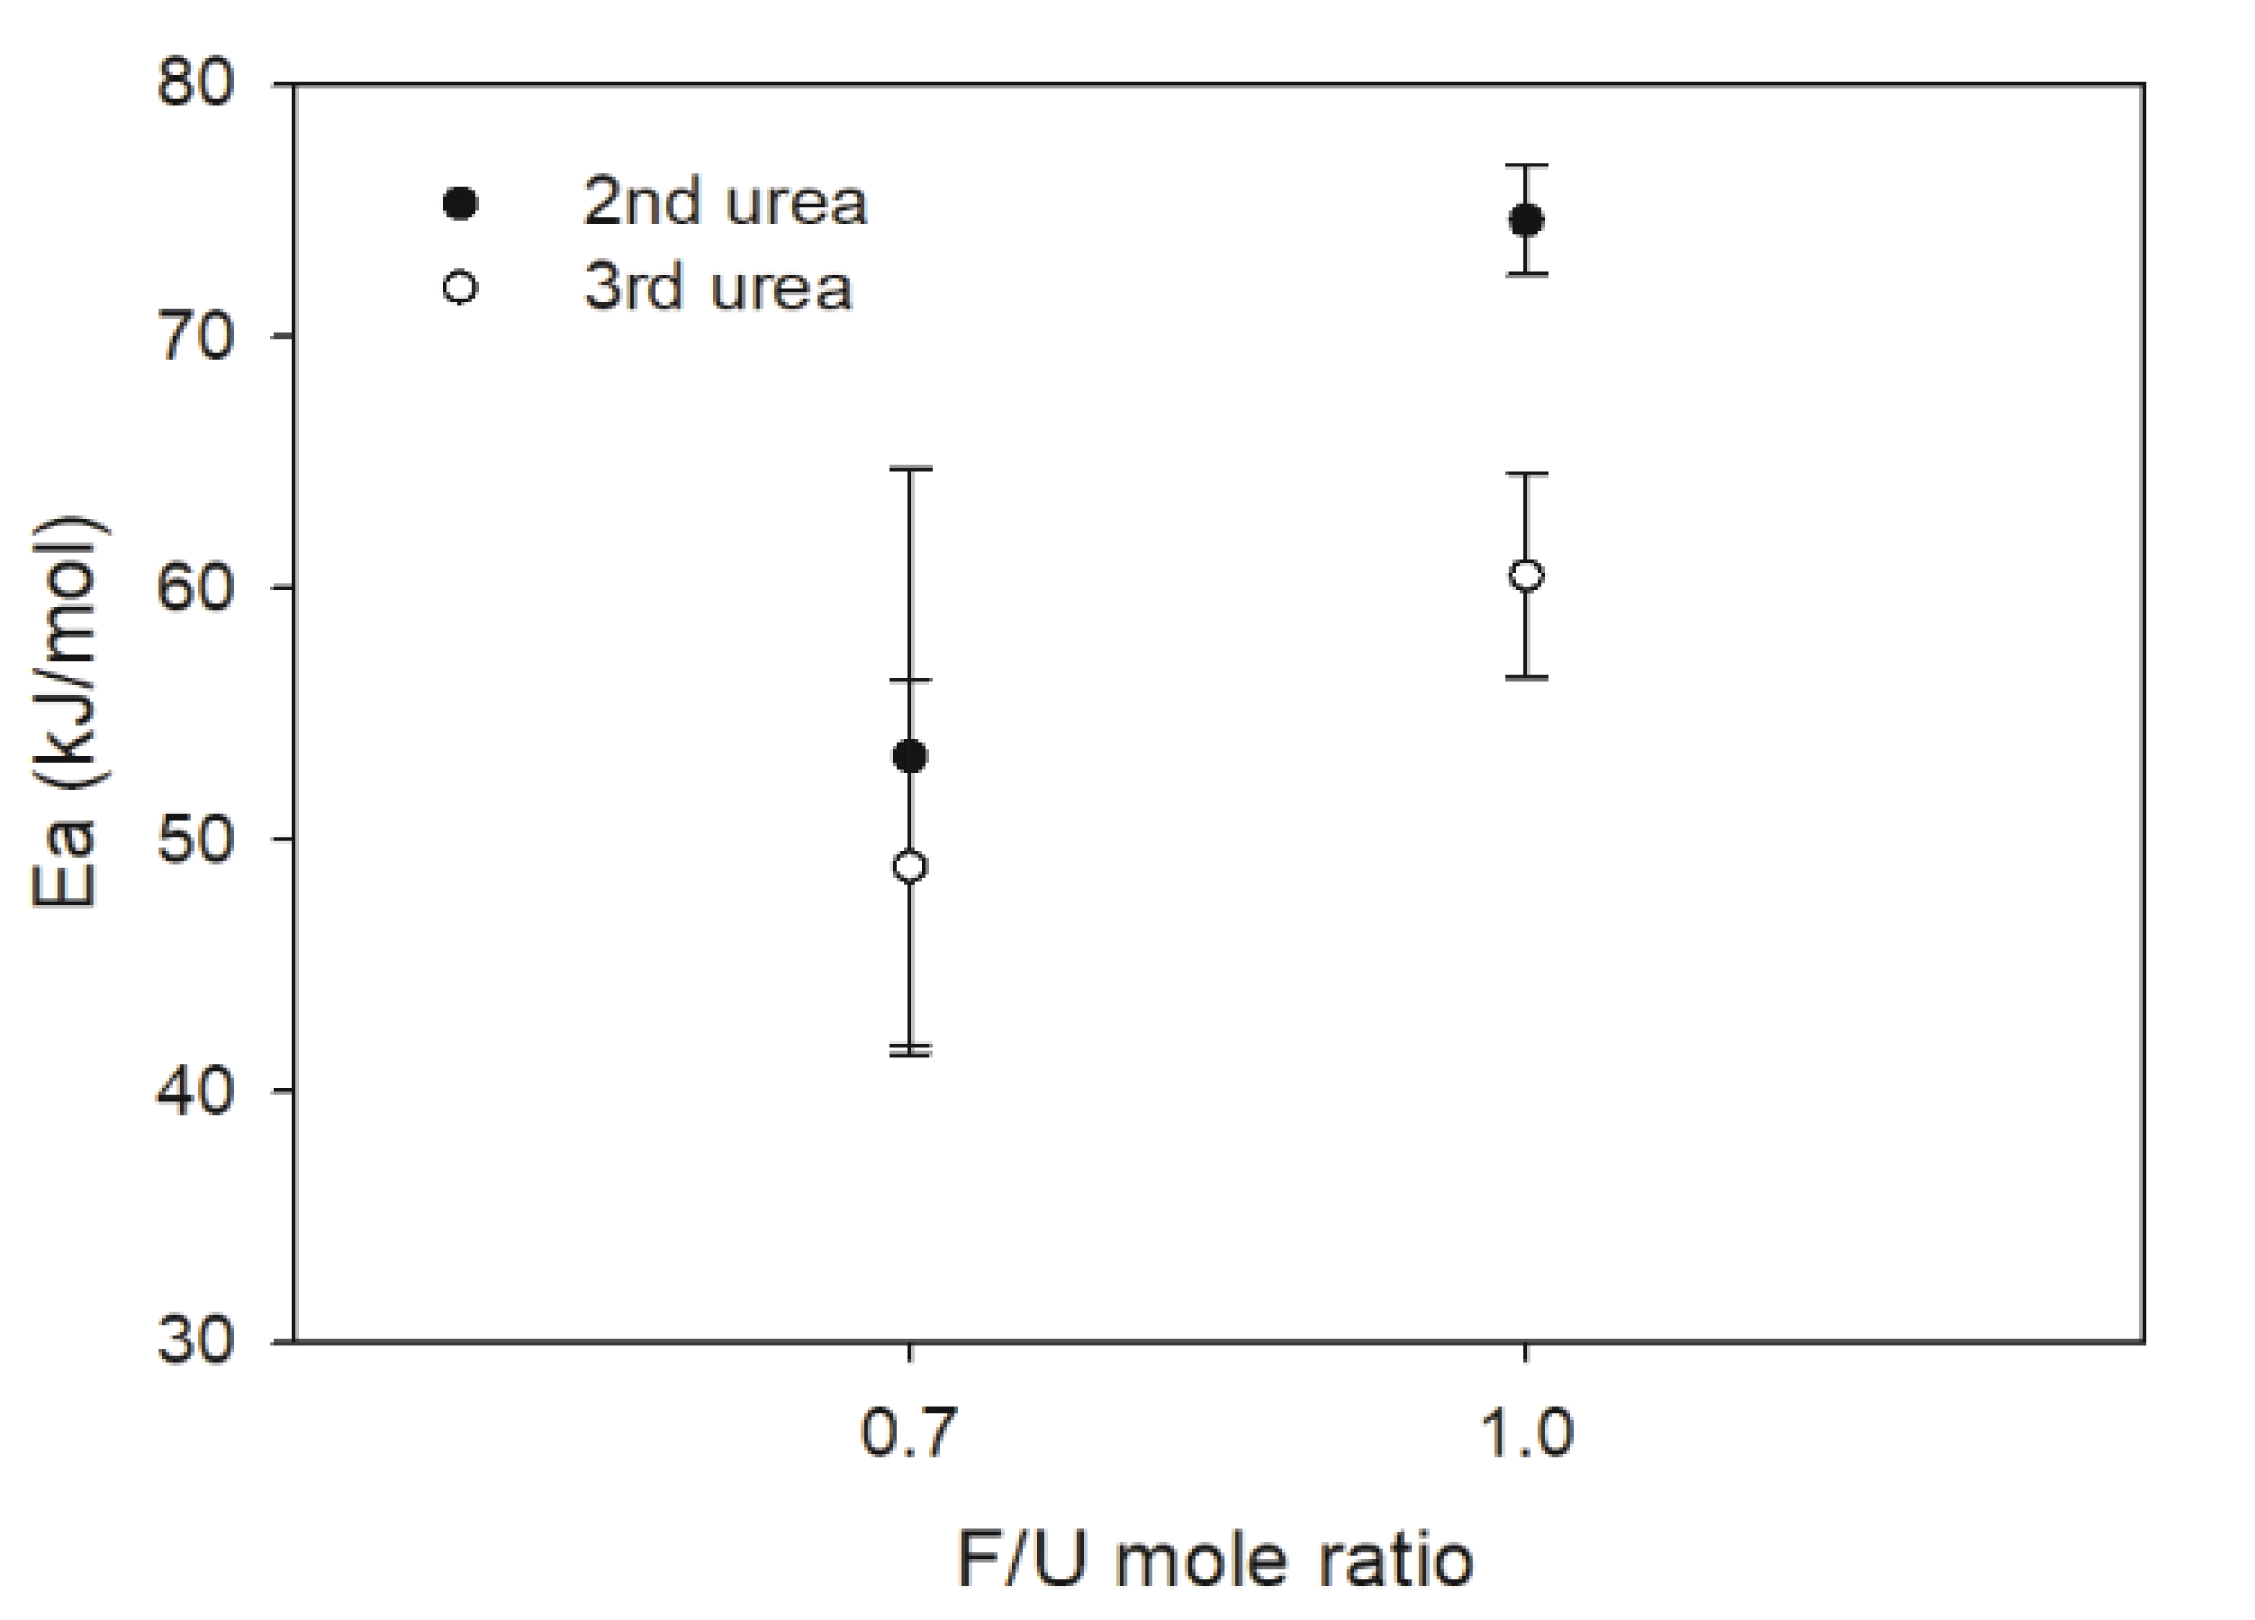
Fig. 4 shows changes of activation energy (Ea) values of UF resins prepared with different numbers of urea addition and F/U mole ratios. Both Kissinger and isoconversional methods were employed to determine EaandEα for thermal curing of UF resins prepared with different numbers of urea addition and F/U mole ratios. As a result, the 1.0 F/U mole ratio resin had higher Ea than that those of 0.7 F/U mole ratio. This result could be due to greater fraction of HMW species in UF resins with high F/U mole ratio as reported by Park et al. (2006). By contrast, UF resins prepared with the third urea addition had lower Ea than those synthesized with the second urea addition, regardless of the F/U mole ratio. UF resins synthesized with the third urea addition contained greater fraction of the LMW species, which resulted in more energy to start their curing.
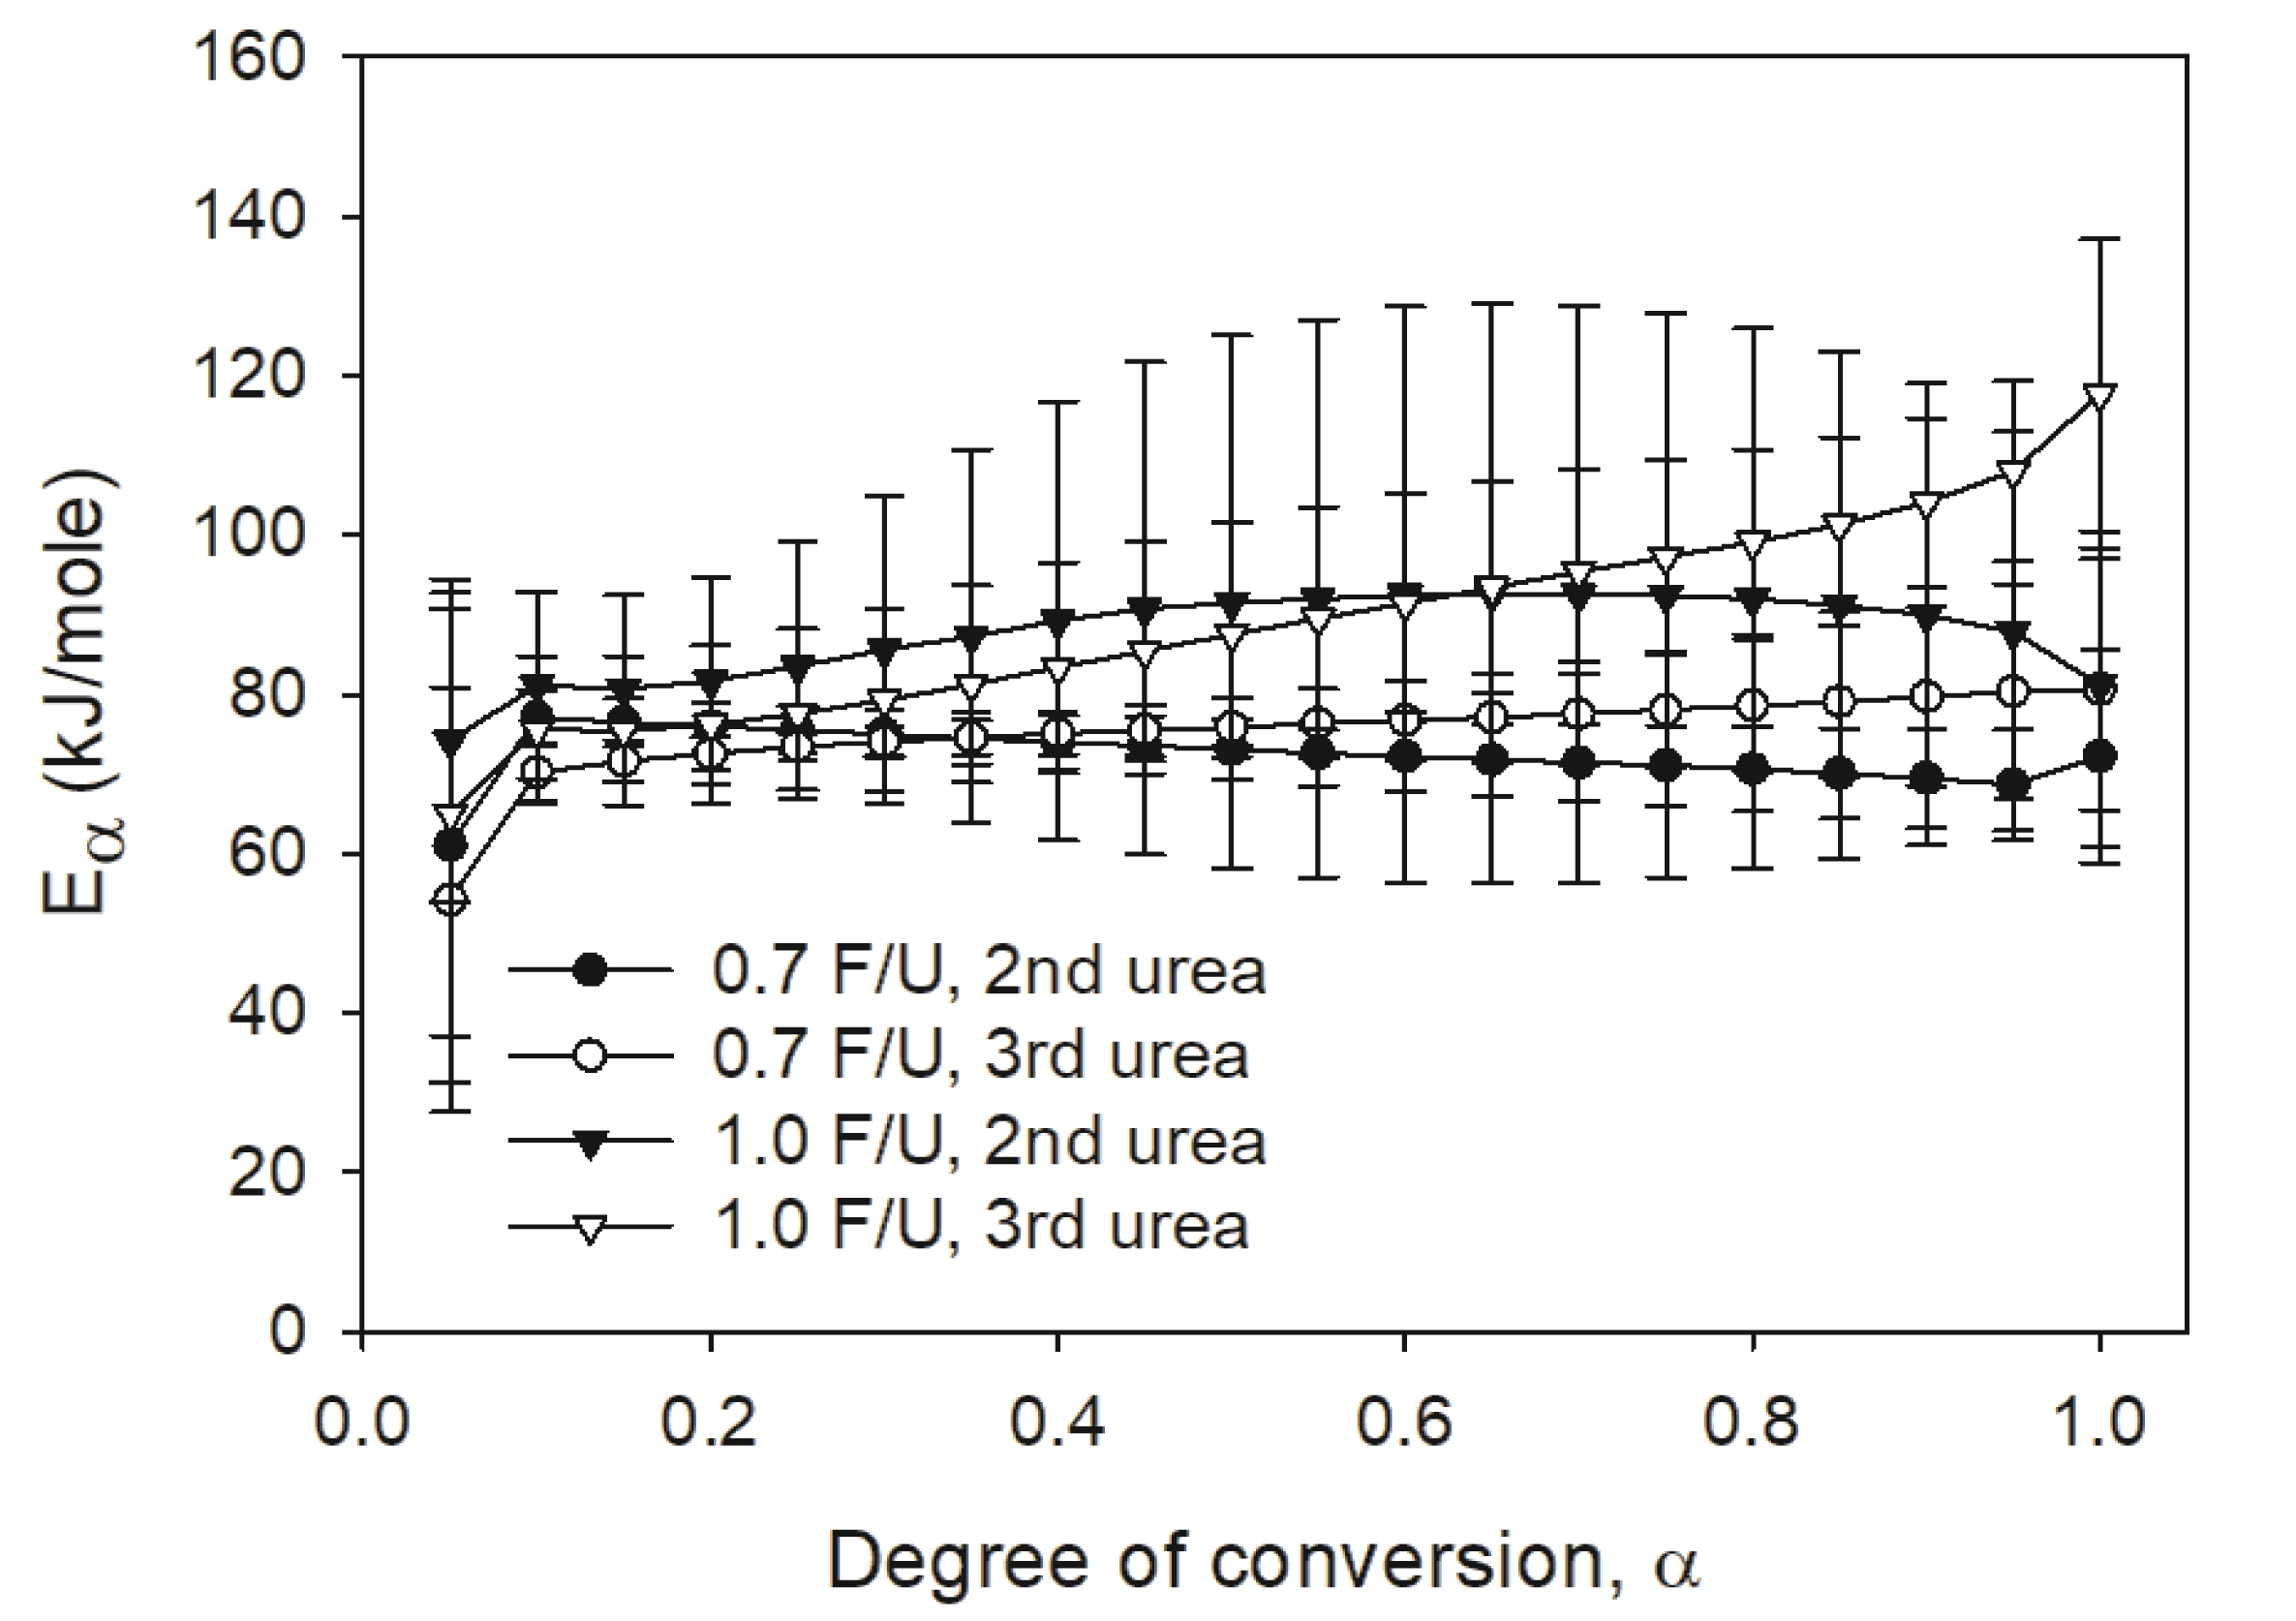
In addition, the isoconversional methods provided activation energy (Eα) values with UF resins prepared by different numbers of urea addition and F/U mole ratios. Fig. 5 displays the change of Eα, which provides an effective Eα as a function of the degree of conversion (α) (Vyazovkin, 2006). Thus, a change of the Eα value could provide information on a curing process where a transition from chemical-controlled reaction to diffusion-controlled reaction could occur as the α increases (Samarzija-Janovic et al., 2011). As shown in Fig. 5, all 1.0 F/U mole ratio resins showed higher Eα than those of 0.7 F/U mole ratio resins. Furthermore, the 1.0 F/U mole ratio resin with the third urea addition started to deviate at α=0.3. The deviation of Eα of 1.0 F/U mole ratio resin with the third urea addition was probably due to the multiple-step process in their curing reaction, which indicated an early transition from chemical-controlled reaction to diffusion-controlled reaction. Another factor of causing the diffusion-controlled reaction for this resin could be responsible for the crystalline or nodular structure of 1.0 F/U mole ratio UF resins as reported by Park and Causin (2013). On the contrary, no significant changes of Eα values were found for all 0.7 F/U mole ratio resins as the α increased. This could be due to that the UF resins with 0.7 F/U mole ratio contained a large fraction of LMW species, which followed a chemical-controlled reaction in their curing.
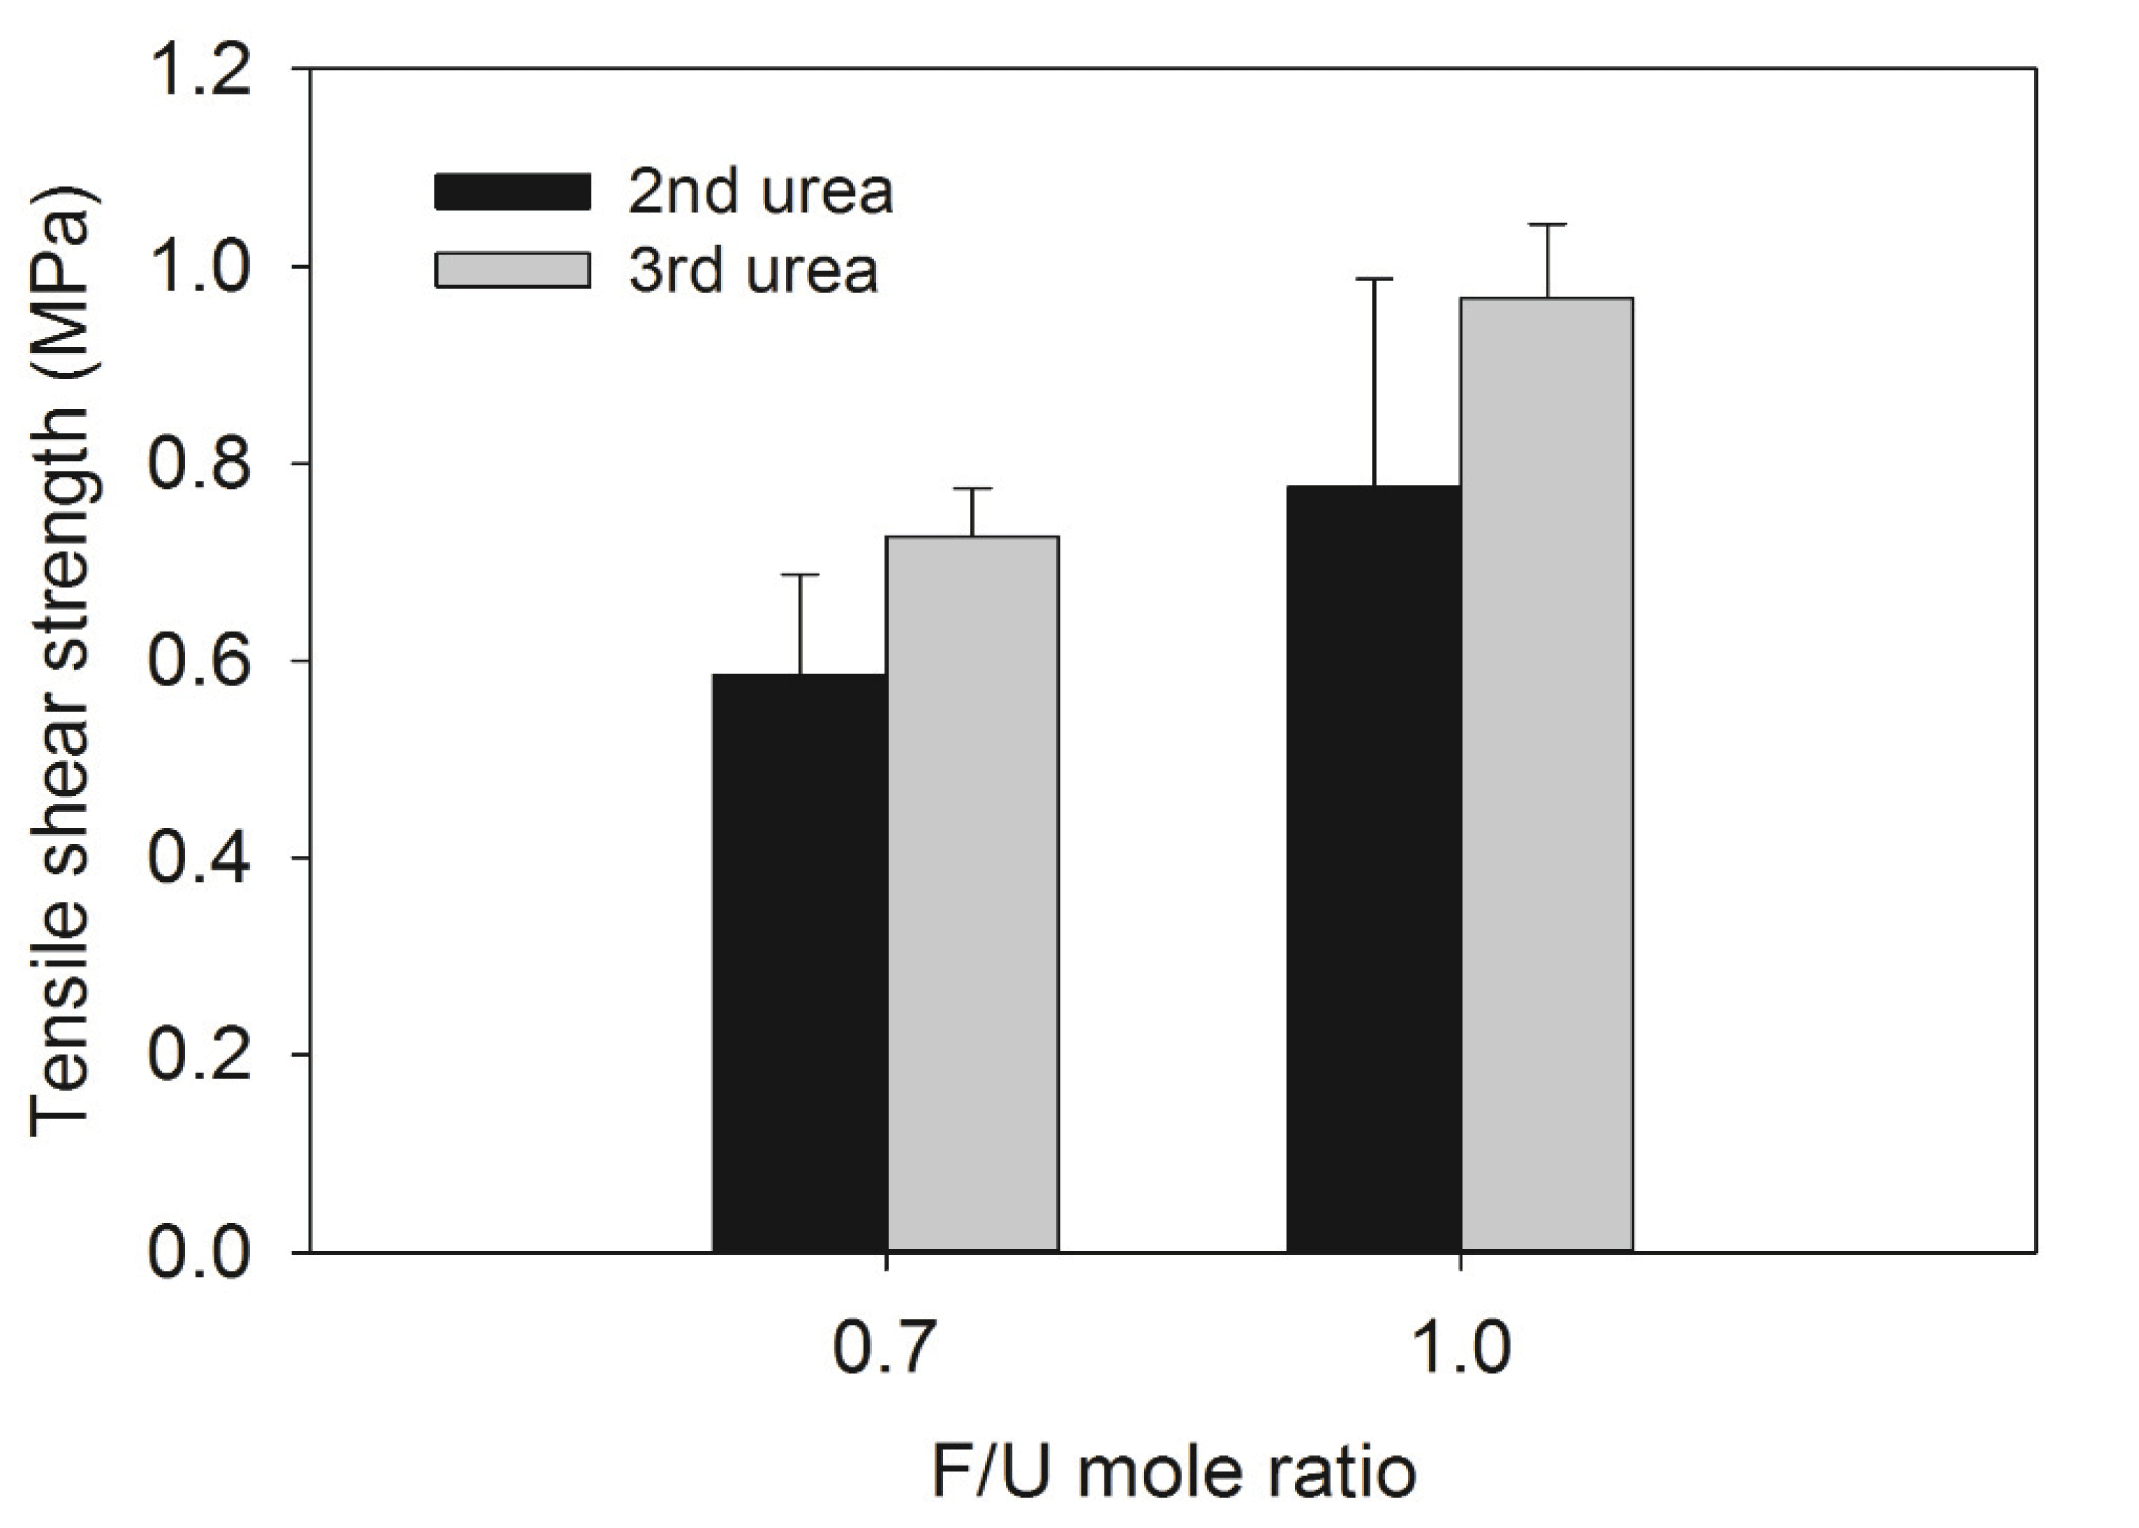
As a way of the performance of all UF resins, tensile shear strength and formaldehyde emission of plywood was determined and the results were presented in Fig. 6. As expected, the 1.0 F/U mole ratio UF resins had higher tensile shear strength than those of 0.7 F/U mole ratio UF resins. However, the tensile strength increased as the number of urea addition increased, regardless of the F/U mole ratio. This result could be attributed to better cohesion of 1.0 F/U mole ratio UF resins that had a greater fraction of HMW species as shown in Fig. 1.
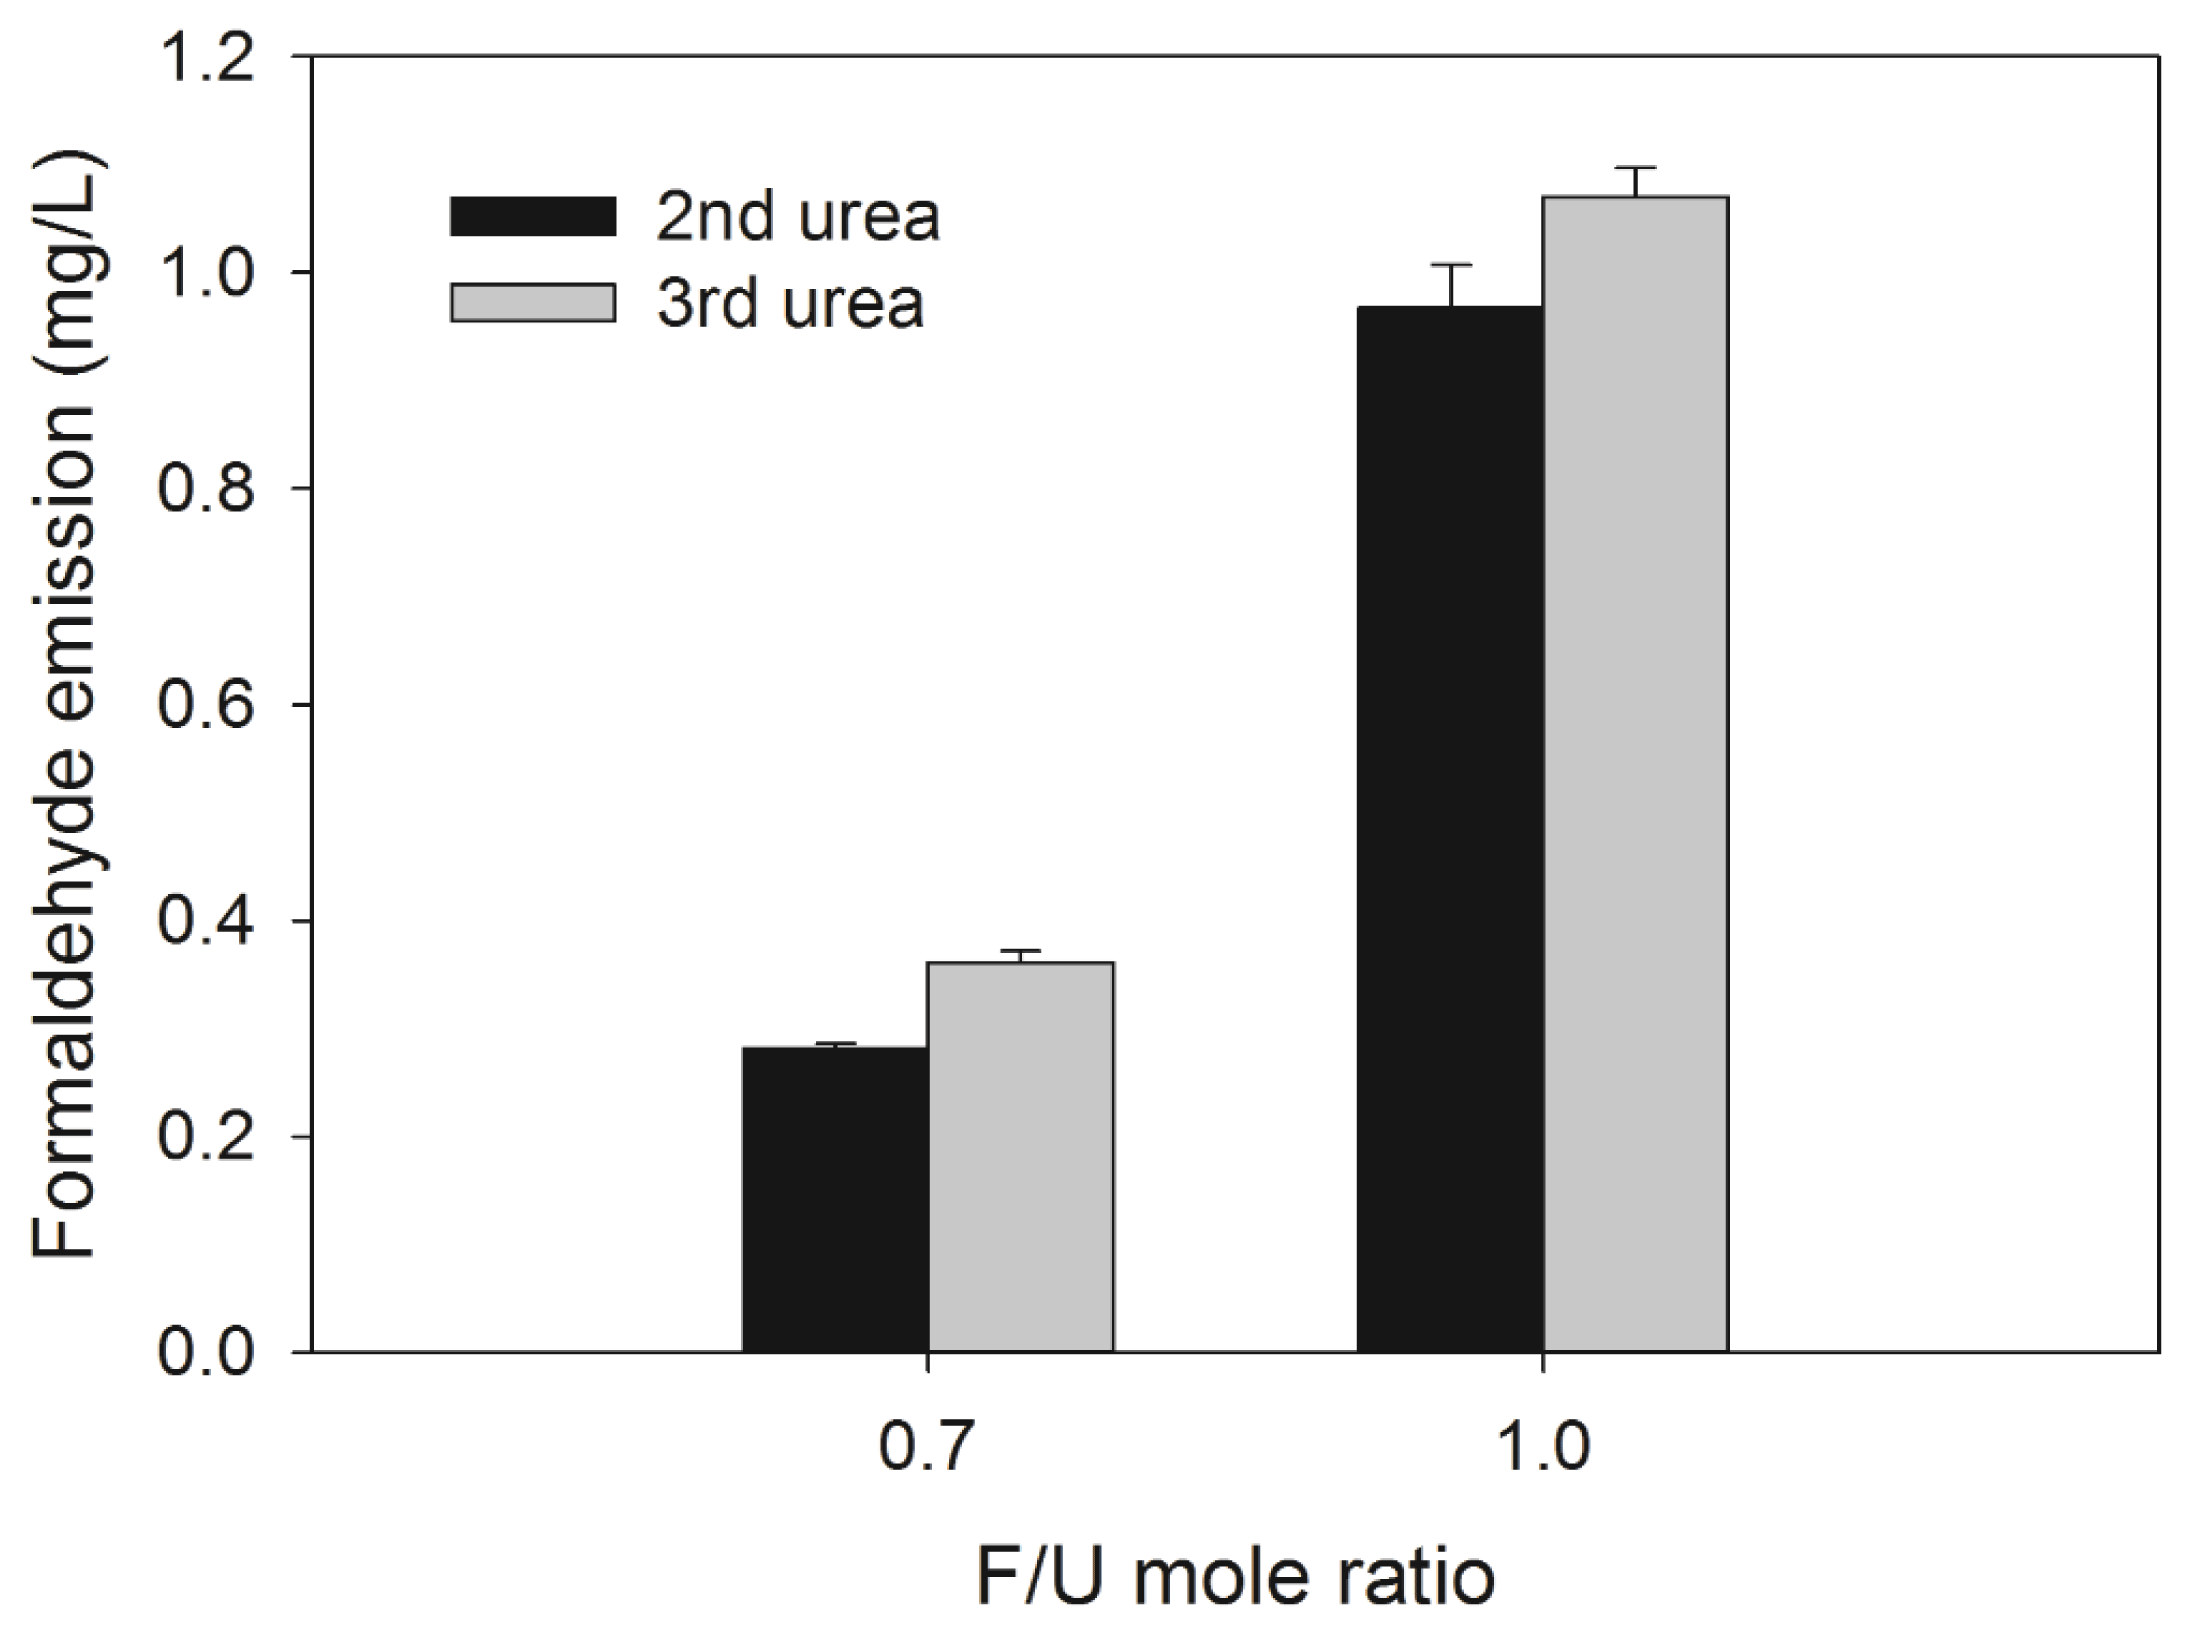
As shown in Fig. 7, 0.7 F/U mole ratio UF resins had low formaldehyde emission than those of 1.0 F/U mole ratio UF resins, which was possibly due to lower amount of free formaldehyde. However, the formaldehyde emission was high as the number of urea addition increased, regardless of F/U mole ratio. These results could be due to a large LMW fraction of UF resins synthesized with the third urea addition. In other words, the large LMW fraction in the UF resins could have more hydroxymethyl ether groups, which eventually changed to methylene linkages by splitting a formaldehyde molecule in the curing reaction (Pizzi et al., 1994).
4. CONCLUSION
This study investigated effects of the number of urea addition and F/U mole ratio to the performance of low F/U mole ratio UF resins by characterizing their molecular weights, cure kinetics, and adhesion performance. The following conclusions were made from this study:
As the number of urea addition and F/U mole ratio increased, the resin viscosity increased while the gelation time decreased. Both Mn and Mw were greater for 1.0 F/U mole ratio UF resins than those of 0.7 F/U mole ratio, and increased with an increase in the number of urea addition. But, the PDI did not change for UF resins.
The 1.0 F/U mole ratio resins had higher Ea than those of 0.7 F/U mole ratio resins, and UF resins with the third addition of urea showed lower Ea than those with the second addition of urea, regardless of the F/U mole ratio. In addition, all 1.0 F/U mole ratio resins had higher Eα than those of 0.7 F/U mole ratio resins.
As the number of urea addition and F/U mole ratio increased, tensile shear strength of plywood increased, however, the formaldehyde emission increased.


