1. INTRODUCTION
Wood is a porous material composed of several kinds of woody plant cells. Cells are composed of cell walls and cell lumens, and there are cylindrical pores in the fiber direction and pits of micro pores are on the thickness direction of cell walls. These pores serve as a channel of moisture and nutrients for the tree. The pores in the wood are filled with air when wood is dried so the density of wood is relatively low, wood has good heat insulation, excellent electrical insulating properties and impact and vibration absorption. If more detailed pore structure of wood could be understood, processing and improvement of wood would be easy.
For example, the chemical amount of preservative or fire retardant treatment could be predicted when the pore structure of wood was exactly figured out.
There are many prior studies the pore size of wood was measured by various analytical methods. Stamm(1931) reported that the results of pore size of wood evaluated by three physical value estimation methods (electrical conductivity, air permeability and surface tension). Stayton and Hart (1965) reported that the results the pore diameter of the wood using a mercury intrusion porosimeter. Oh and Lee (1998) reported that the quantitative characteristics of pores in hardwood was analyzed by an image analysis program. Kang et al. (2018) reported that changes of pore size and bubble point pore diameter of the Malas (Homaliumfoetidum) by heat treatment using a capillary flow porometer. Jang et al. (2018) measured the pore size of the Hanji wallpaper made of the Paper mulberry with CFP and reported the relationship with pore size and sound absorption. Jang et al. (2018) measured the pore size cross-sections of eleven domestic wood using a mercury intrusion porosimeter and capillary flow porometer. As a result, pore size measured by mercury intrusion porosimeter were smaller than those measured by capillary flow porometer. Kang et al. (2018) reported that the pore size and permeability of yellow poplar using a capillary flow porometer were increased after organic solvent pretreated.
A number of previous studies have reported on the difference in permeability between sapwood and heartwood. Stamm (1931) reported the permeability of sapwood in Slash pine (Pinusechinata) was 4000~5000 times greater than heartwood due to the different effective opening sizes of sapwood and heartwood, the maximum effective opening size of the sapwood was 3~6 times on average greater than heartwood. Fogg and Choong (2007) reported that the permeability of the sapwood in Southern pine (Pinusechinata) was 15 to 190 times higher than that of heartwood. Chen and Tang (1991) reported that the permeability of sapwood was 1000 times greater than heartwood in White oak (Quercusalba), Sugar maple (Acer saccharum) and Black walnet (Juglansnigra). Hur and Kang (1997) measured the liquid permeability of sapwood and heartwood of Red pine (Pinusdensiflora) using the pressure bomb method, and reported that the liquid permeability of sapwood was 140 times higher than heartwood.
In Korea, Yellow poplar is one of the deciduous trees which have various uses and high commercial value for structural frame, architectural interior, furniture, musical instrument and pulp (Lim et al., 2010).
The anatomical properties of domestic yellow poplar has been studied (Lee and Eom, 2011; Lee, 2016).
Kang et al. (2011) measured gas permeability in order to investigate the relationship between the sound absorption characteristics, permeability and pore structure of the cross-section of domestic Yellow poplar.
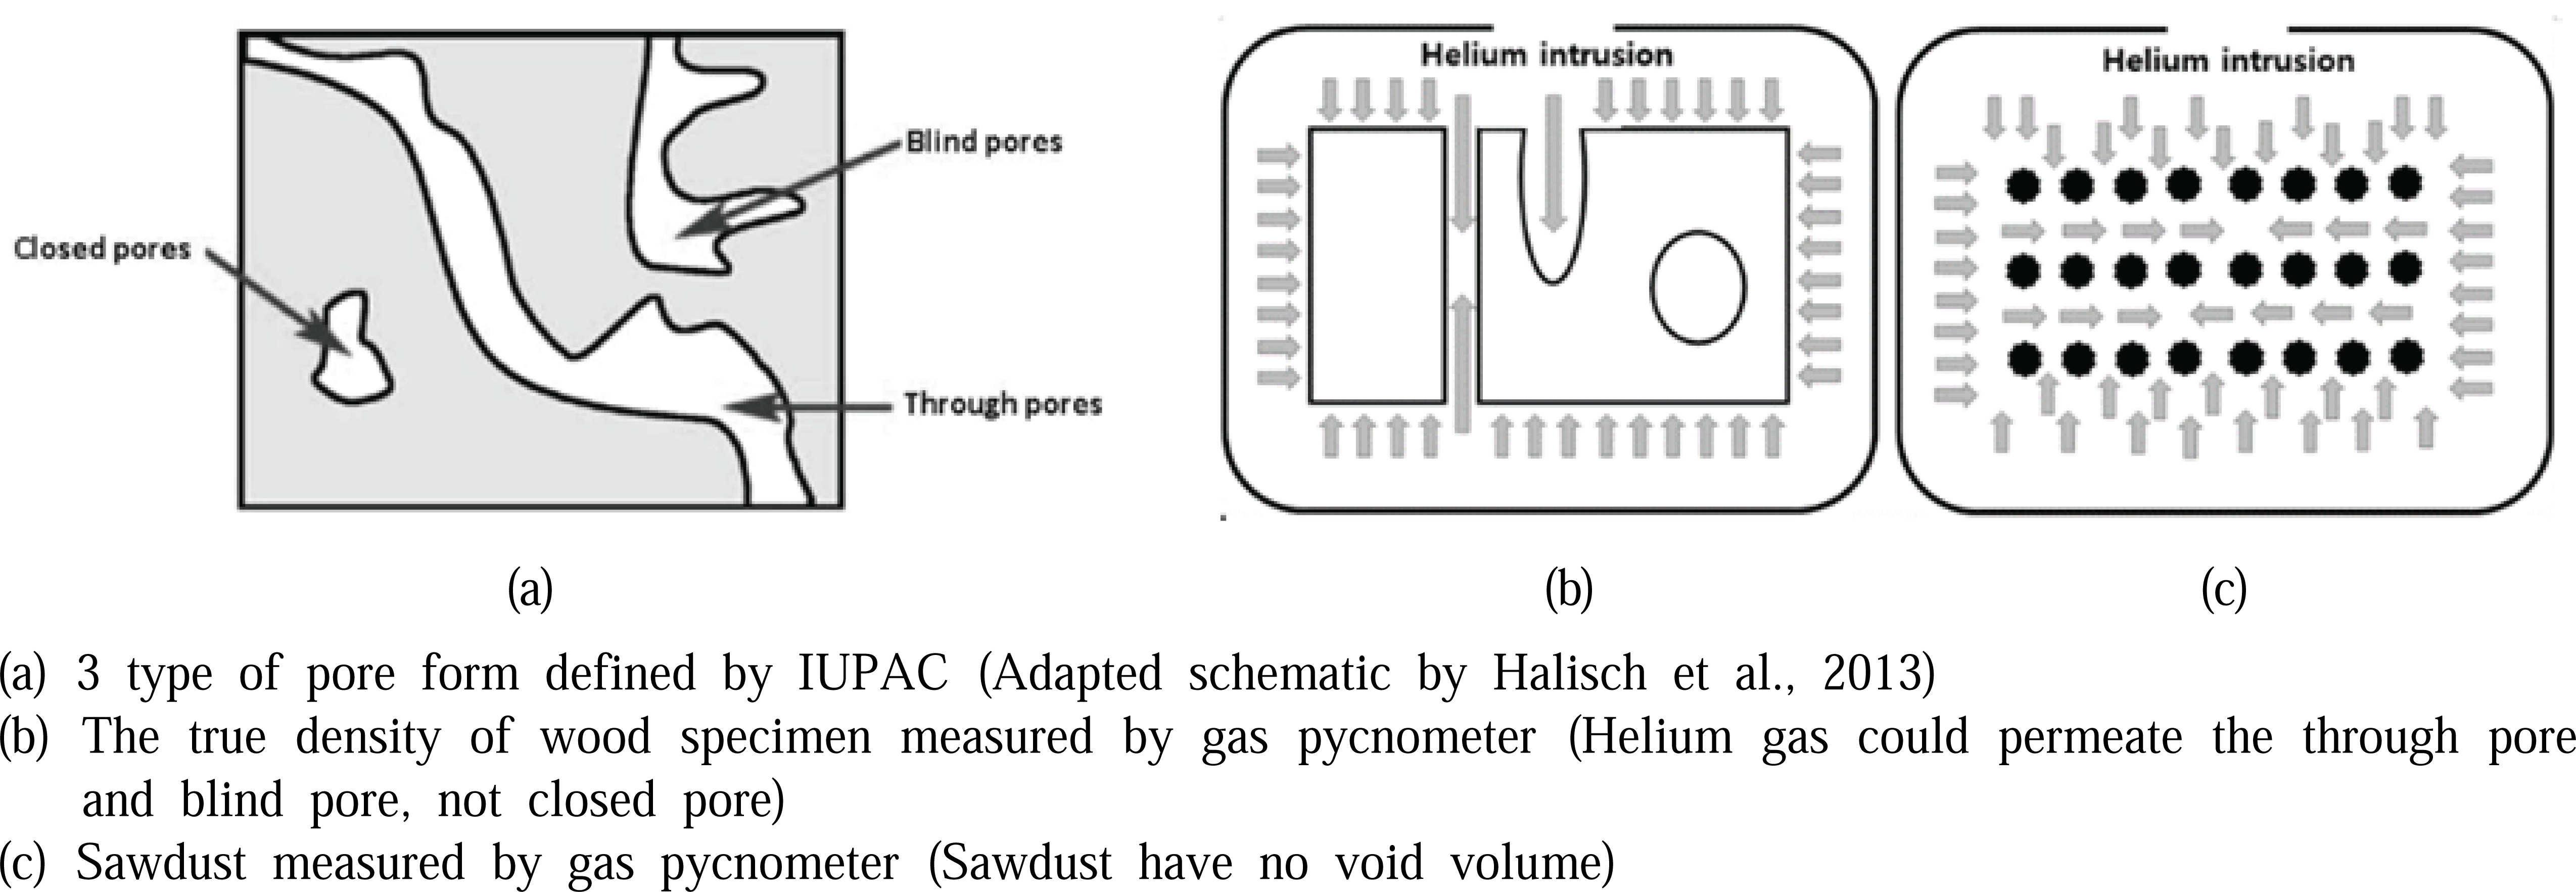
The purpose of this study is to classify the pore structure of Yellow poplar of heartwood and sapwood such as through pore, blind pore, and closed pore defined by IUPAC and to quantitate the contents of each pore type determined by gas pycnometey and capillary flow porometry as well as to investigate the relationship among permeability, pore type and size.
2. MATERIALS and METHODS
A 20-year-old Yellow poplar (Liriodendron tulipifera) logs grown in Chodanglim, Gangjin-gun, Jeollanam-do, Republic of Korea were prepared, and the equilibrium moisture content measured by KS F 2199 was 9.5 %.
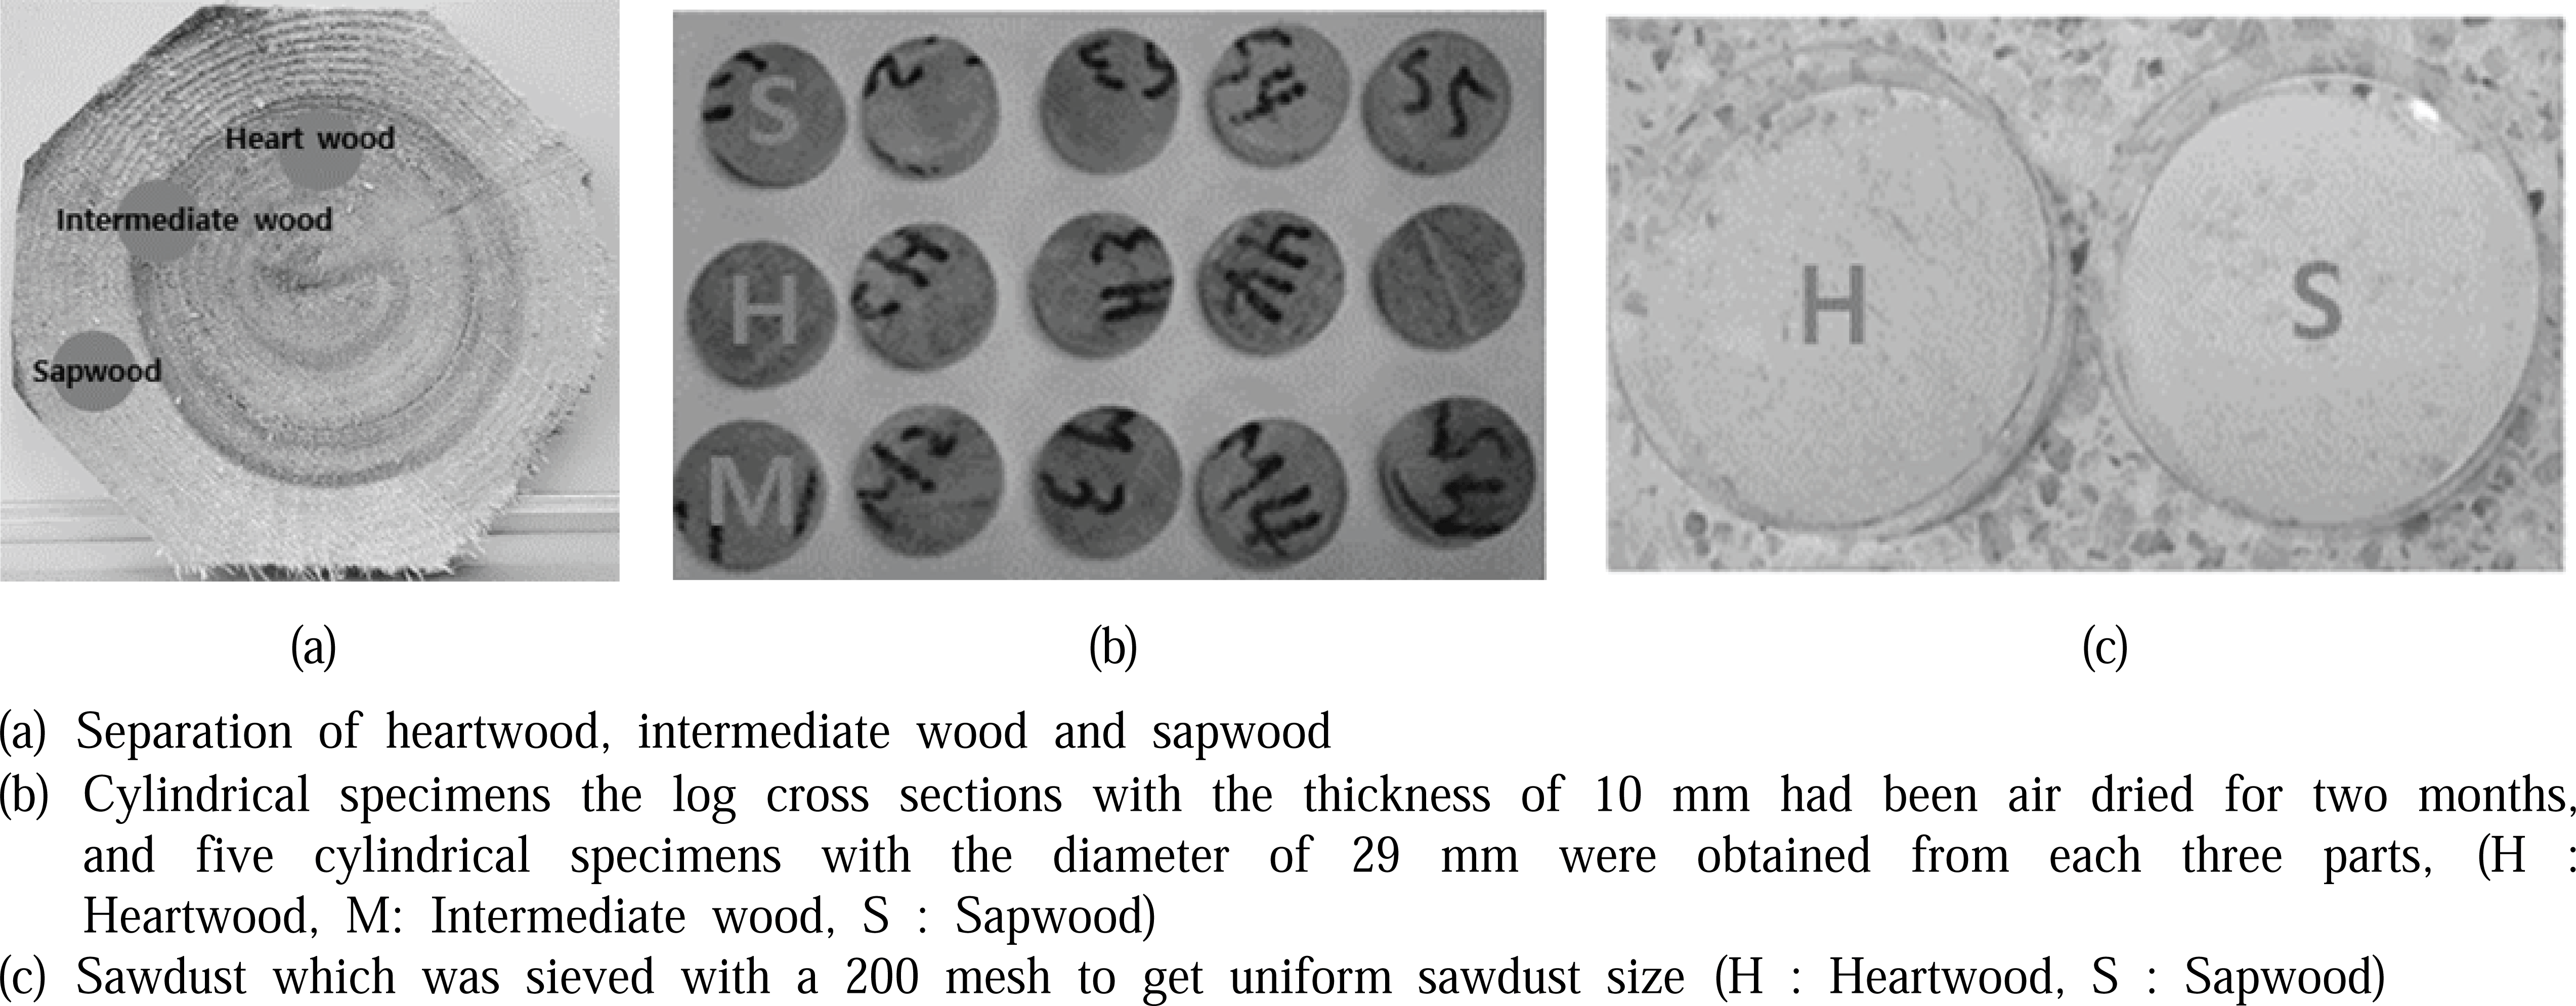
In order to measure true density of wood substance except for macro and micro pores of separated sapwood and heartwood, the wood was pulverized and divided into sapwood and heartwood sawdust. For preparing exact intermediate wood sawdust, 50 % sawdust of each heartwood and sapwood were mixed.
The preparation of the Yellow poplar specimens is shown in Fig. 1.
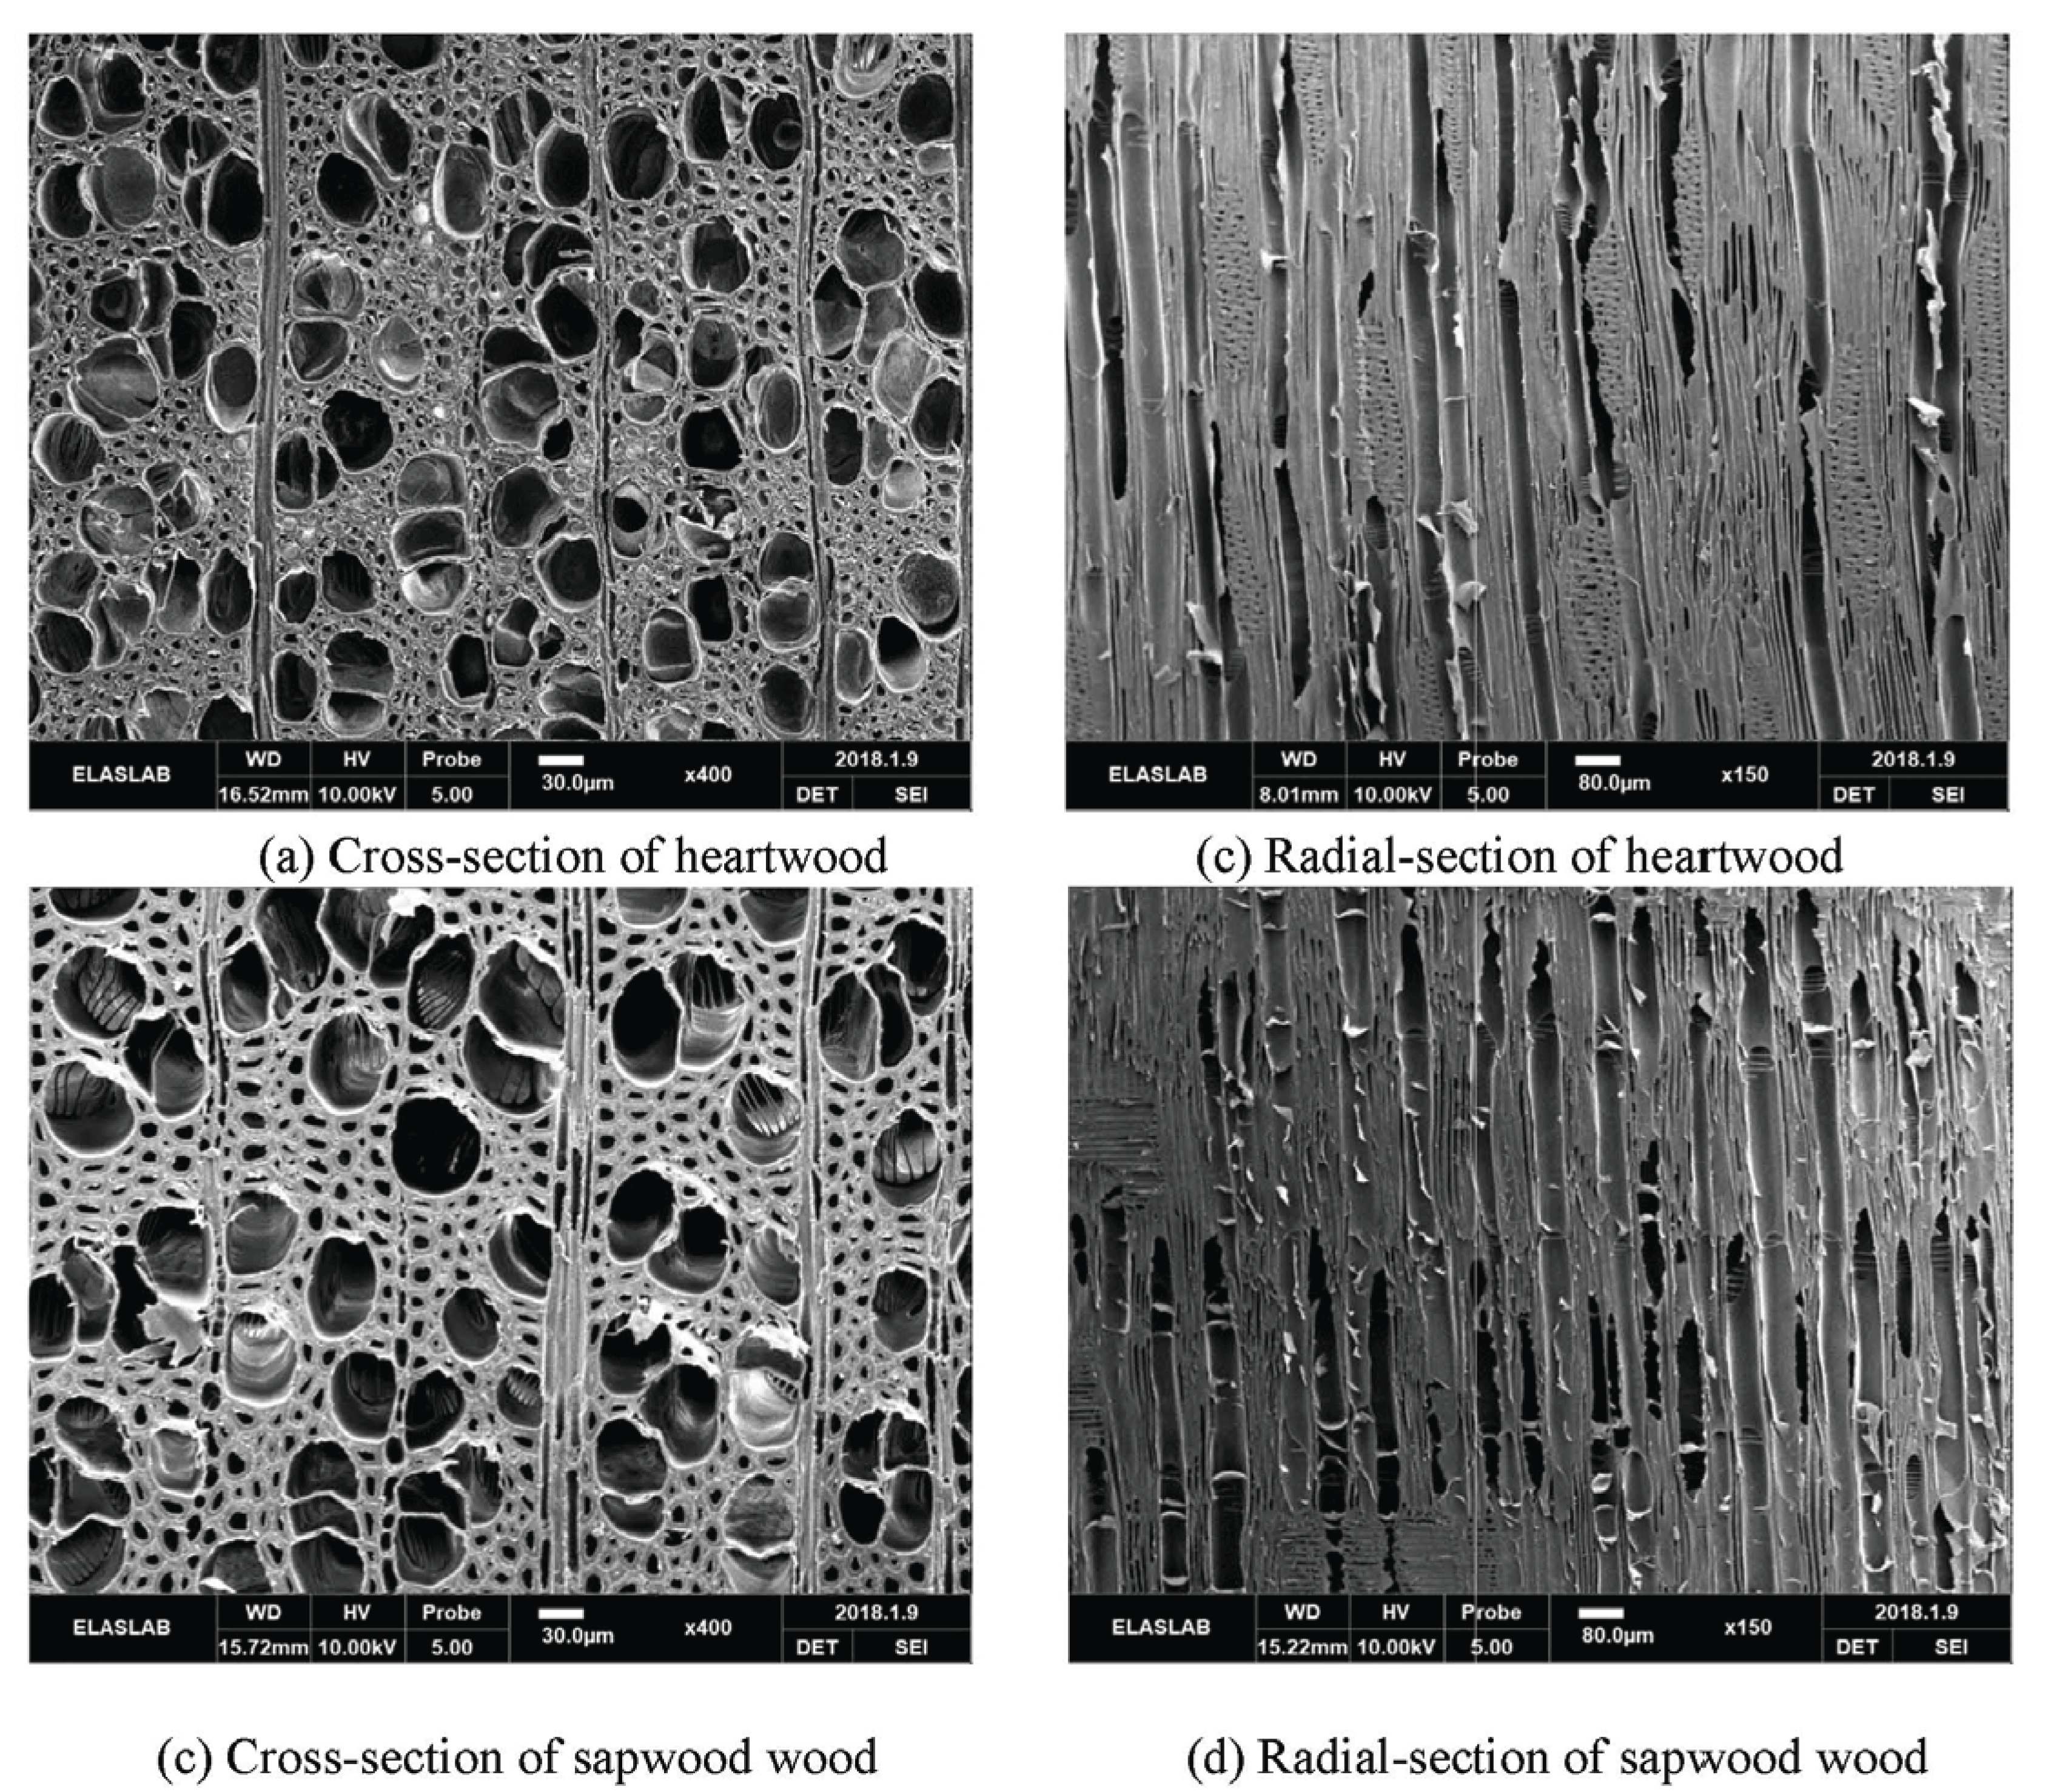
The microscopic anatomical observation was made on the cross-sectional surface of the Yellow poplar wood using a SEM. In order to get a fine image of wood surface, the radial-tangential surface of small sample specimen with the dimension of 50 × 50 × 100 mm (T × R × L) was cut several times by microtome. (Model: HM400S, Microm GmbH, Germany). Here, the small sample specimens were immersed in water for over 24 hours under the pressure of -0.1 MPa to soften the wood specimens before microtome cutting to prevent fine checks from occurring on the small sample by shear stress between microtome blade and sample specimen.
The specimen was observed at acceleration voltage of 10 KV and 400 magnification using SEM (Model: Genesis-1000, Emcrafts, Korea).
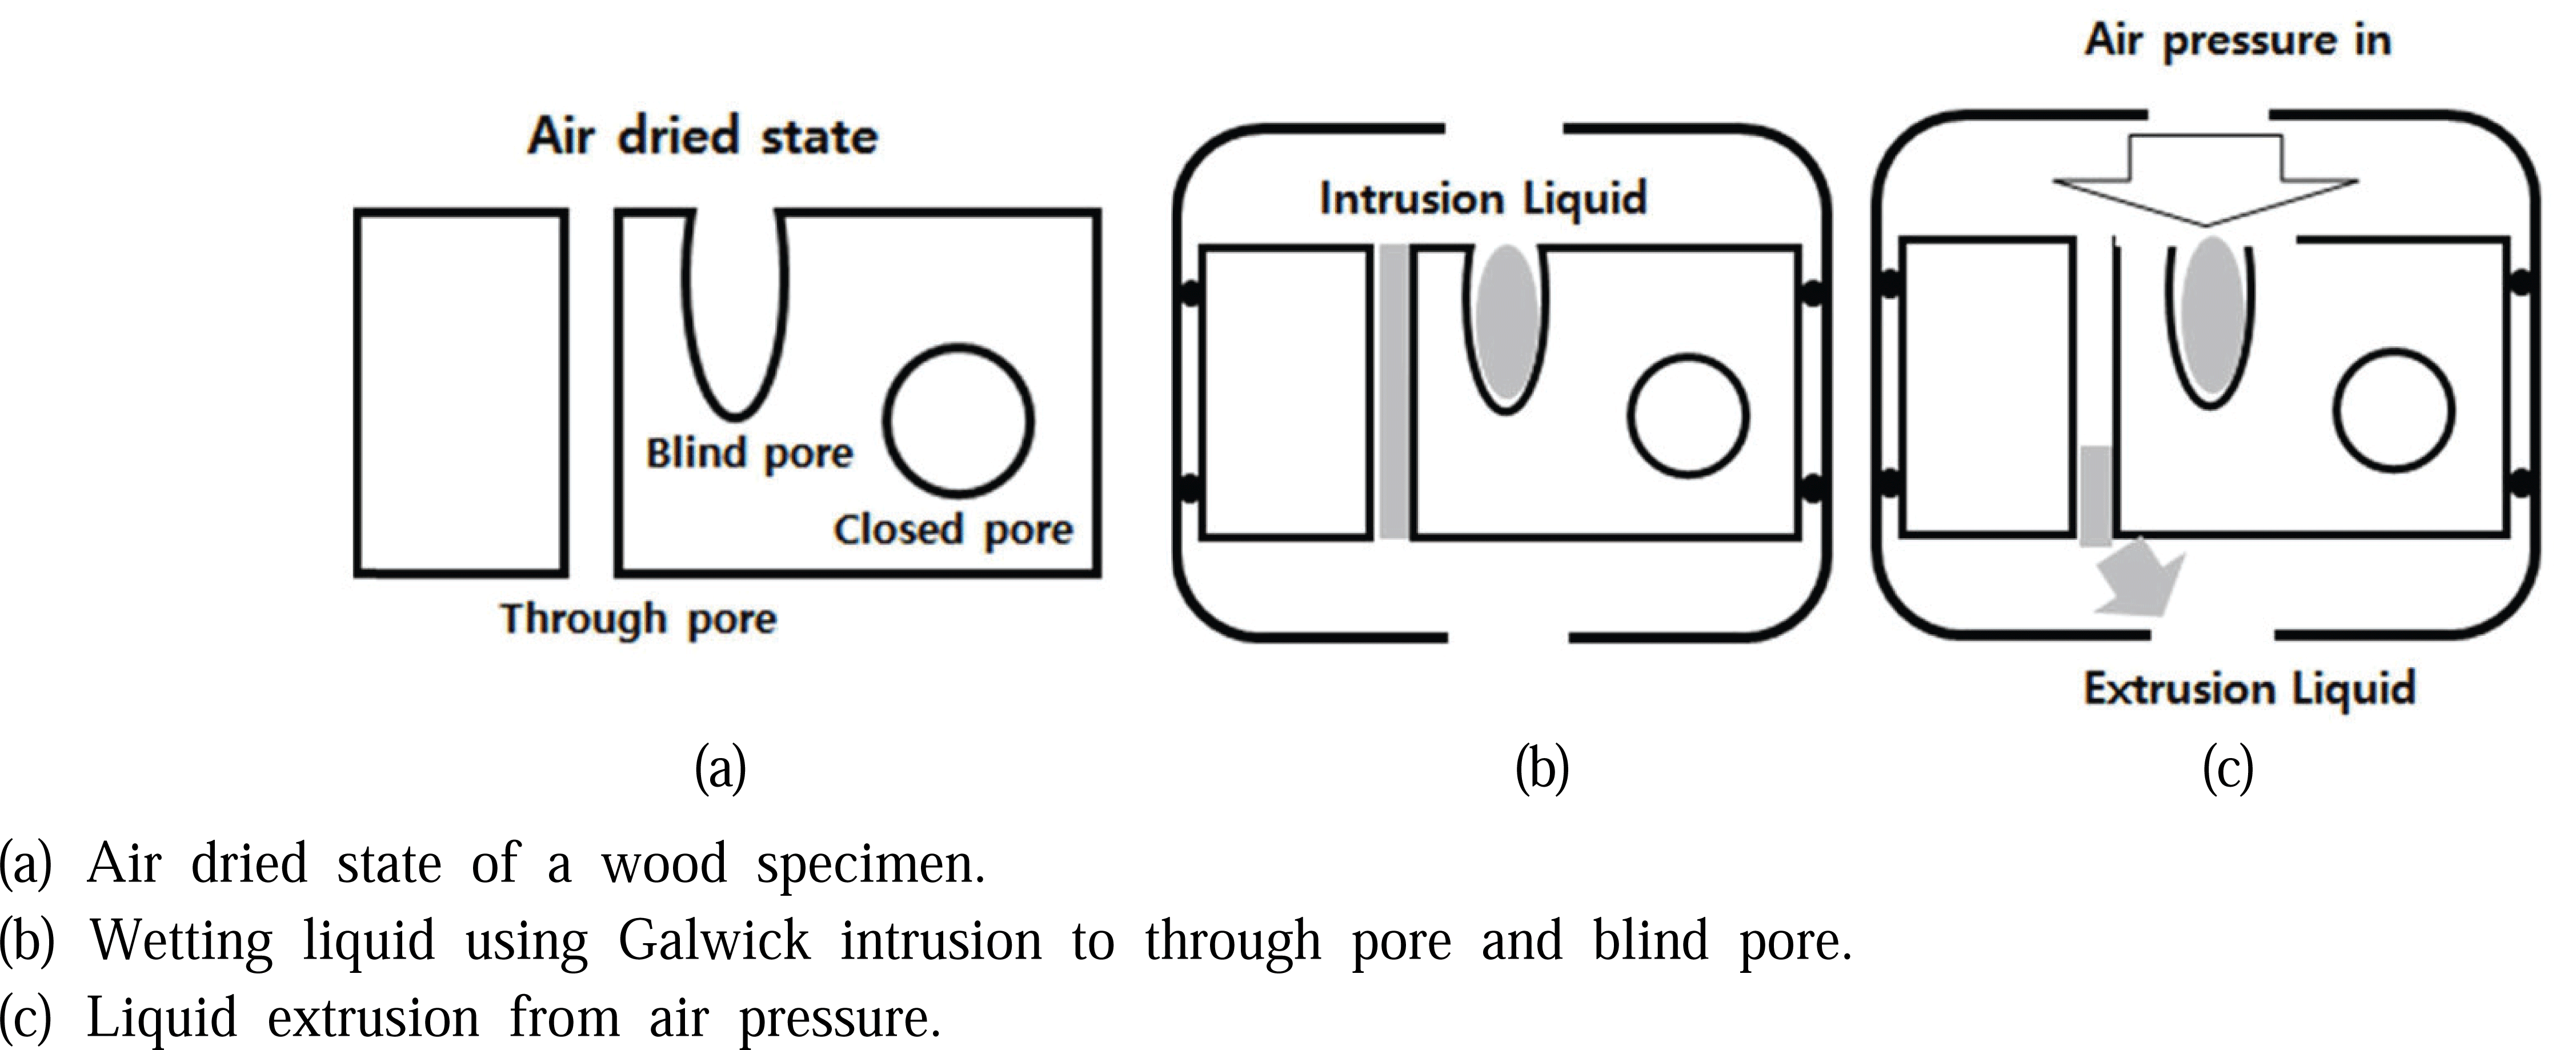
The bulk density of cylindrical specimen was measured according to KS F 2198 and the true density of cylindrical specimens and sawdust were measured using the gas displacement principle according to ASTM C604, ASTM D2638, ASTM D4892 and ISO 5106 using a gas pycnometer (PYC-100A-1, Porous Material Inc, USA), displacement gas was Helium with purity of 99.999 %, all of solid porous materials could be separated by three types of pore defined by IUPAC (1972). And measurement of the cylindrical specimens was conducted with a gas pycnometer, gas could not permeate the closed pores inside solid specimens such as tylosis in the vessel or inside cell lumen were measured as real volume of solid wood specimen, thus, the true density calculated from the real volume included closed pore. However, there was almost no probability of existing pores inside the sawdust under 200 mesh in this experiment, the true density calculated from the real volume of sawdust represented the true density. The principle of measurement is illustrated in Fig. 2.
According to ISO 5106, actual measured bulk volume and the true volume measured by gas pycnometer, porosity can be calculated as follows:
If the true density of sawdust is measured using a gas pycnometer, there is no closed pore inside the sawdust, so the above formula can be applied. But in case of cylindrical wood specimen, the closed pore is included in the measured true volume as if the closed pore volume is a part of true wood substance, so the calculated porosity is an under estimated value because closed pore assumed as true volume.
Therefore, in this study, the porosity determined from bulk volume and true volume of wood specimens measured using a gas pycnometer is defined as through & blind pore porosity and can be expressed as follows.
The closed pore porosity is proposed as follows.
In order to distinguish through pore porosity (%) and blind pore porosity (%), we propose the following. (Fig. 3)
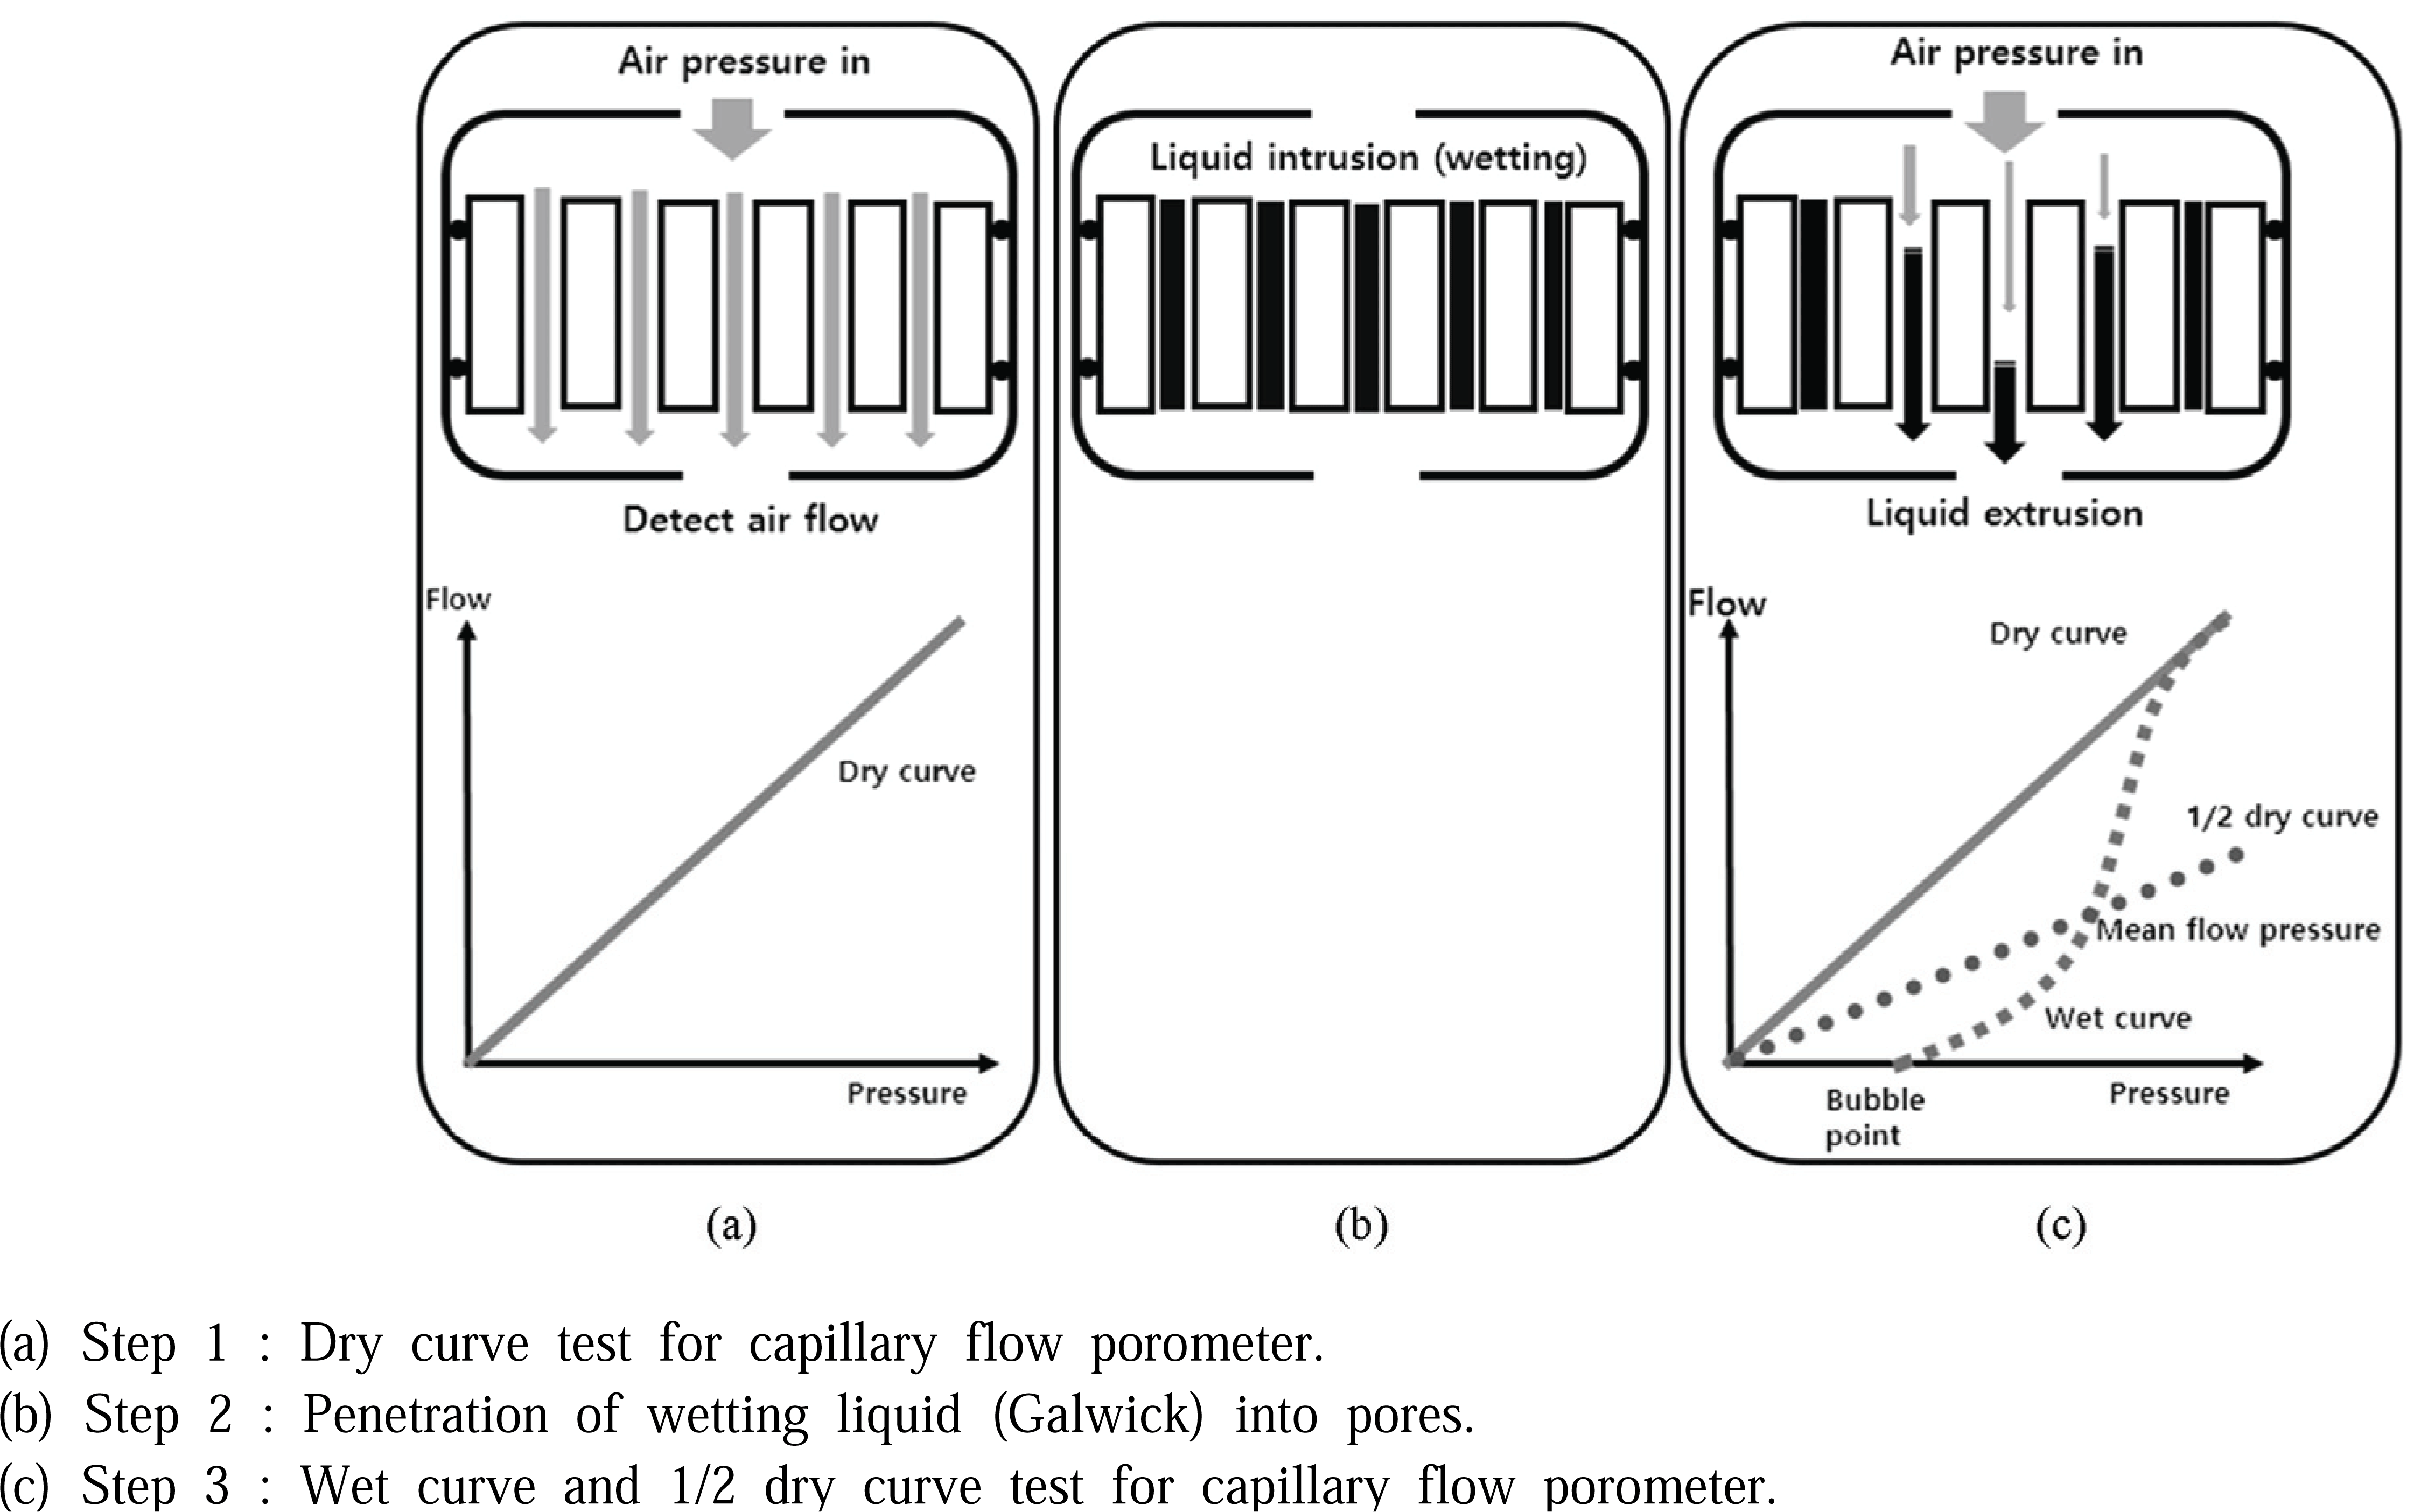
The wood specimens were immersed in a solution of Galwick in a beaker, and put into a vacuum chamber, at this point, the liquid was allowed to flow inside through pore and blind pore. Completely penetrated specimens were put in chamber, the air induced to cross-sectional surface from top end to butt end direction, the side faces of the specimens were sealed, the pressure of air was gradually increased. As the pressure being increasing, wetted liquid had been slowly extruded until the diameter of through pore reached about 0.07 um when the pressure was increased to 100 psi according to Washburn's equation, however, the liquid inside blind pore was not extruded due to closed one end of blind pore. The liquid weight of impregnated blind pores was calculated by the weight of the specimens after pressing subtracting the weight of initial specimens, through known liquid density, blind pore volume could be obtained, and the values of the blind pore porosity (%) and through pore porosity (%) could also be obtained, respectively.
Thus, through pore porosity (%), blind pore porosity (%), closed pore porosity (%) could be obtained.
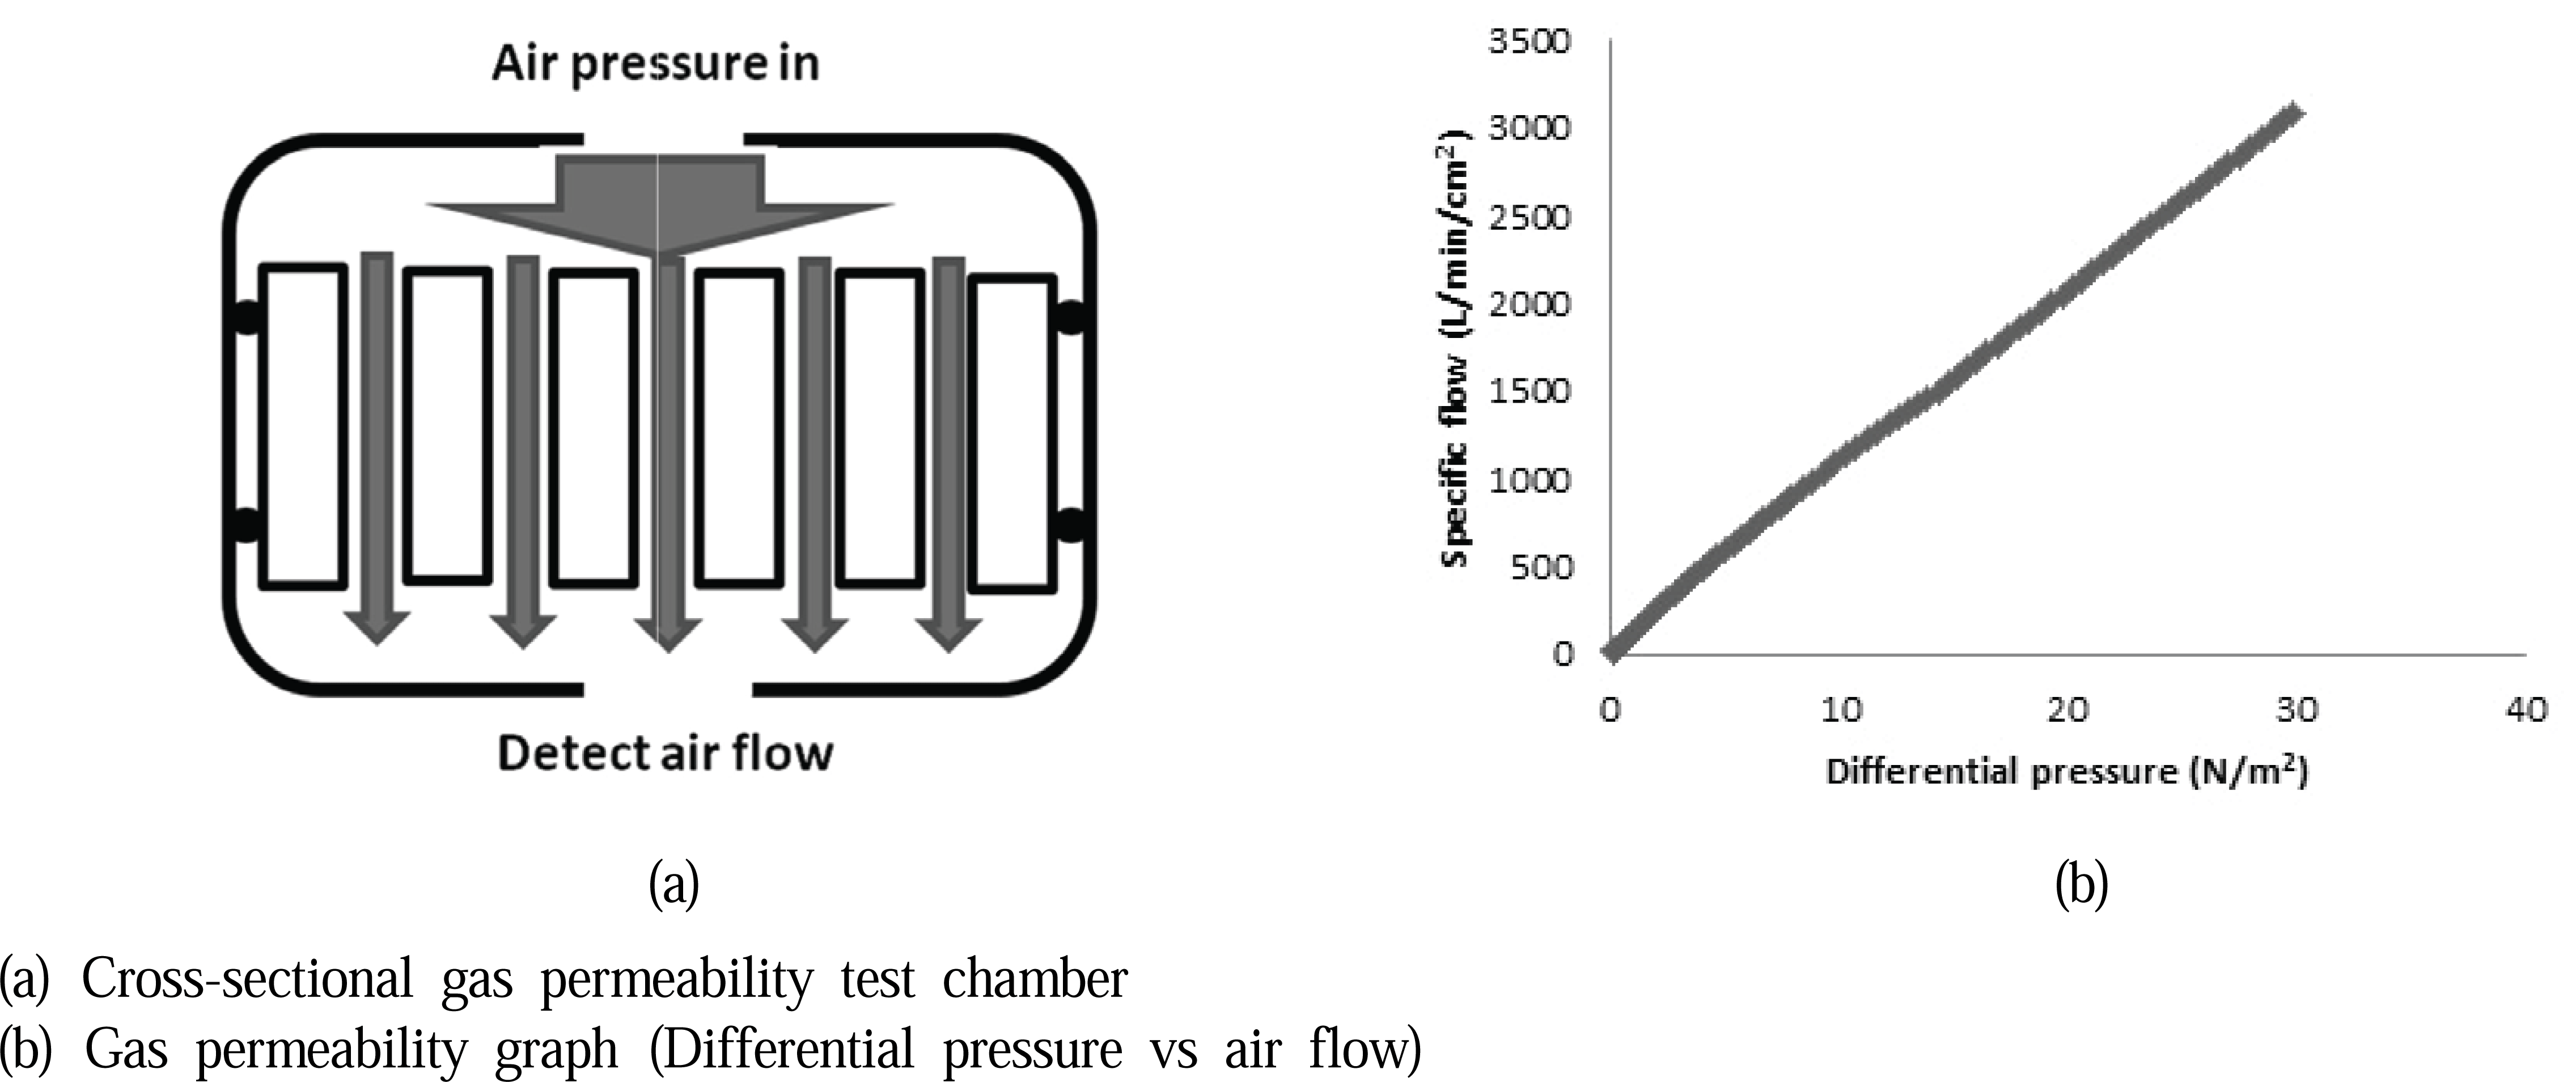
Gas permeability was measured using a capillary flow porometer (Model: CFP-1200AEL, Porous Material Inc, USA) in this study, and the principle of measurement is illustrated in Fig. 4. After the side of the specimen installed in chamber was sealed with an O-ring, the specimen was vertically pressed and the flow was measured as the pressure being increased, and was converted to the Darcy permeability constant, at last calculated as following:
where,
V = Linear flow rate (m/s)
k = the permeability of a medium (m2)
μ= Viscosity of the fluid (N·s/m2)
p = Pressure (N/m2)
x = Displacement in the direction of flow (m)
Pore size in this study was measured using a capillary flow porometer, which is a method based on ASTM F316-03 (2011). This equipment can select only through pores and can measure their permeability. First, after the side of the specimen installed in chamber was sealed with an O-ring, the specimen was vertically pressed and the flow was measured as the pressure being increased, the measured graph between flow and pressure was called ‘dry curve’. Second, the specimen after measurement of dry curve was taken out and impregnated with Galwick solution (Surface tension : 15.9 N/m).
Galwick penetrates into the spontaneous pore because the surface tension is very low. And the flow change through the specimen was measured as the pressure being increased. The contact angle between liquid and specimen was supposed as zero, thus, pore diameter D was calculated as following according to the Washburn’s equation (Washburn, 1921).
where,
D : Diameter of pore for assuming the pore to be cylindrical (cm)
p : Differential pressure (N/m2)
γ : Surface tension for mercury (N/m)
θ : Contact angle of mercury (°)
The pressure at which the wetting liquid begins to be extruded is called bubble point, from this pressure maximum pore size was obtained. After that, the graph of flow change and increasing pressure was called a ‘wet curve’. Dry curve on which a fictional line of slop of 1/2 was drawn and is called ‘1/2 dry curve’, the point where the 1/2 dry curve meet the wet curve is called ‘mean flow pressure’ and from this pressure mean flow pore diameter was obtained. These three steps for capillary flow porometry is illustrated in Fig. 5.
3. RESULTS and DISCUSSION
The results of each five specimens of heartwood, intermediate wood and softwood are shown in Table 1.
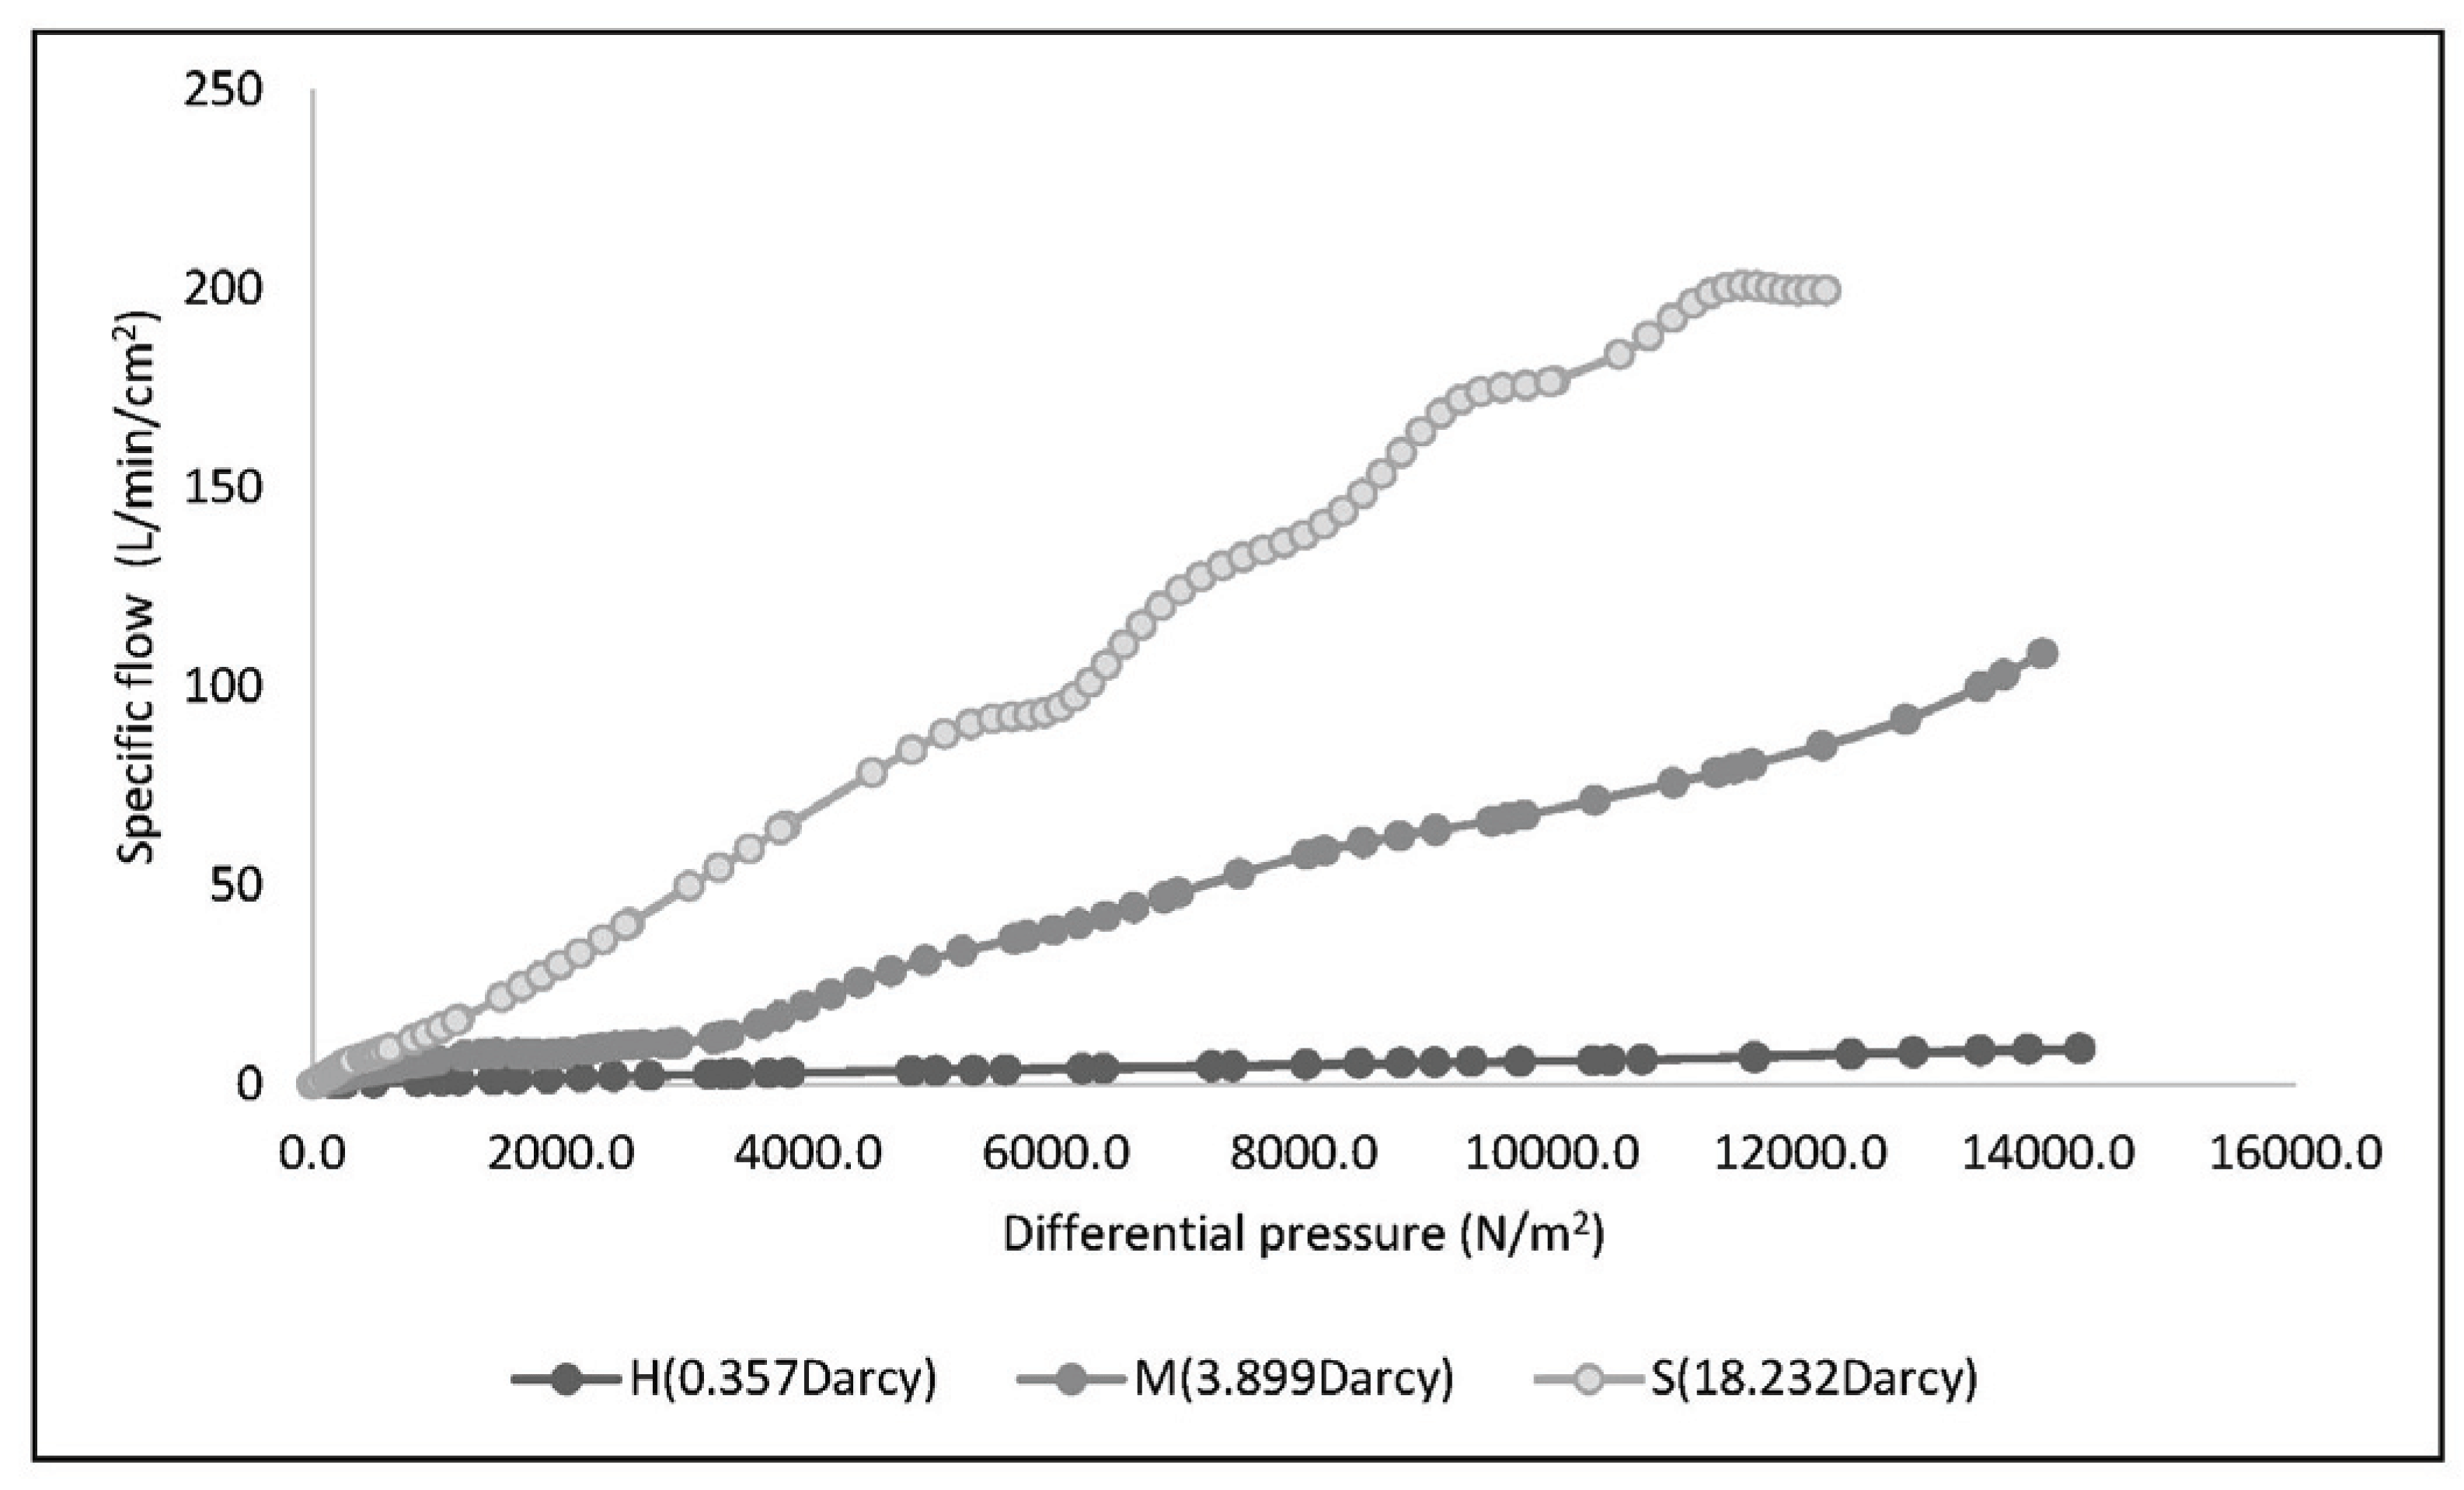
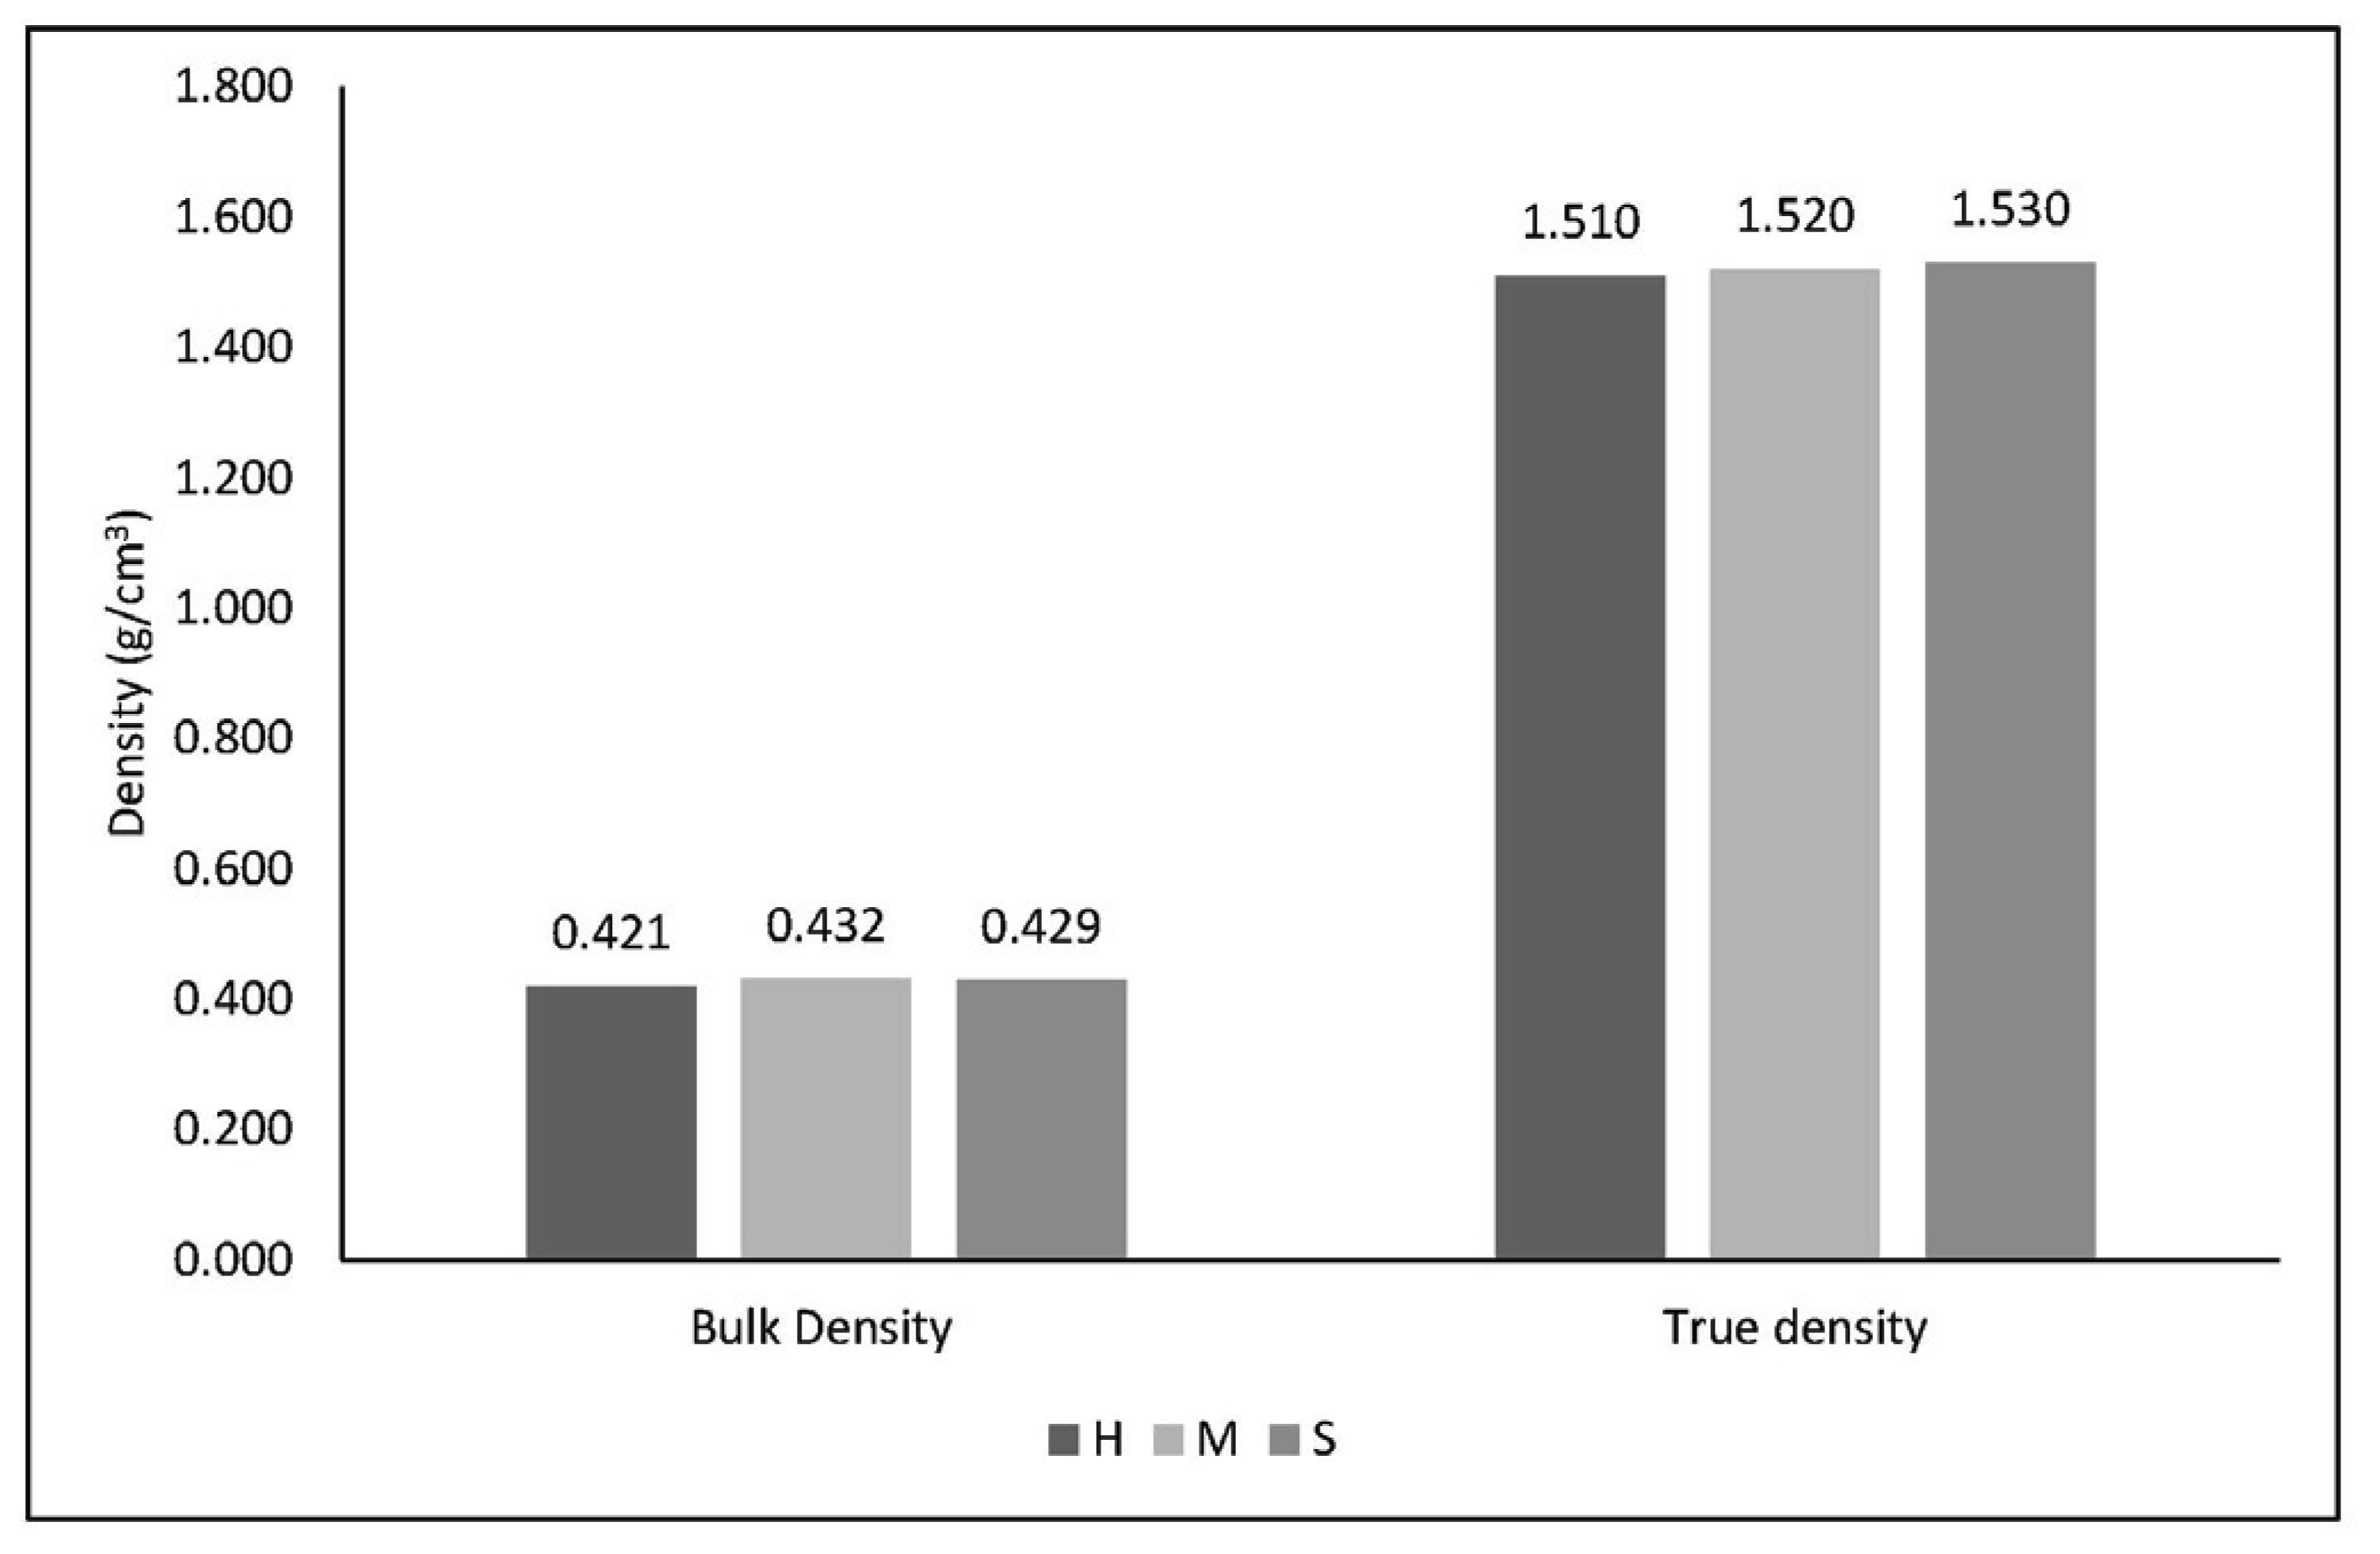
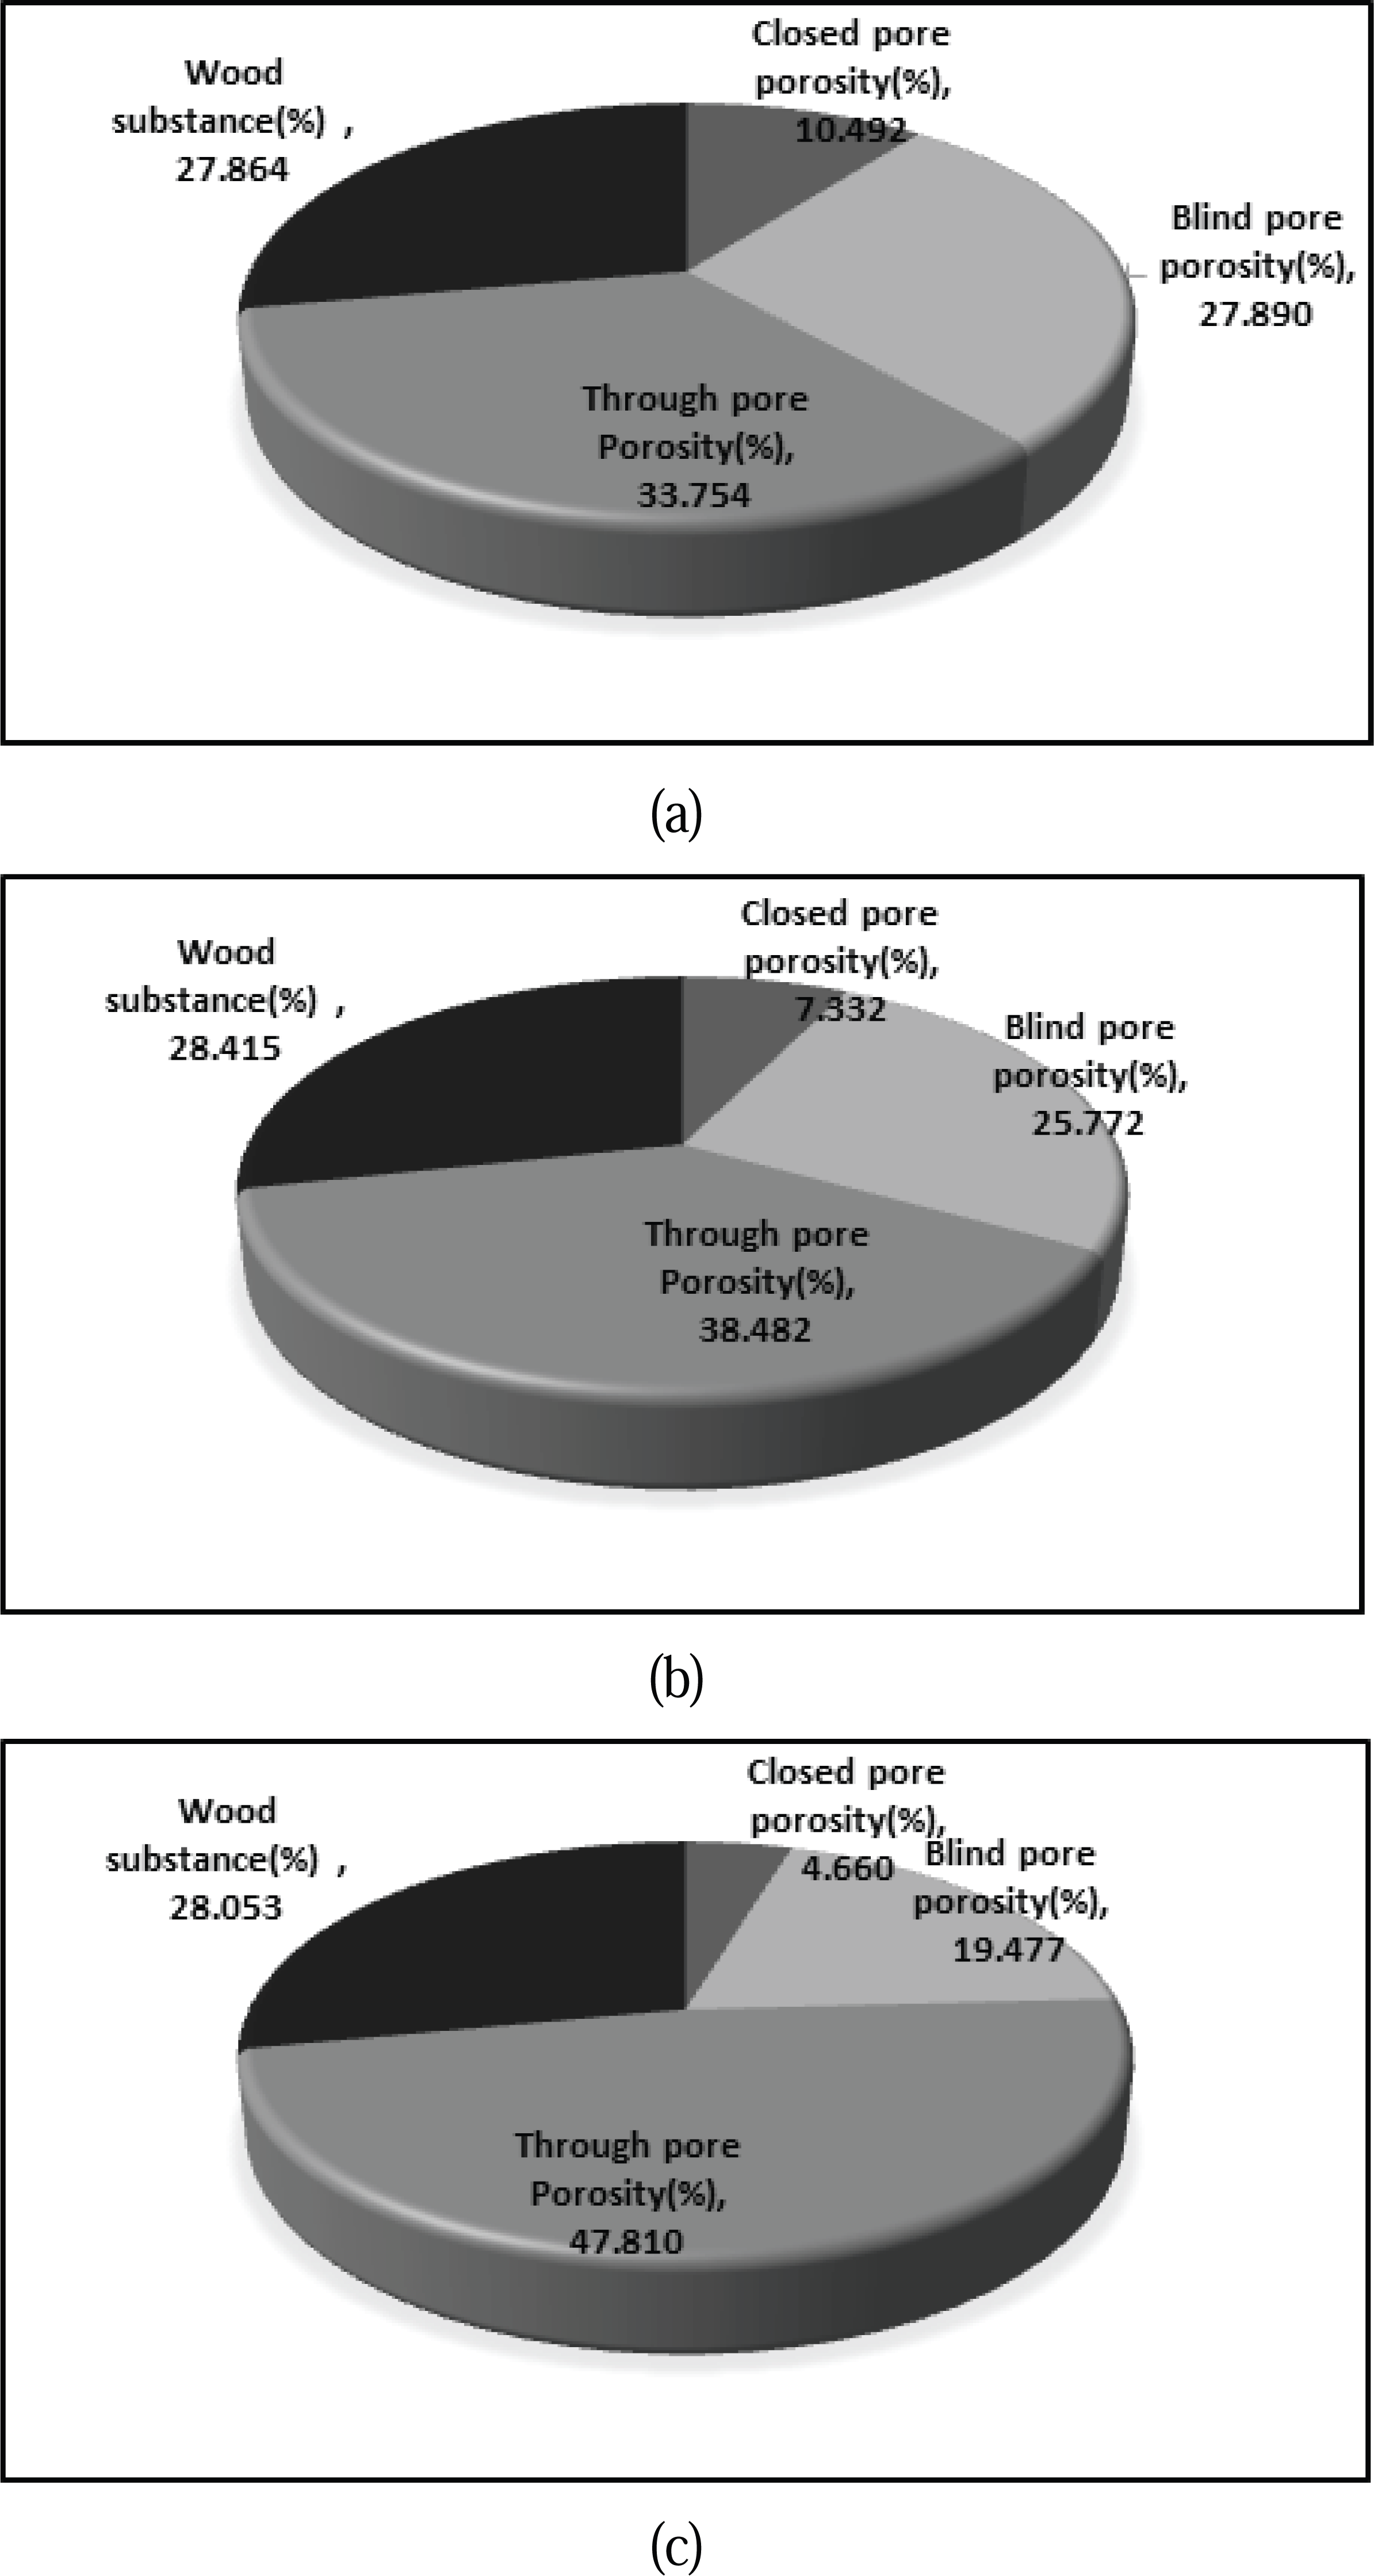
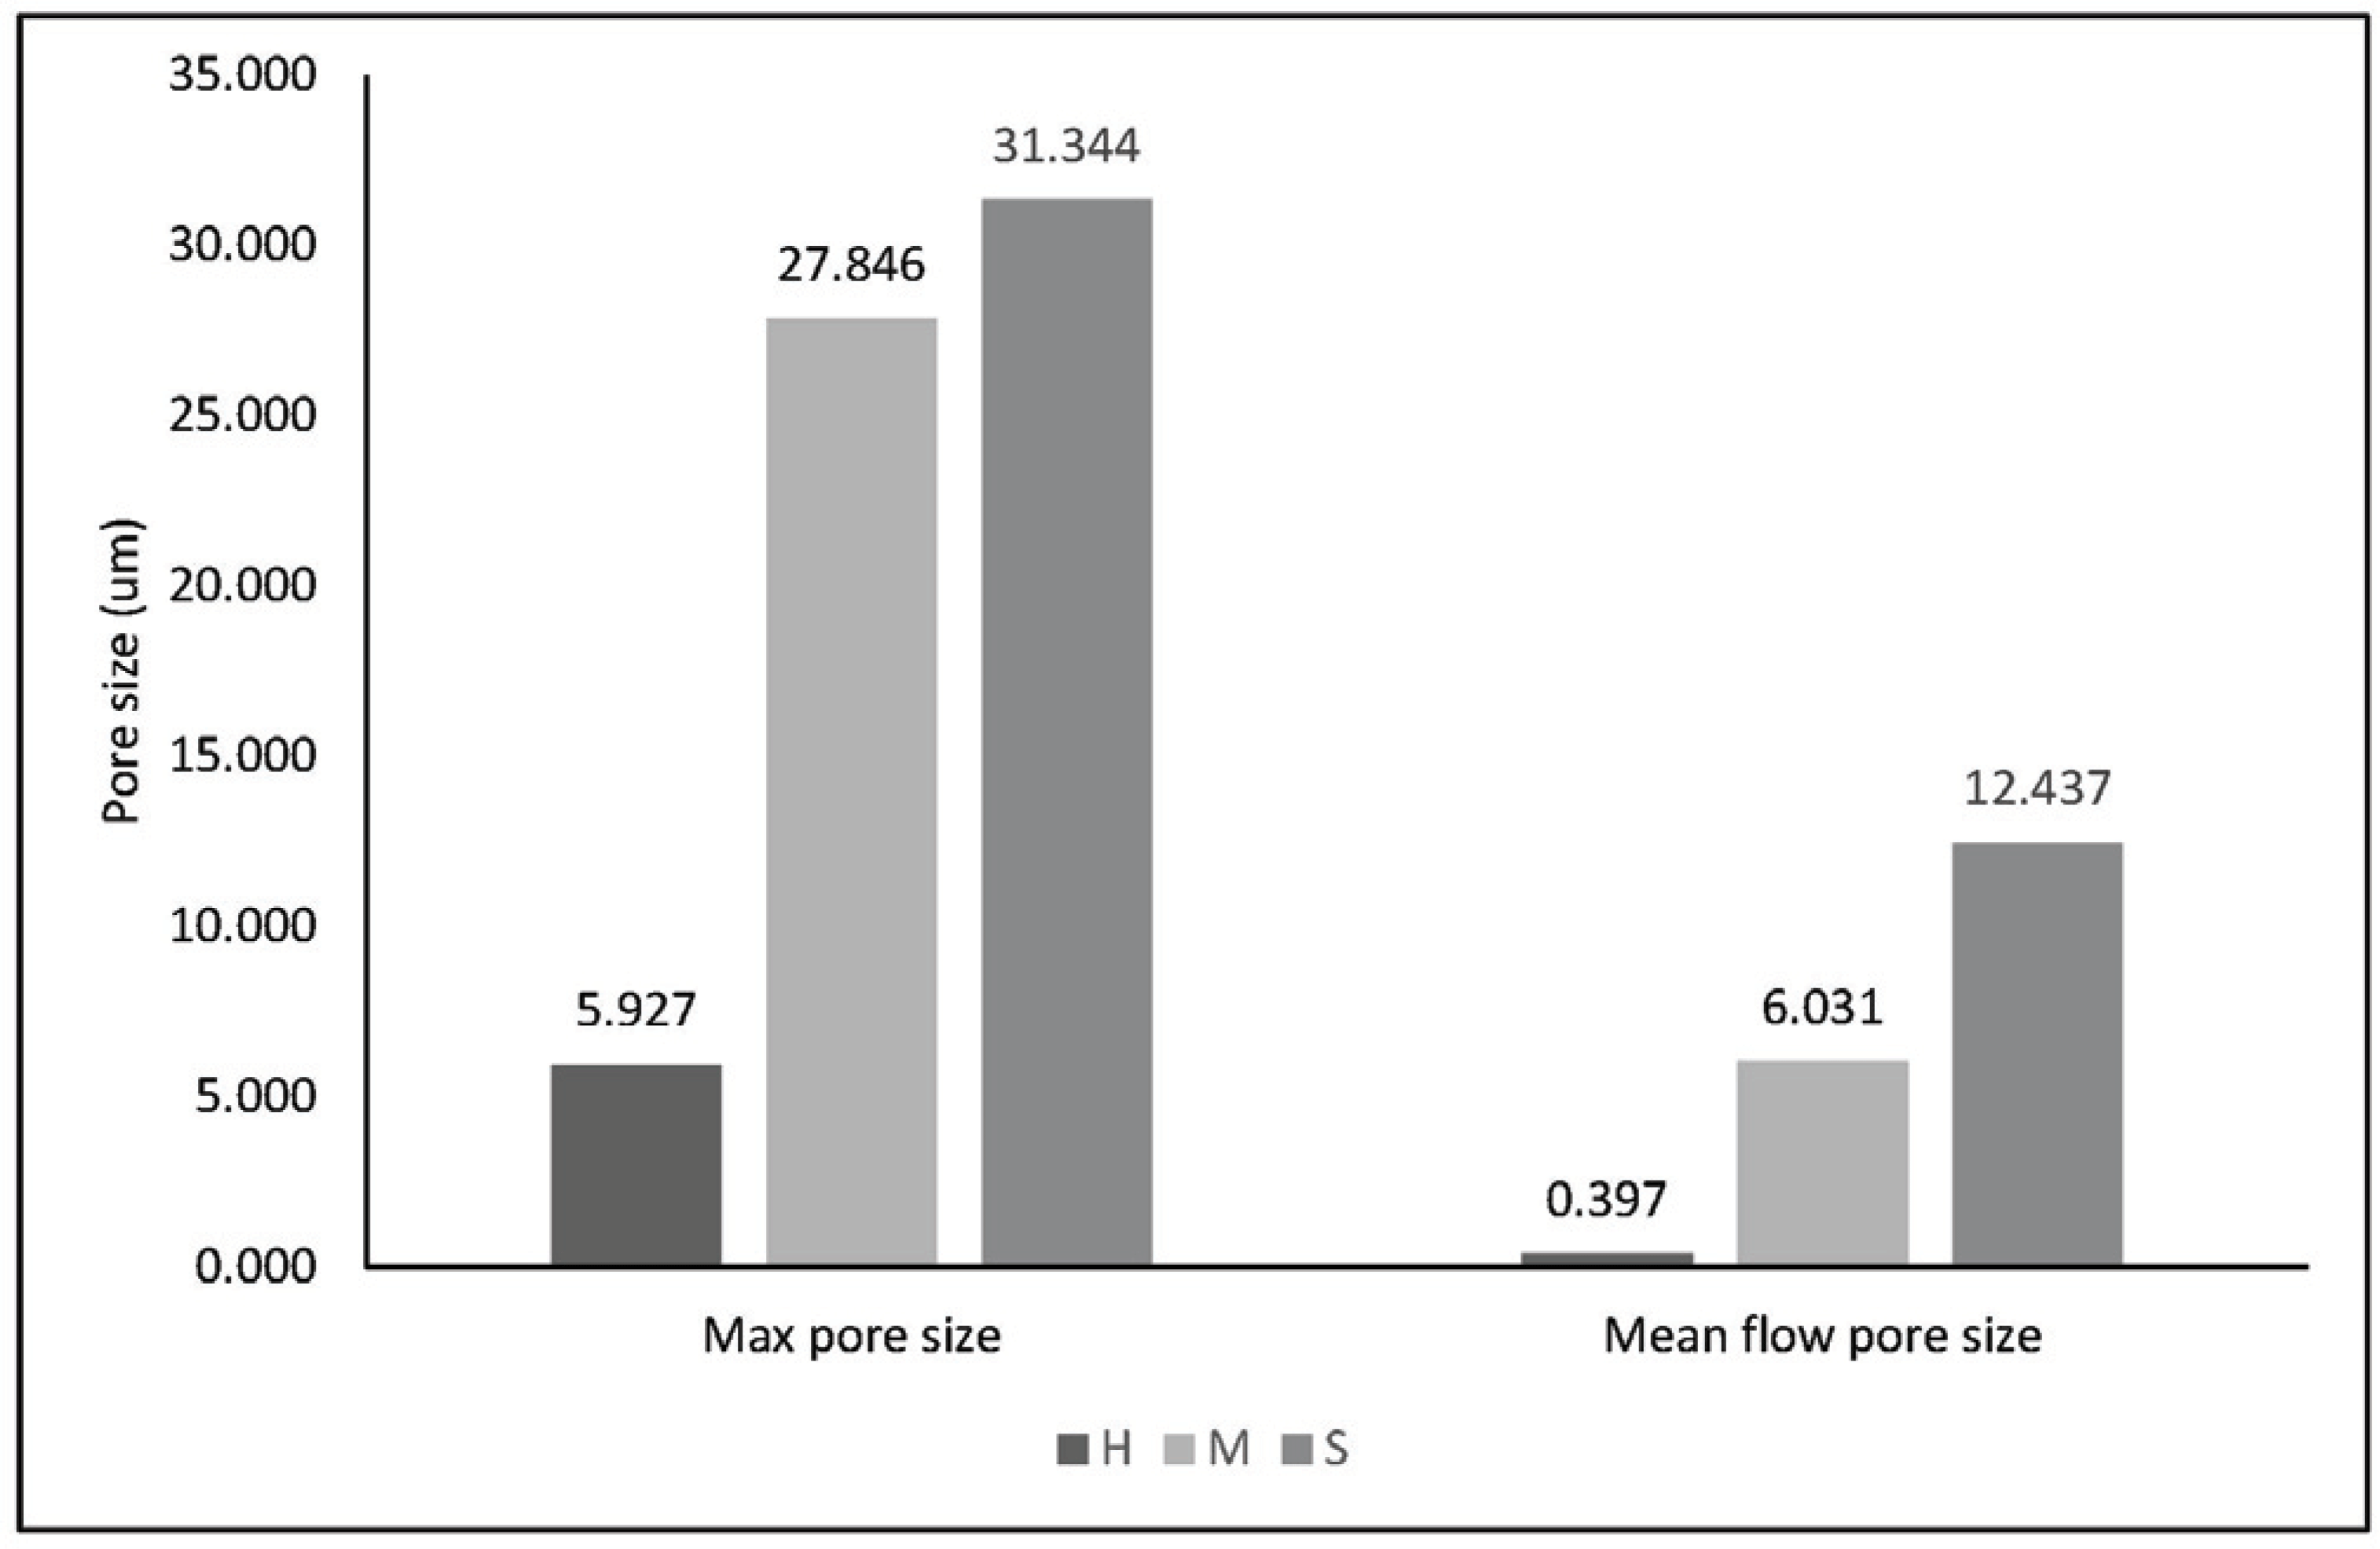
SEM observation resultsare shown in Fig. 6, the results are shown in Fig. 7, Fig. 8, Fig. 9 and Fig. 10. Correlations among total porosity, through pore size, max pore size, mean flow pore size and gas permeability are shown in Fig. 11.
The anatomical features of pore structure in sapwood and heartwood of specimens is shown in Fig. 6.
There were no tylosis in sapwood, while several tylosis were found in the heartwood. The vessel diameter of the heartwood and sapwood were similar.
The average flows versus pressure increase of heartwood, intermediate wood and sapwood measured by capillary flow porometer are shown in Fig. 7. The higher the pressure gradient, the greater the permeability. Converting this to Darcy permeability constant was 0.357 Darcy for heartwood, 3.899 Darcy for intermediate wood, and 18.232 Darcy for sapwood, which indicates that permeability of specimen was prominently increased from pith to bark.
Permeability of sapwood was greater than that of heartwood in the yellow poplar, it was similar to the results of previous studies (Stamm, 1931; Fogg and Choong, 1969; Chen and Tang, 1991; Hur and Kang, 1997).
The morphological characteristics of heartwood and sapwood pore were not significantly different, whereas Darcy permeability was 10.9 times different. From these results, it is considered that the morphology observation using SEM is very limited for analyzing the pore structure of wood, since SEM can only observe pores on the surface of wood and could not see the internal path. So it is impossible to predict the permeability of cross-sectional surface of wood by morphological observation.
As shown Fig. 8, bulk density of heartwood was 0.421 g/cm3, intermediate wood was 0.432 g/cm3 and softwood was 0.429 g/cm3, True density of heartwood was 1.510 g/cm3, intermediate wood was 1.520 g/cm3 and softwood was 1.530 g/cm3.
Bulk density and true density of specimens presented a trend of increase from sapwood to heartwood.
The reason for the a little higher bulk density in intermediate wood is not clear, it seems to be the experimental error.
Total porosity of specimen in this study was about 72 % and showed a decrease in trend from heartwood to sapwood, however, its difference in heartwood and sapwood was 0.26 %. Through pore porosity of specimen was 33.754 % for heartwood, 38.482 % for intermediate wood, and 47.810 % for sapwood, which indicates that through pore porosity was increased from heartwood to sapwood. Blind pore porosity of specimen was 27.890 % for heartwood, 25.772 % for intermediate wood, and 19.447 % for sapwood, which indicates that the blind pore porosity was decreased from heartwood to sapwood. Closed pore porosity of specimen was 10.492 % for heartwood, 7.332 % for intermediate wood, and 4.660 % for sapwood, which indicates that closed pore porosity was decreased from heartwood to sapwood (Fig. 9).
In the case of heartwood on the hardwoods, as water conduction of the vessel element decreases with the tree growth, the thin wall of the vessel element was deformed by adjacent longitudinal parenchyma cell or radial parenchyma cell, the vessel element is fully closed. This is generally called ‘tylosis’ and the tylosis is usually observed in the vessel element of the heartwood. Therefore, although the difference in porosity between heartwood and sapwood is only about 0.26 %, there is a considerable variance in the mixing ratio of three kinds of pores. The heartwood has a larger amount of blind pores and closed pores than sapwood, while the sapwood has a larger amount of through pores than heartwood.
Max pore size and mean flow pore size of specimens were increased from heartwood to sapwood (Fig. 10). In previous studies, Stamm (1931) measured bubble point and reported that the pore size of sapwood was larger than that of heartwood. This study shows that the mean flow pore diameter and the bubble point (max pore size) of sapwood are bigger than that of heartwood.
The pore sizes estimated by capillary flow porometry increases from heartwood to sapwood. This is explained by the vessel elements without tylosis that can be measured easily as air permeates through pores. Porosity of vessel element which are completely closed by tylosis could not be measured and that of tylosis formation is in progress could be measured as narrowed pore. Therefore, the through pore porosity varies with the progress of tylosis and the gas permeability of sapwood which have no tylosis is greater than heartwood.
The correlation between the gas permeability and the bulk density, total porosity, through pore porosity, max pore size, and mean flow pore size in the heartwood, intermediate wood and sapwood of the cross section of the yellow poplar were analyzed as shown in Fig. 11.
As a result of this study, bulk density and total porosity were not related to gas permeability. Because fluid flow occurs only in through pores, the capillary flow porometer could only distinguish through pores. Therefore other types of pores were not considered.
On the other hand, through pore porosity refers to the porosity which the fluid passes, which is related to gas permeability. capillary flow porometer can selectively measure only thorough pores. Therefore, through pore factors such as pore sizes, max pore and mean flow pore size are highly correlated to gas permeability.
4. CONCLUSION
The pore structure in heartwood, intermediate wood and sapwood of Yellow poplar was classified into through pore, blind pore and closed pore by IUPAC, the content of each pore structure was determined in this study. The results of this study were as following:
The SEM can be used to observe the pore surface of the wood cross section, but is limited to predicting the permeability or pore size of the wood.
Darcy permeability was 10.9 times different in heartwood and sapwood of Yellow poplar.
Total porosity of specimen was about 72 % and there are slight difference in heartwood and sapwood.
The content of through pore porosity was 33.754 % for heartwood and 47.810 % for sapwood, showed an increasing trend from pith to bark, however, blind pore porosity and closed pore porosity were 27.890 % and 19.492 % for heartwood and 19.447 % and 4.660 % for sapwood, showed the decreasing trend from pith to bark.
Max pore size of specimens increased about 5 times from 5.927 μm to 31.334 μm, and mean flow pore size increased by about 315 times from 0.397 μm to 12.437 μm from pith to bark. It is considered that the permeability could be increased because the content of through pore and the size of through pore were increased.
It was found that the gas permeability is rarely related to the total porosity and bulk density while, the gas permeability is highly correlated to through pore porosity, max pore size, and mean flow pore size.
In this study, gas permeability, pore size and structure of Yellow poplar wood were studied. In order to get a better understanding of the pore characteristics of wood as a porous material, it will be necessary to further investigate the changes in the wood void structure due to physical or chemical changes of wood.


