1. INTRODUCTION
Lumber is used in various applications, such as structure, furniture, and packaging that require good physical properties. The species is an important factor in lumber’s performance. Thus, it is traded at different prices for each species. Lumber species identification is an important process for ensuring market reliability. However, traditional species identification methods, such as anatomical analysis or DNA analysis, are not easily applicable. Both approaches, which are promising in lumber species identification, inevitably require cutting and processing specimens into a suitable form for examination. The test procedures take a long time and cost. In addition, skilled experts are essential to analyze lumber species but they are a few in Korea. In field, visual species identification is preferred but it is based on subjective judgments of inspector and is applicable only limited species. To overcome the above-mentioned problems, alternative species identification techniques, such as machine vision (Hermanson and Wiedenhoeft, 2011; Hafemann et al., 2014; Kwon et al., 2017) and near-infrared (NIR) spectroscopy (Adedipe et al., 2008; Russ et al., 2009; Nisgoski et al., 2017; Park et al., 2017), have been reported. This study applies simple and non-destructive species classification based on NIR spectroscopy.
NIR spectroscopy is a type of analytical method that characterizes the chemical composition of a material. NIR rays are electromagnetic waves of wavelength range from 780 nm to 2,500 nm that have a sufficient energy level to vibrate molecular functional groups. The advantages of NIR spectroscopy are its non-destructive testing and rapid measurement capabilities (Blanco, 2002; Pasquini, 2003; Porep et al., 2015). In wood science, NIR application has been widely studied to determine the wood’s physical properties (Schimleck and Evans, 2003; Jiang et al., 2006; Yang et al., 2017), chemical aspects (Alves et al., 2006; Watanabe et al., 2006; Üner et al., 2011; Cho et al., 2016), mechanical strength (Thumm and Meder, 2001; Zhao et al., 2009; Hovarth et al., 2011), and moisture content (Thygesen and Lundqvist, 2000; Eom et al., 2010; Chang et al., 2015; Yang et al., 2015). In this context, some classification studies using NIR spectroscopy have recently been reported because chemical composition varies by species. However, there are few reports of the lumber classification among domestic species (Hwang et al., 2015).
This study examines NIR spectroscopy with soft independent modeling of class analogy (SIMCA) to classify five domestic lumber species. SIMCA (Wold, 1976) is a statistical classification method for supervised pattern recognition and is widely applied in fields, such as chemometrics. NIR spectra acquired from lumbers were used for SIMCA modeling, and the classification reliability of each model was then evaluated.
2. MATERIALS and METHODS
Fifty green lumbers of each species [larch (Larix kaempferi), red pine (Pinus densiflora), Korean pine (Pinus koraiensis), cedar (Cryptomeria japonica), and cypress (Chamaecyparis obtusa)], of dimensions 50 × 100 × 600 mm (thickness × width × length, R or T × L direction), were collected from several National Forestry Cooperative Federations located throughout Korea (Table 1). These five species accounted for the majority of the log supplied to the domestic lumber production industry. Each sample was air-dried at 25°C and 65 ± 10% relative humidity for 3 months. After air drying (10-15% moisture content), lumbers were planed (2 mm thickness) for NIR measurement.
| Species | Larch | Red pine | Korean pine | Cedar | Cypress |
|---|---|---|---|---|---|
| Location | |||||
| Yeoju | 10 | 0 | 0 | 0 | 0 |
| Gapyeong | 10 | 20 | 50 | 0 | 0 |
| Donghae | 10 | 10 | 0 | 0 | 0 |
| Naju | 10 | 20 | 0 | 10 | 10 |
| Namwon | 10 | 0 | 0 | 10 | 20 |
| Seogwipo | 0 | 0 | 0 | 30 | 20 |
All NIR absorbance spectra were acquired using a SpectraStar 2600 XT-R spectrometer (Unity Scientific, US). The NIR absorbance spectra were collected at 1 nm intervals over the wavelength range 780 to 2,500 nm from the heartwood on the lumber’s widest face. In total, twelve scans were averaged into a single spectrum. The lumbers were placed on the NIR acquisition window (25 × 40 mm) of the spectrometer and then five spectra were obtained at different points on the same face. After NIR acquisition, a 2 mm thickness was planed, and this process was repeated four times. Thus, the NIR spectra were acquired from 20 different points for each lumber. As a result, 1,000 spectra were acquired for each species.
The SIMCA classification model was developed using The Unscrambler 10.3 (CAMO, Norway) software. The NIR spectral data of each species were randomly divided into a training set (800 spectra) and test set (200 spectra). In SIMCA, a class (species in this study) can be modeled by means of principal components analysis (PCA). As a separate PCA is performed for each training set, information of dataset is extracted by orthogonalizing the variance of data and storing this in the principal components (PCs). The optimal number of PCs for the PCA model was determined when the increment of the total explained variance with added PC was < 1%, to prevent overfitting (Yang et al., 2013).
In the SIMCA classification procedure, every spectrum of the training set was subjected to each optimal PCA model. Then, the residuals of each class-specific PCA model were evaluated to define the distribution of residuals for each class training set, thereby allowing classification of a new sample to one or several available classes (Bylesjö et al., 2006; Fujimoto and Tsuchikawa, 2010). Given this class-specific residual distribution, any spectra in the test set can subsequently be classified with a probability of equal variance compared to the model residuals according to Fisher’s test (F-test). Outliers were detected in the 75% confidence interval of the F-distribution in our study. The results of the F-test of residuals by SIMCA show that there are three possible results of classification (Esbensen et al., 2002); (1) a sample belongs to a class, (2) a sample belongs to several classes, or (3) a sample does not belong to a class. In this study, we defined the second result as multi-classified and the third as unclassified. Classification reliability was evaluated using the test set. For SIMCA modeling, different types of NIR data were used: original spectra, standard normal variate (SNV) preprocessed spectra, and Savitzky– Golay 2nd derivative (window size = 21, polynomial order = 2) preprocessed spectra. This approach was taken because model performance based on NIR spectra could differ by mathematical preprocessing.
3. RESULTS and DISCUSSION
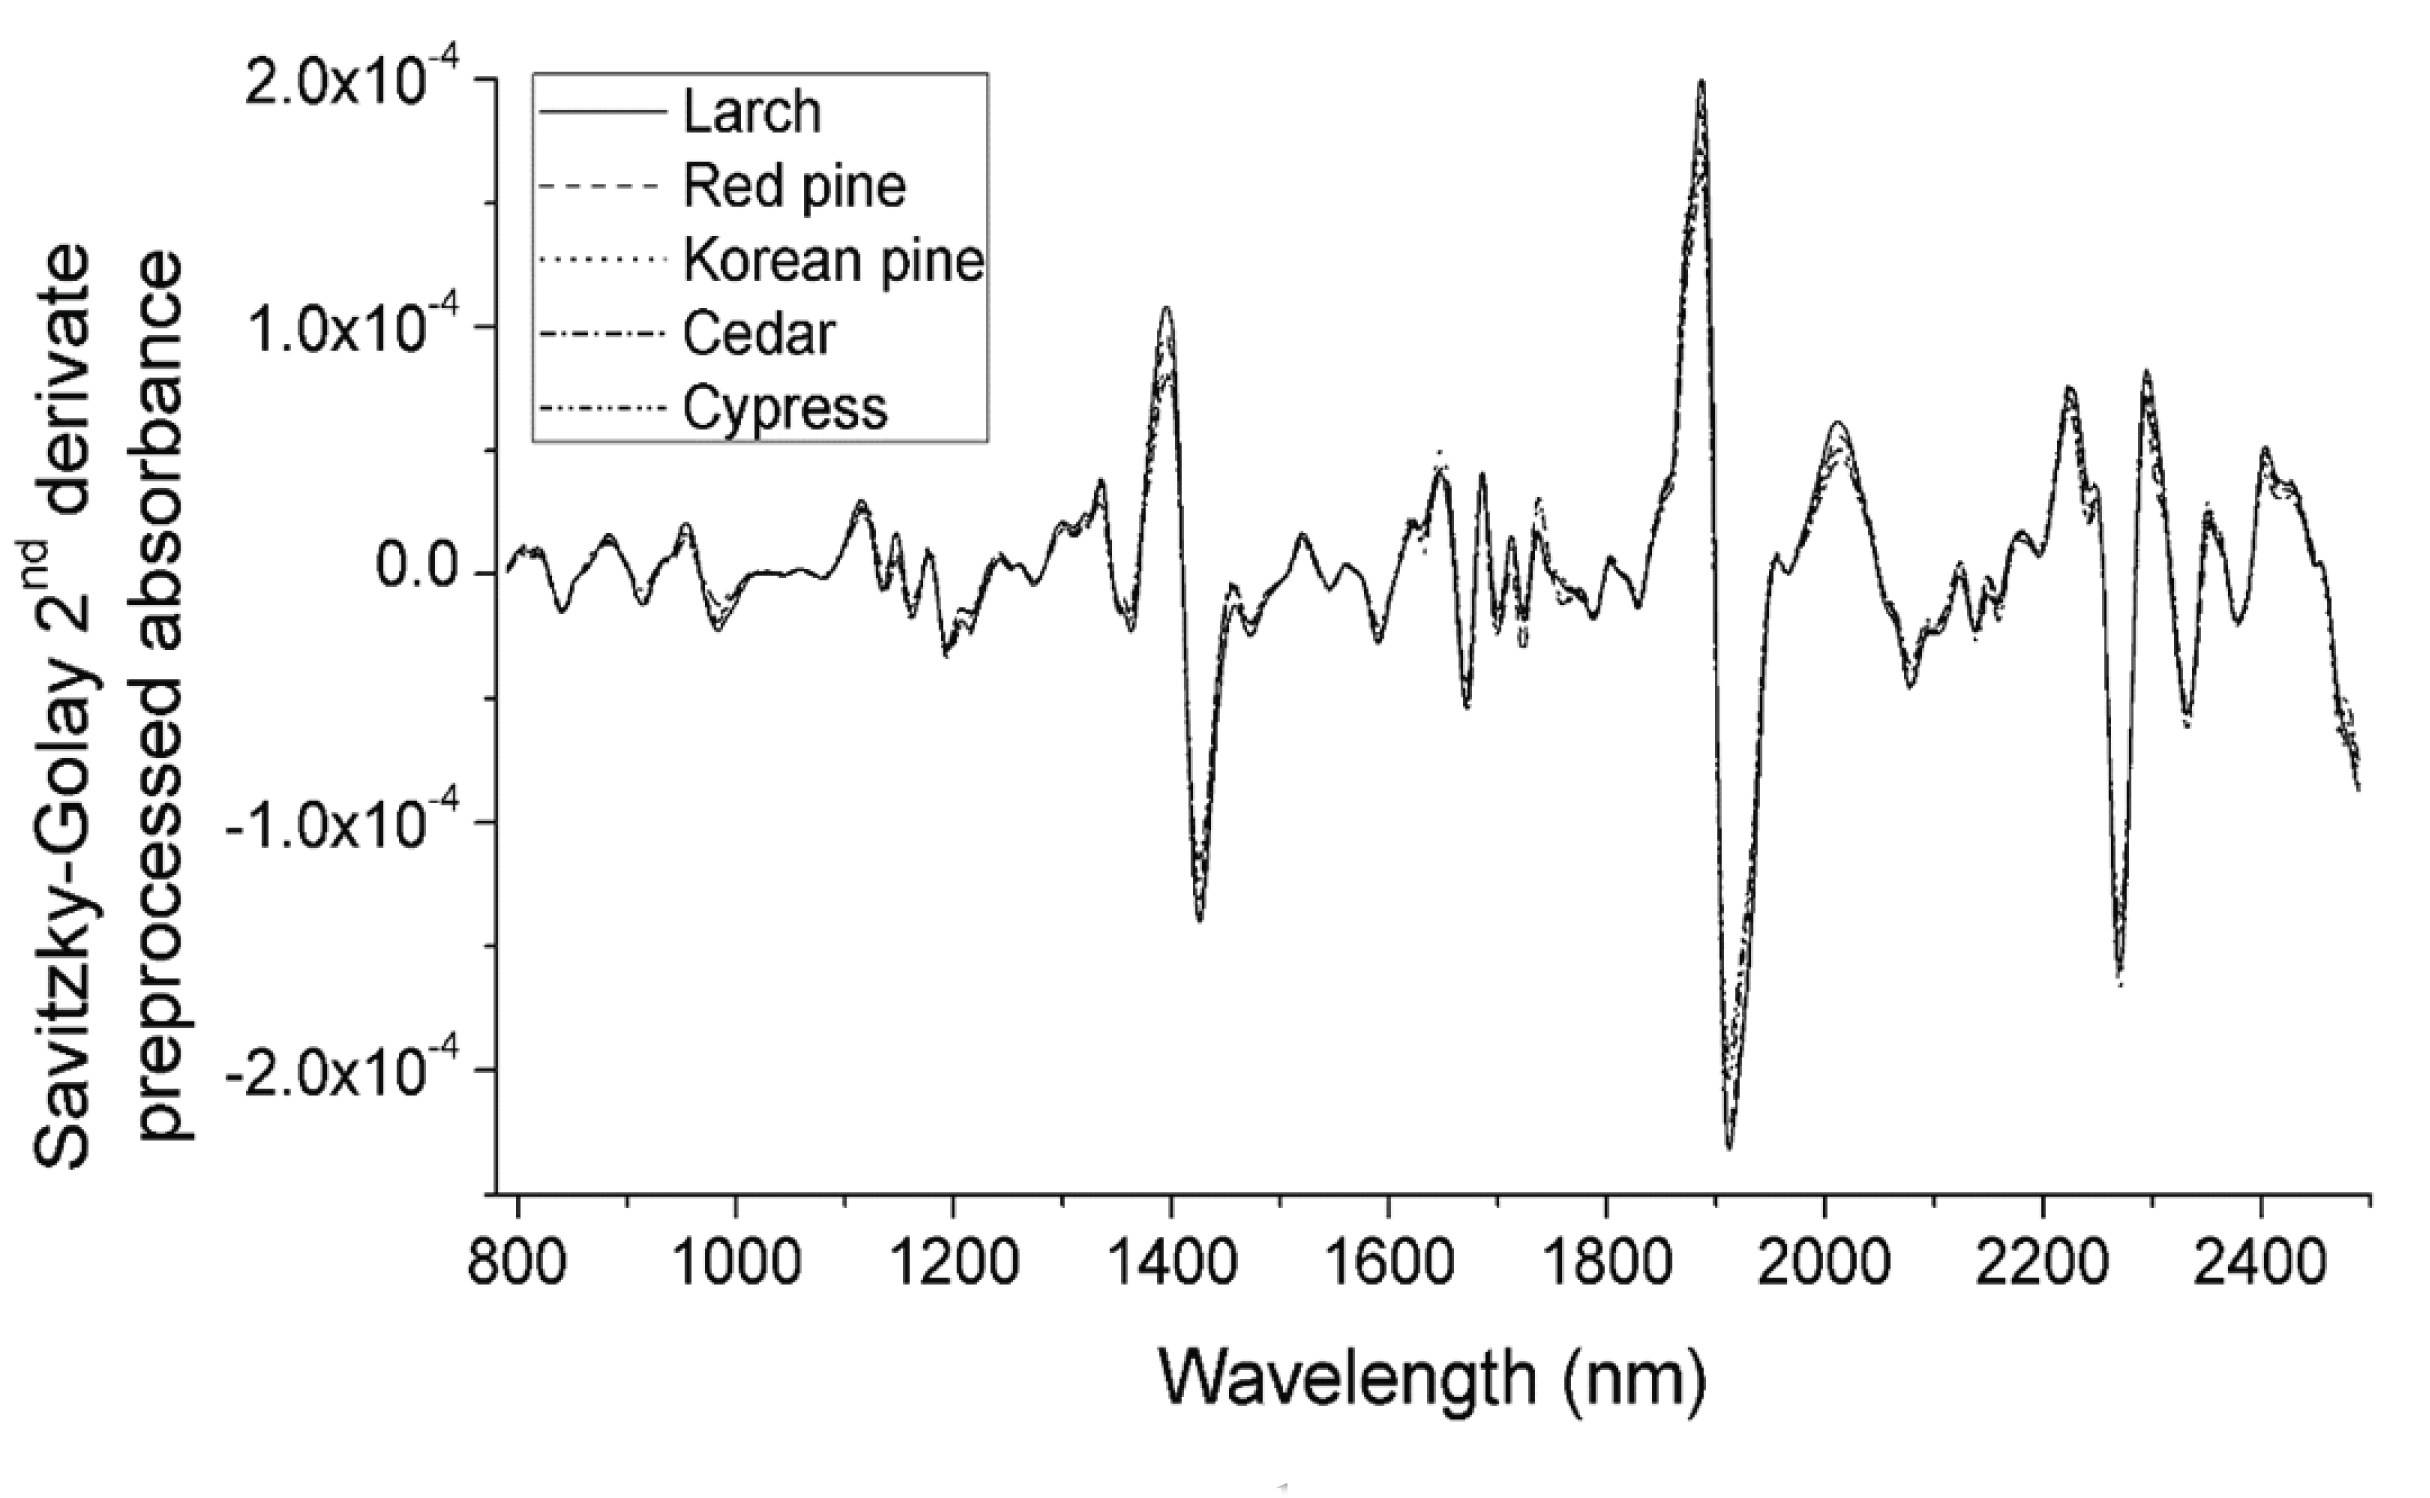
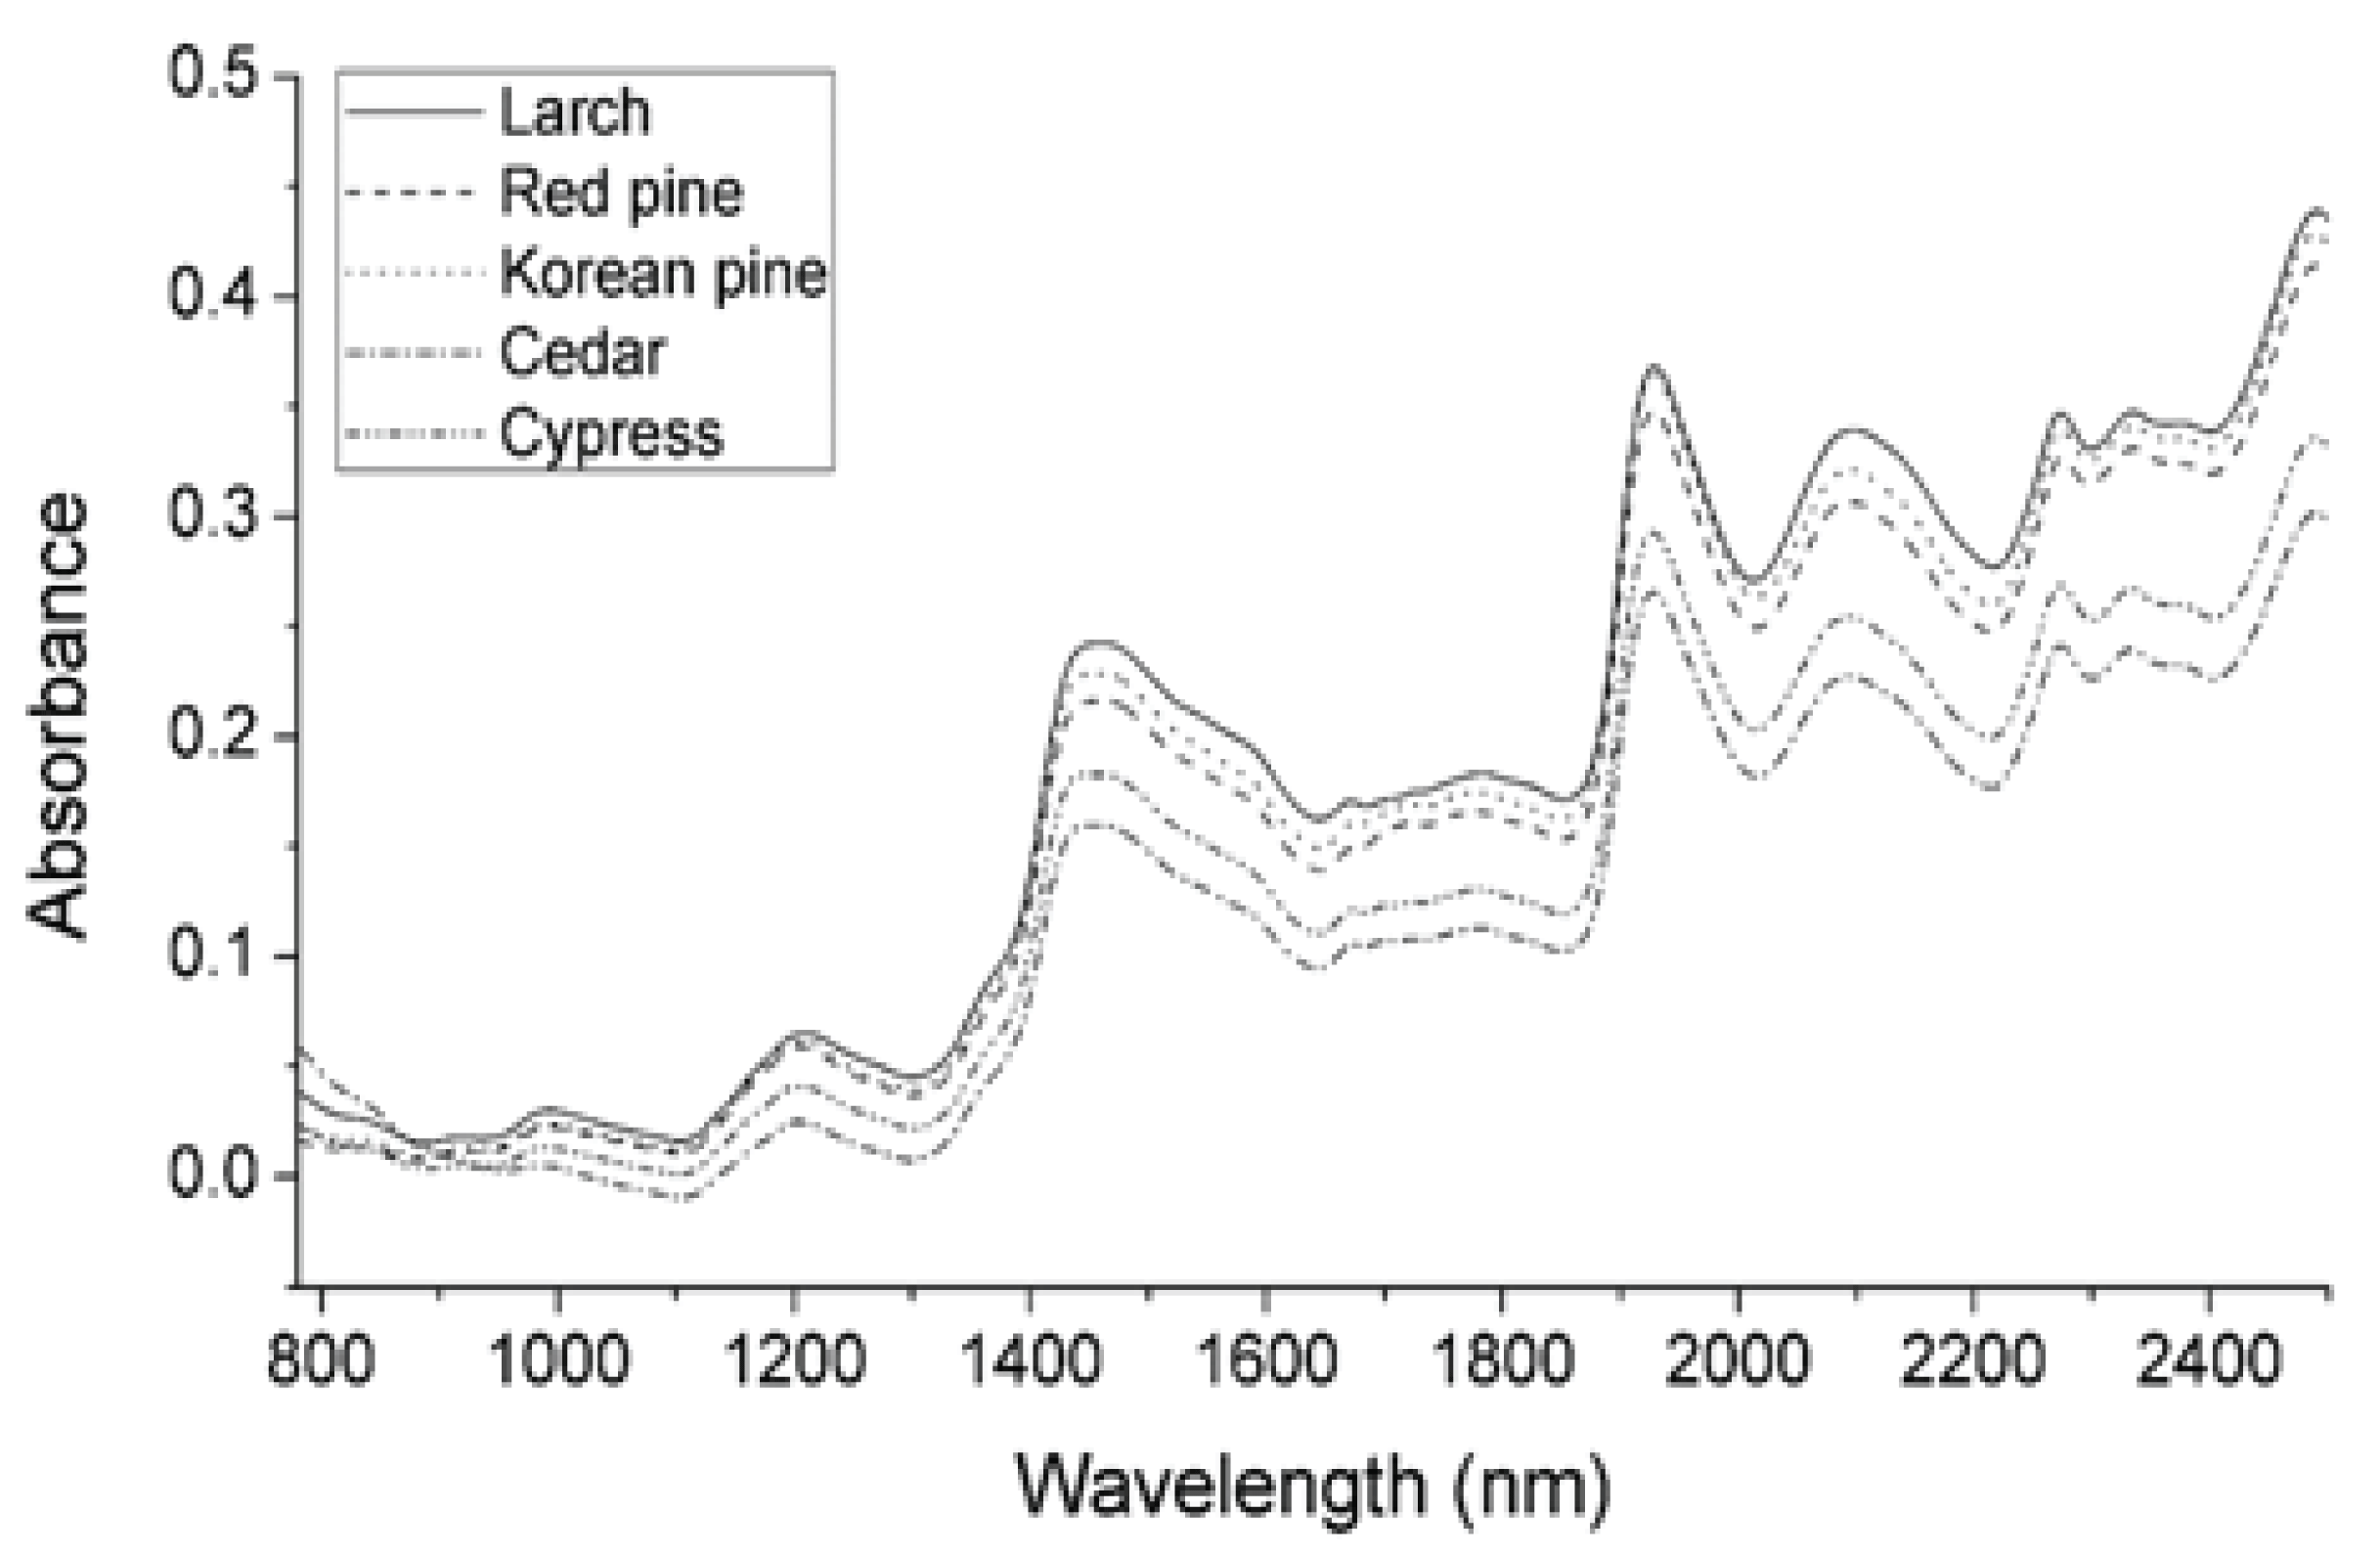
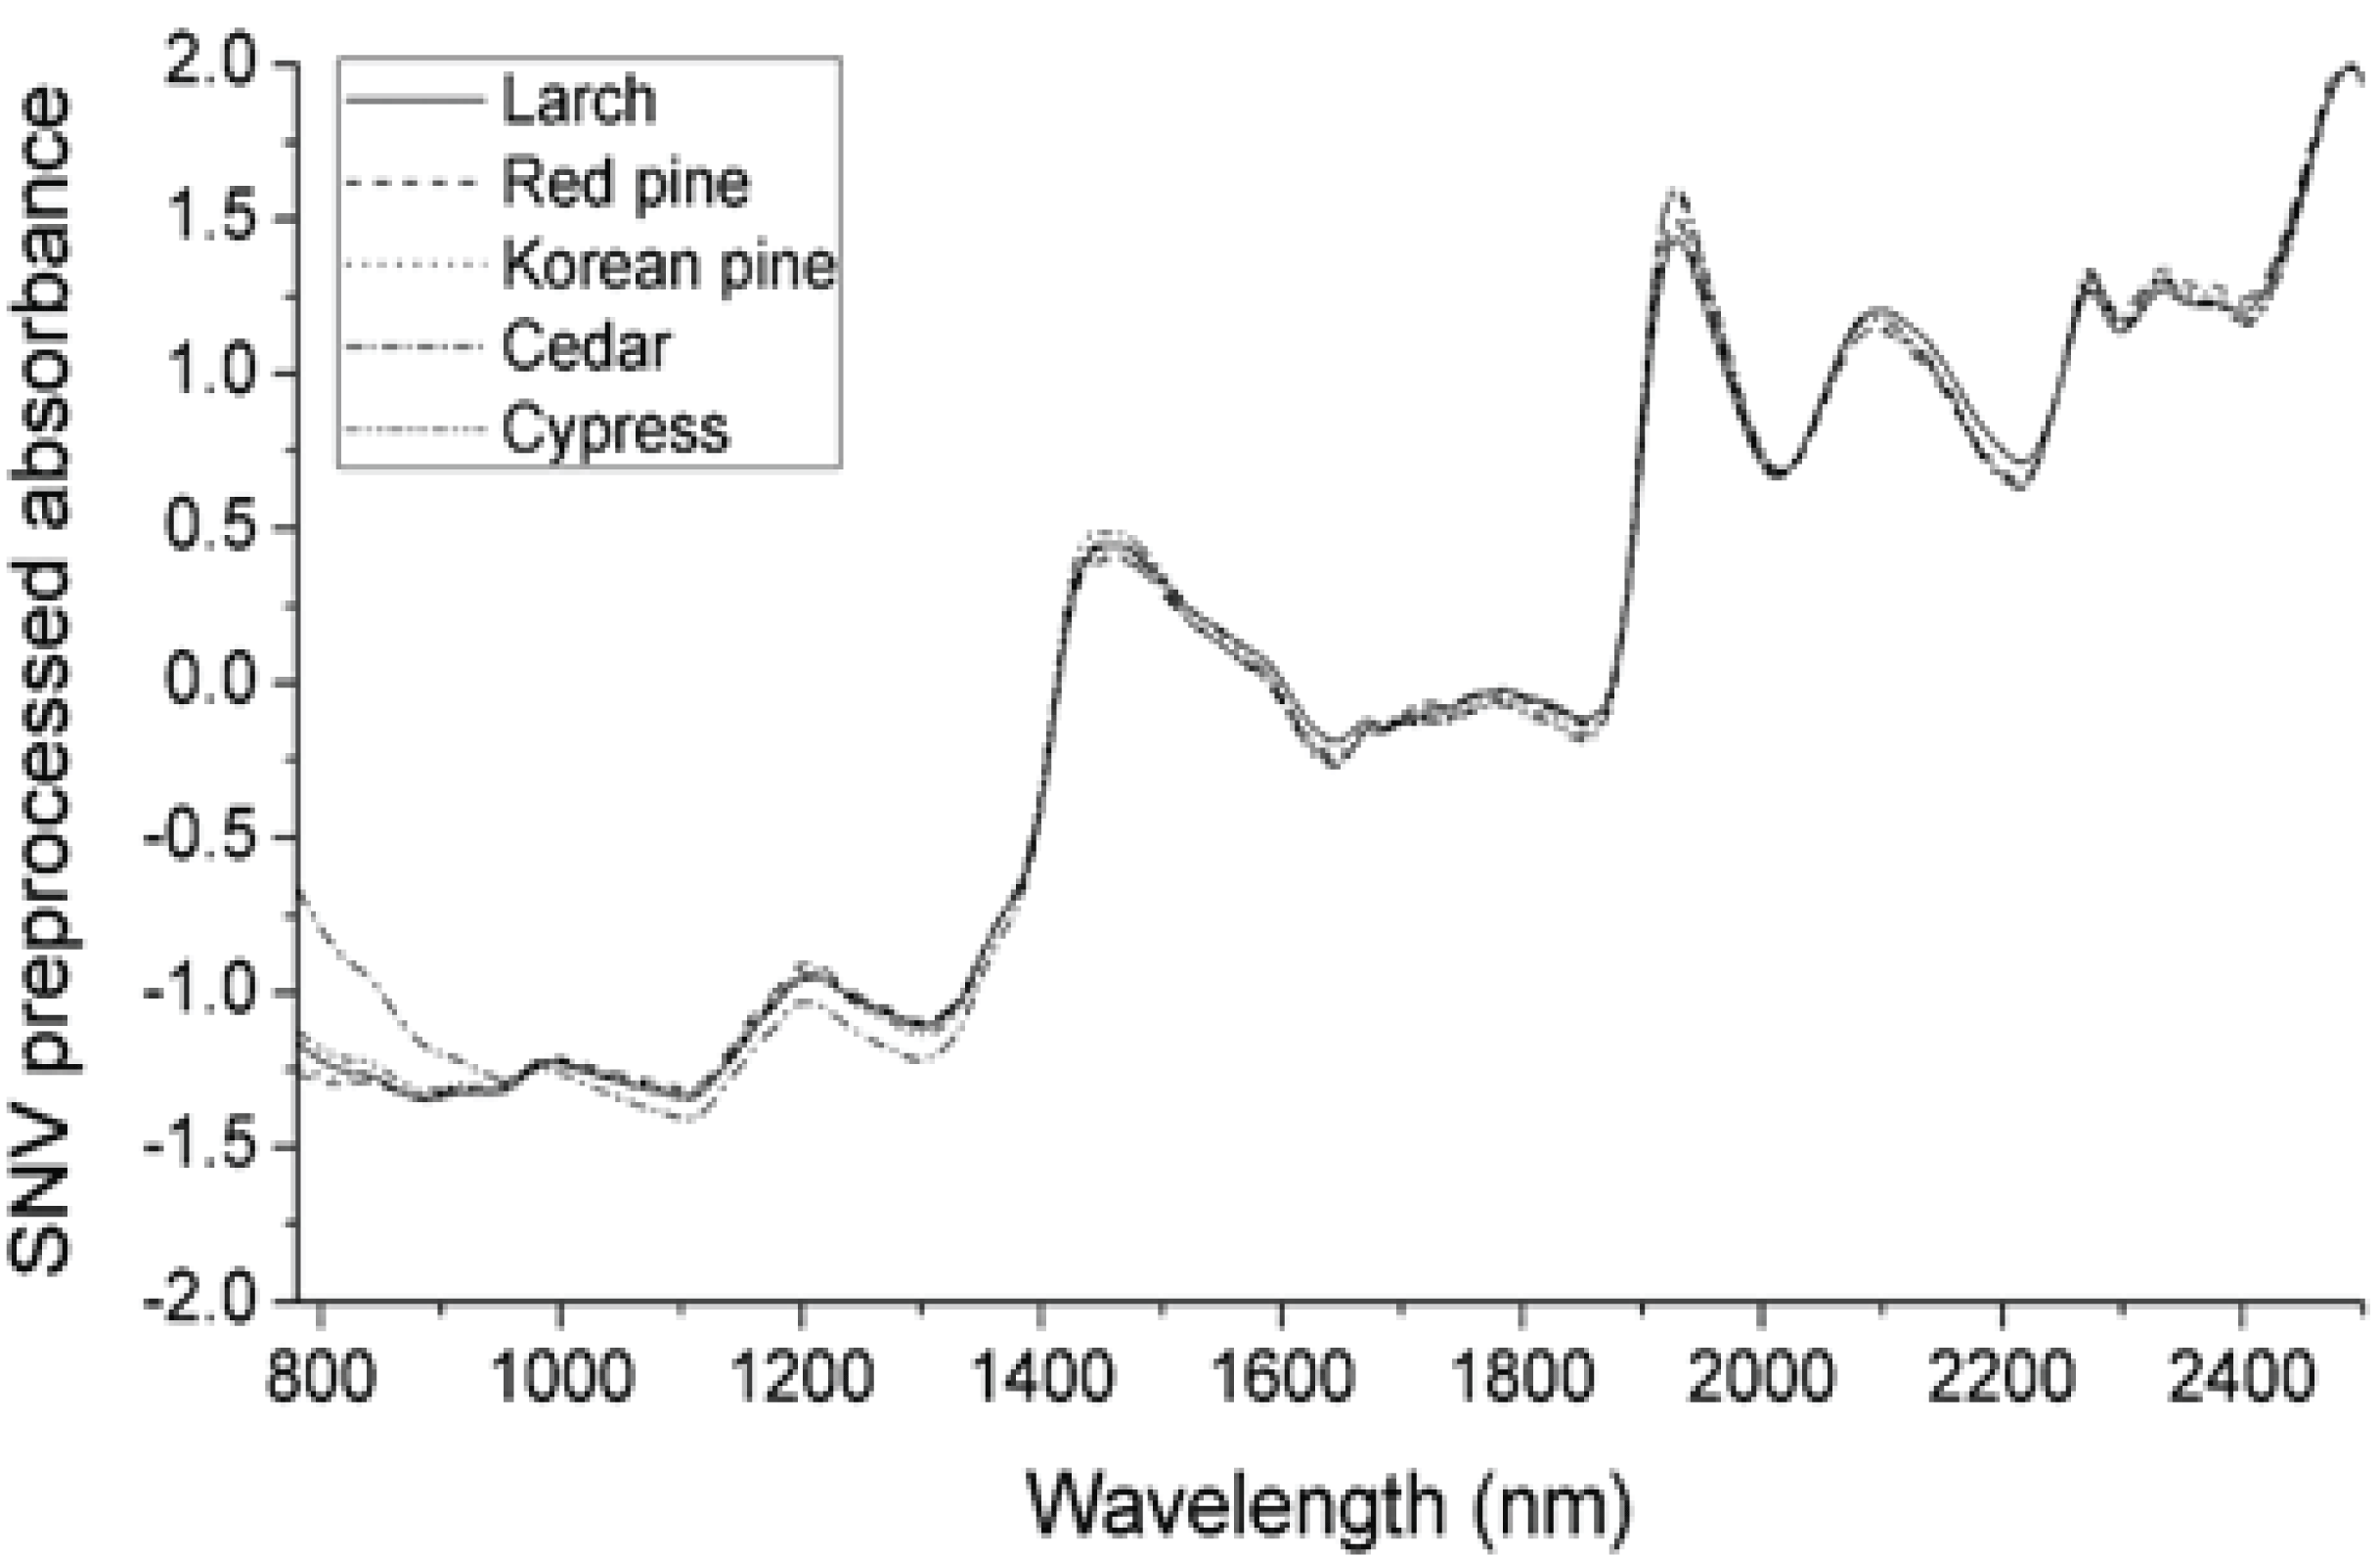
Fig. 1 shows the raw NIR spectra of each species (the spectra for each species training set were averaged to give a single spectrum). The raw spectra had a different absorbance, depending on the species. NIR light penetrates less than visible light, so thick material, such as lumber, acquires an absorbance spectrum in a diffuse reflectance mode. Even if they are the same species, the absorbance differs, depending on the surface roughness and grain angle in the lumber. These factors make the spectral variance more than a species difference. Therefore, it is necessary to preprocess the NIR spectra, to ensure the analysis’ reproducibility. In this study, SNV (Fig. 2) and the Savitzky–Golay 2nd derivative (Fig. 3) preprocessing were applied to the spectra. The results of SNV preprocessing (Barnes et al., 1989) showed that each species’ average spectrum was more similar than the raw absorbance spectra. There was a difference in the absorbance of cedar in the below 1,100 nm region compared to other species. The Savitzky–Golay 2nd derivative preprocessing can deconvolute the overlapping of absorption bands and remove the baseline (Savitzky and Golay, 1964). Fig. 3 shows the Savitzky–Golay 2nd derivative preprocessed average absorbance spectra. It was absolute that the spectral pattern for each species’ average spectra was also more similar than the raw absorbance spectra. Thus, it was expected that the variance originated from species variation would be more dominant after mathematical preprocessing.

Table 2 shows the optimal number of PCs, and the total explained variance in the optimal PCs for each class. PCA models of each species, using the raw spectra, had optimal PCs when one or two PCs were included. The total explained variance of the optimal model was about 99%, which meant that only one or two PCs contained 99% of the raw spectra information. This outcome is because the absorbance highly correlates with the overlapping of the absorption bands, and the baselines were not removed. The PCA models for each species, using the SNV preprocessed spectra, were evaluated as optimal when they had 5–7 PCs that explained about 96–98% of the total variance. The SNV preprocessed PCA models had more PCs but fewer variances than the raw PCA models. These results were also found in the PCA models based on the Savitzky– Golay 2nd derivative preprocessed spectra, which had 6–9 optimal PCs and explained 89–91% of the total variance. This means that mathematical preprocessing weakened correlation of the raw NIR data and emphasized the characteristics of the data.
The performance of a classification model can be evaluated by calculating the number of correctly classified class samples (true positives, TP), the number of correctly classified samples that do not belong to the class (true negatives, TN), and the samples that were either incorrectly classified (false positives, FP) or were not classified as class samples (false negatives, FN). These four counts constitute a confusion matrix, as shown in Table 3, in the case of the binary classification (Sokolova and Lapalme, 2009).
| Actual class | Positive | Negative |
|---|---|---|
| Predicted class | ||
| Positive | True positive (TP) | False positive (FP) |
| Negative | False negative (FN) | True negative (TN) |
Accuracy is defined as the number of correctly classified positive and negative samples divided by the total sample number (Eq. 1). Precision is the number of correctly classified positive samples divided by the number of samples predicted as positive (Eq. 2). Recall is the number of correctly classified positive samples (TP) divided by the number of actual positive samples (Eq. 3).
Table 4 presents the species classification result (confusion matrix) of SIMCA based on raw spectra, for which the classification accuracy was 35.50%. The precisions for each species were in the range 78.95–99.07%. However, the recalls for each species were very low, at 15.00–57.50%. An interesting point is that the total number of misclassified samples was much fewer than that of multi-classified or unclassified samples. Among the multi-classified samples, there were two to even five class multi-classifications (not shown in this study). As the reliability parameters were evaluated as very low, it was difficult to expect clear species classification using SIMCA with raw spectra.
Table 5 provides the species classification result of SIMCA based on SNV preprocessed spectra, for which the classification accuracy was 51.90%. The precisions for each species were in the range 90.67–100.00%. However, recalls for each species were very low, in the range 19.50–76.50%. Accuracy, precision, and recall were improved after SNV preprocessing of the raw spectra, except for the precision for cedar and recall for cypress. The number of unclassified samples was similar to that of the SIMCA model based on raw spectra. However, the number of multi-classified samples was highly reduced, except for cypress. In the case of cypress, the almost multi-classified samples were assigned as both cedar and cypress (not shown in this paper). It was estimated that the spectral pattern of cypress after SNV preprocessing was a subset of cedar.
Table 6 lists the species classification result of SIMCA based on Savitzky-Golay 2nd derivative preprocessed spectra. The classification accuracy was 73.00%, and the precisions for each species ranged from 98.54–100.00%. The recalls for each species was in the range 67.50–82.50%. Accuracy, precision, and recall were dramatically improved after the Savitzky–Golay 2nd derivative preprocessing of raw spectra for every species. The reliability parameters were improved compared to the SNV case. The total amount of unclassified samples was decreased compared to the SIMCA model with raw spectra. The unclassified samples are considered outliers for the model, but this is not a critical problem in classification compared to misclassification. In this context, it was encouraging that the minimum precision was < 98.54%. Although it had relatively low accuracy and recall, only three samples were misclassified as different species in the test set (1,000 samples) by SIMCA based on Savitzky–Golay 2nd derivative preprocessed spectra. As a result, Savitzky–Golay 2nd derivative preprocessing of NIR spectra showed the best reliability in SIMCA classification. The accuracy, minimum precision, and minimum recall of the best model were evaluated as 73.00%, 98.54%, and 67.50%, respectively.
4. CONCLUSION
This study examined the NIR spectroscopy and SIMCA for lumber species classification. A SIMCA classification model was developed using the NIR spectra acquired from the lumber surface. The classification reliability indices differed by mathematical preprocessing (raw, SNV, and Savitzky–Golay 2nd derivatives) of the NIR spectra. Among the modeling conditions, Savitzky–Golay 2nd derivatives showed the best classification performance. The best NIR spectra acquired from the lumber could be applied to classify lumber species by the SIMCA classification method, but the accuracy and recall should be improved.


