1. INTRODUCTION
Wood is a porous material and can absorb water when exposed to various moisture sources. Although the amount of moisture absorbed varies depending on the physical and chemical characteristics of wood, the more impingement of water on wood generally means the higher absorption and the deeper penetration of water into the wood. The increase of the moisture content of the wood may cause wood decay. Thus the knowledge of the level of exposure of wood to the impingement of water can be useful for developing a good design of wooden buildings from the point of preservation of wooden materials (Chouinard and Lawton, 2001).
There have been studies to evaluate the degree of wood decay hazard and compare regional differences (Degroot, 1982; Kim and Ra, 2014, Kim et al., 2011; Setliff, 1986; Scheffer, 1971). The research on driving rain is one of them because, in almost all climates, driving rain is one of the largest sources of moisture of wood used in exterior construction and not in contact with soil.
To quantitatively determine the effect of rain, Lacy (1962) first introduced the concept of driving rain. It was postulated that the quantity of rain that passes through a vertical wall in the atmosphere was proportional to the amount of rain falling on the ground and the wind speed while rain is falling. This concept resulted in driving rain index (DRI) that was expressed as the product of rainfall and wind speed. Lacy (1962) classified the level of exposure of buildings to wind-driven rain as shielded, moderate and high according to the values of DRI. It was determined in many countries such as Sweden, Denmark, Canada, USA, and China, and the DRI maps were created (Boyd, 1963; Chand, 1999; Chand and Bhargava, 2000; Lacy, 1962).
In Korea Ra (2017) investigated DRI for 82 locations spread all over the country by using daily-based climate data and reported that there were no high exposure regions. However, there was a need for additional research because the hourly-based climate data can gives a better estimation than the daily-based data. And there was no information about wind direction. Depending on regions, there may be a certain range of wind direction in which buildings were easy to come into contact with rain. Therefore, the information of the magnitude of driving rain according to wind directions would be very useful to develop a good design of wooden buildings.
The objective of this research is to supplement the previous research about the DRI for Korea. The DRI was determined by using hourly weather data and the magnitude of DRI was investigated at various wind directions.
2. MATERIALS and METHODS
Domestic hourly climatic data from 2009 to 2017 were obtained from the Korea Meteorological Administration (KMA). Climate data has currently been measured at 82 locations, but the hourly data were measured since 2009. The hourly data of interest in this research were precipitation, wind speed, and wind direction. The DRI was determined using equation (1) and (2).
where ADRI (m/s2) is annual driving rain index, W is hourly wind speed (m/s), P is daily precipitation (m), and AADRI is average annual driving rain index (m/s2)
In previous research performed by Ra (2017), the DRI was determined by using daily climate data. Some studies have used daily data instead of hourly data to calculate driving rain index because it is difficult to obtain the climate data for the consecutive periods of 30 years that is known as climatological normals (Chand and Bhargava, 2002). It seems that the DRI determined by using daily climate data have a kind of internal errors larger than the one determined by using the hourly climate data.
The 82 locations investigated were grouped into three categories based on the determined values of average annual driving rain index (AADRI). According to the exposure grading proposed by Lacy (1962), an index value greater than seven represents “High exposure”, values between seven and three indicate “Moderate exposure” and those below three refer to shielded sites.
The hourly-based ADRI values of Seoul were compared with its daily-based ADRI and the monthly-based ADRI values to investigate the differences among them. If the differences are slight, the daily-, or monthly-based DRI may be used to estimate a precise DRI when the long term hourly data is unavailable.
The intensity of DRI are evaluated according to wind directions. All the data were sorted according to wind direction, and the magnitude of DRI was calculated at the wind direction of 0°, 20°, 50°, 70°, 90°, 110°, 140°, 150°, 180°, 200°, 230°, 250°, 270°, 290°, 320°, and 340°.
3. RESULTS and DISCUSSION
In this research, the AADRI was calculated using the hourly climate data measured at 82 locations between 2009 to 2017 in Korea (Table 1). Unfortunately, there was no available hourly data of precipitation, wind speed, and wind direction before 2009. It may mean that the result should be used with care because it was not the result based on the three-decade averages of climatological variables that are called climate normals. It is a kind of accepted convention to use climate normals in the area related to climate analysis. However, there is controversy to use climate normals if current climate conditions are turning in upward or downward directions. The climate normal is generally accepted when the climate conditions are fluctuating.

The regions investigated were grouped into three categories based on the values of the determined AADRI-shielded (less than 3), moderate (between 3 and 7), and high (higher than 7). Based on this criteria, it was found that there were seven regions where the level of rain exposure is high: Jindo, Seongsan, Ulleungdo, Gosan, Yeosu, Heuksando, and Wando. The values are 10.43, 8.86, 8.75, 8.27, 8.25, 7.57, and 7.35. All the regions are islands except Yeosu that are located on the southern coast area of Korea.
The number of regions with shielded and moderate exposure to rain was 40, and 35, respectively. However, the previous research performed based on the daily climate data showed that there was no region with high exposure to rain (Ra, 2017). In the research, Daegwallyeong showed the highest AADRI values of 6.39, which was classified into the region with moderate exposure to rain.
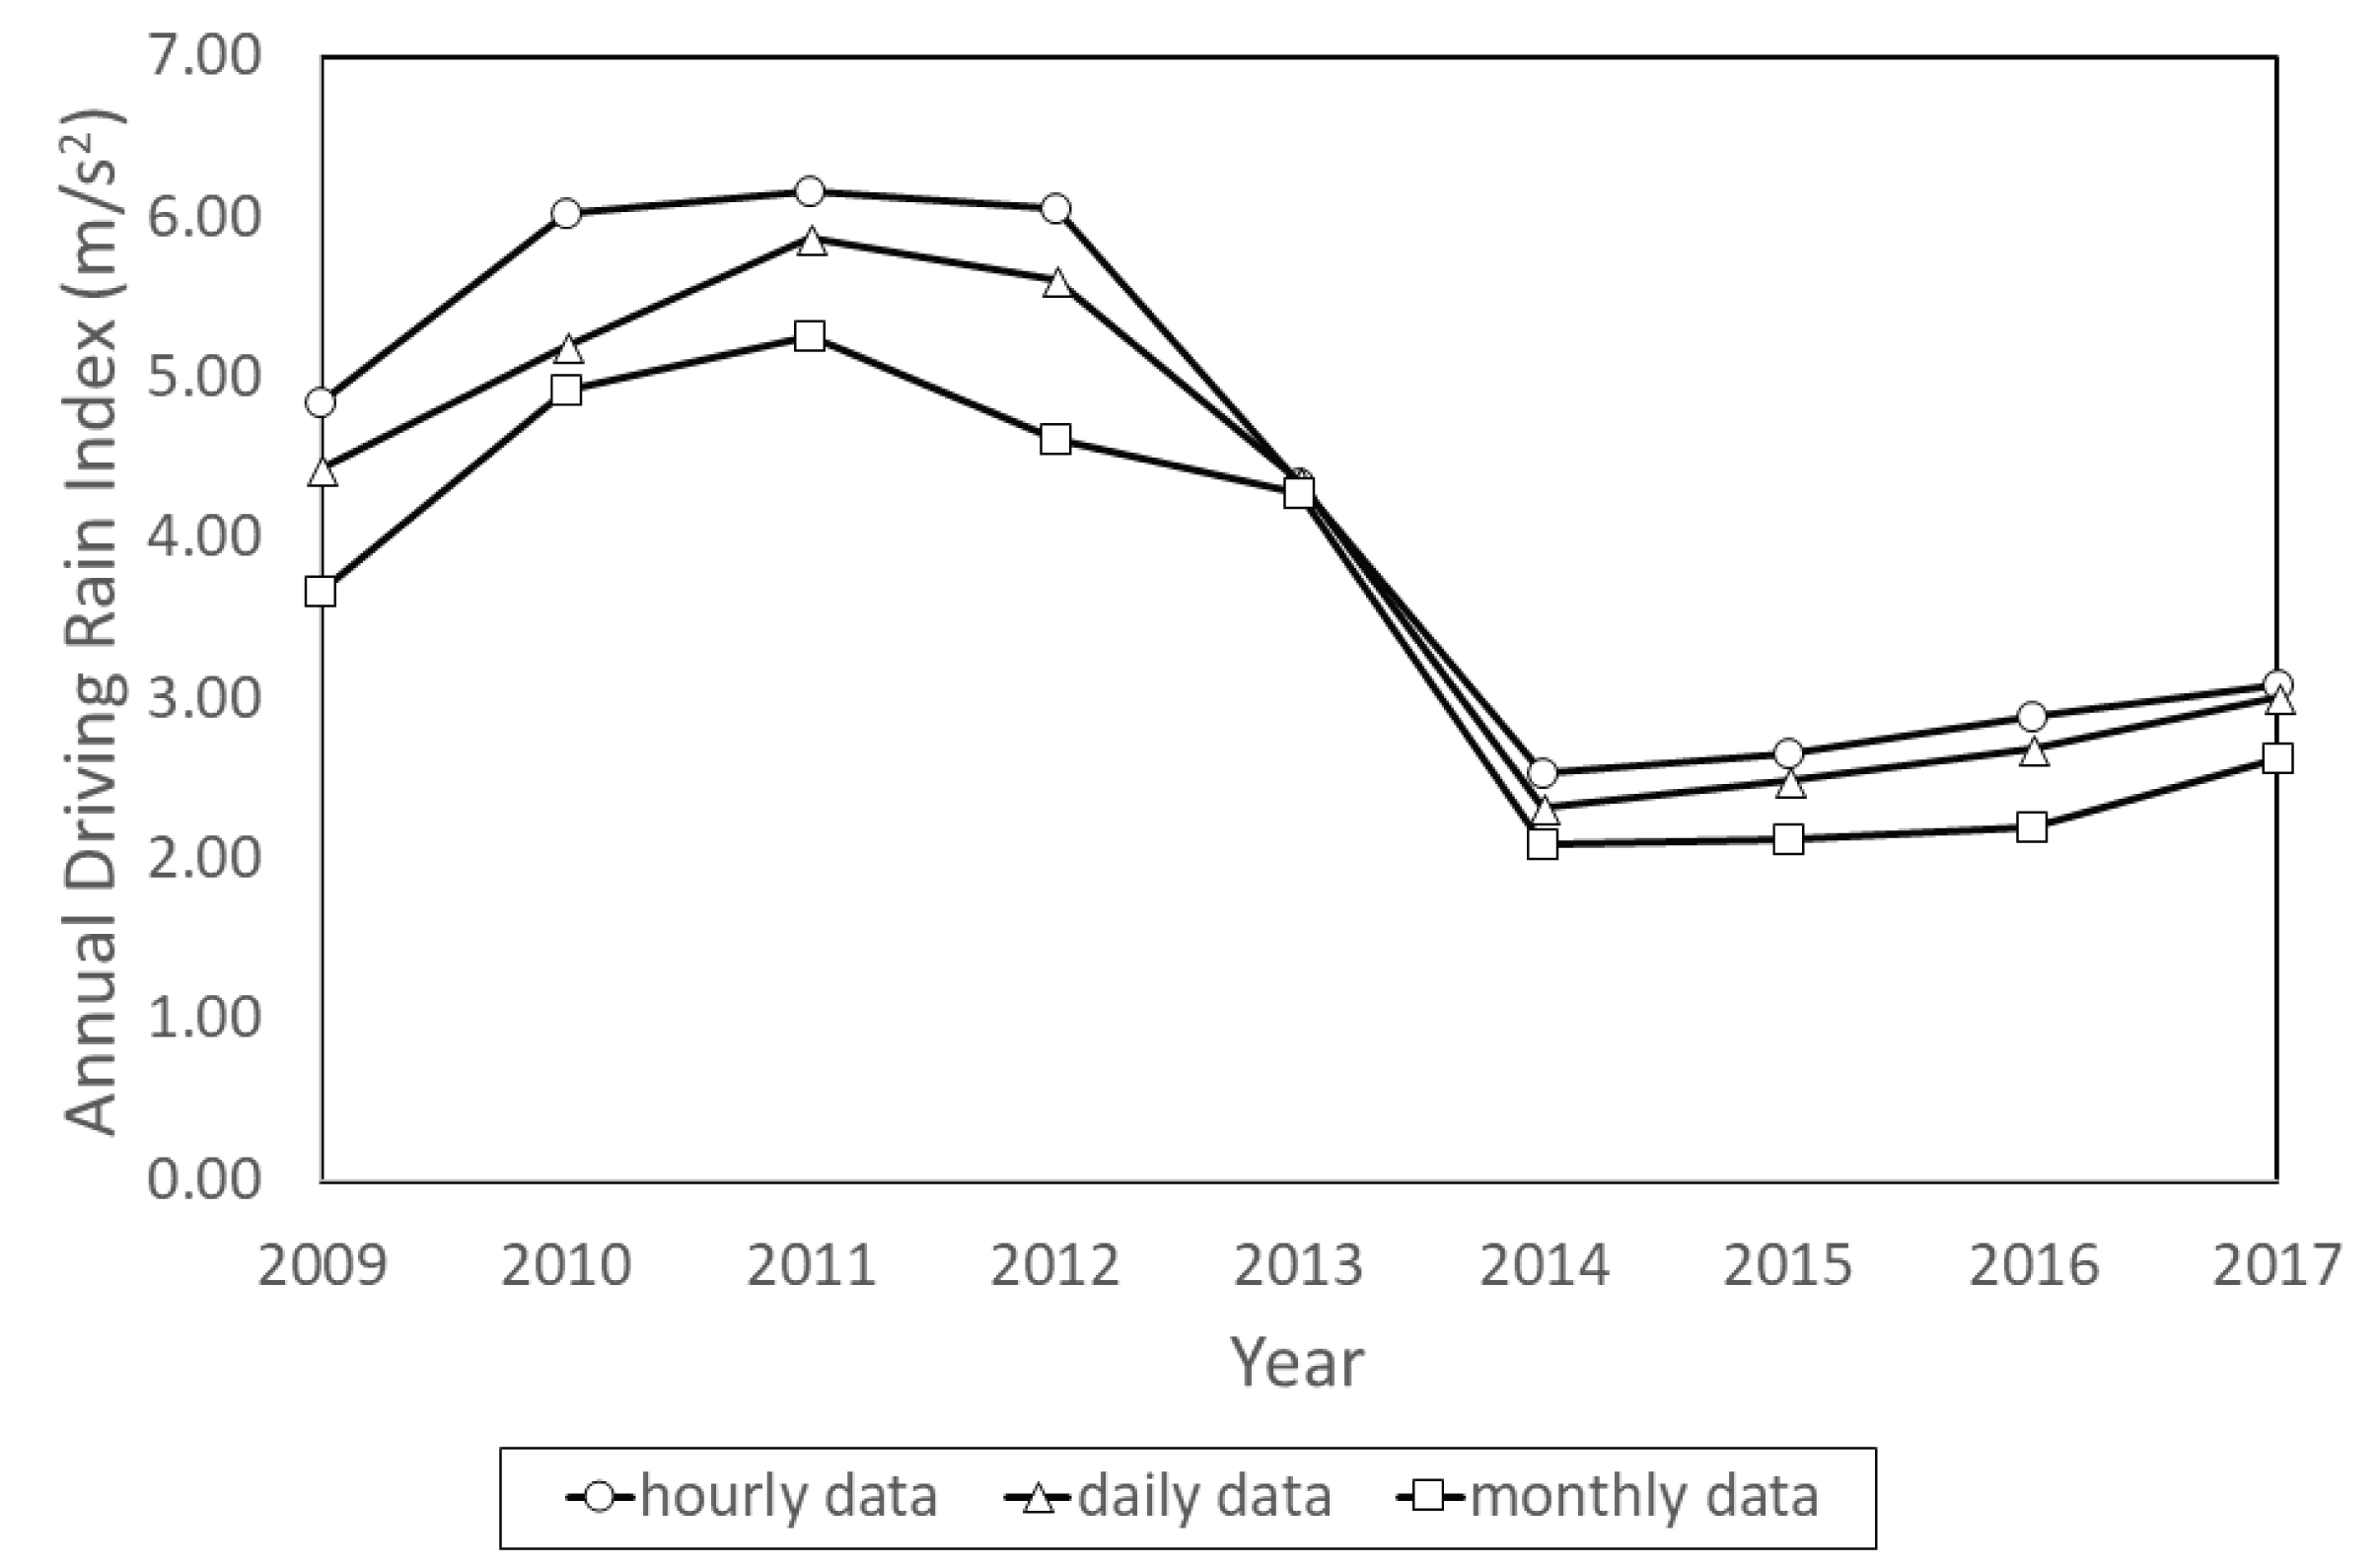
Fig. 1 showed the difference of ADRI values of Seoul determined by using hourly, daily, and monthly climate data for the period of 9 years. The highest values were observed in the DRI determined by using hourly data, followed by daily, and then monthly data. The ADRI values determined on the daily data showed about 6.5% less than the ADRI determined on the hourly data, and the monthly-based ADRI 18% less. It may be possible to use the daily-based ADRI to estimate the hourly- based ADRI for the years where no hourly data is available.

The different results of this research compared with the previous research can be explained by the different periods that were used in both studies. The daily-based AADRI determined in the previous research is the average values for 30 years, and the hourly-based AADRI is the average values for recent 9 years. Therefore the result that more high-exposure-to-rain regions were observed in the 9-year AADRI may offer a better information on the conditions of recent climate change. However, special care is required to interpretate the results because it may be the simple change of climate fluctuation.
Fig. 2 shows the change of DRI of five major cities- Seoul, Busan, Daegu, Daejeon, Gwangju, and Seongsan according to wind directions. The speed and direction of wind at any given location seems to be highly dependent on local topography. However, Seongsan, jeju island showed a broader range of wind directions with high DRI than inland regions such as Seoul, Busan, Daegu, Daejeon, and Gwangju.

The magnitude of DRI according to wind direction may have a useful information for developing a good design from the point of wood maintenance and preservation. In general, the faster and deeper penetration of water into wood can occur in the direction that the magnitude of DRI is high. Further research is needed to evaluate the relationship between DRI and moisture content at the surface of wooden walls.
4. CONCLUSION
The following conclusions can be drawn from this research.
The DRI were determined by using hourly climate data for the period of nine years. The number of regions where the level of exposure of wooden walls to rain was high, middle, and low were 7, 35 and 40, respectively.
The ADRI calculated by using hourly data tend to be 6.5% higher than the ADRI calculated using daily data.
The AADRI values according to wind directions showed that there was a certain range of wind direction in which walls were easy to come into contact with rain.
It suggest that the magnitude of AADRI according to wind directions may be a useful information to develop a design of wooden buildings from the point of wood preservation.


