1. INTRODUCTION
Environmental noise problems have escalated in recent years; therefore, improving the quality of life by controlling noise in residential environments has attracted an increasing share of attention (Kang et al., 2012). Accordingly, the acoustical properties of construction materials and measurements of sound absorption capability are being actively researched.
The sound absorption rate is calculated as the ratio of the sound energy absorbed by a material to the incident energy of the sound. It is classified into three categories: normal incidence, oblique incidence, and trespasser incidence. When the soundwaves arrive from all directions, the trespasser-incidence sound absorption rate is the actual sound absorption rate, and is called the random incident sound absorption rate. The measurement of this coefficient by the reverberation room method most accurately represents a material's sound-absorbing ability. However, to measure the absorption rate of random incident sound, a large space, and many specimens are required. An alternative method, called the impedance tube method, measures the normal incident sound absorption rate by one of two methods: the standing-wave ratio method and the transfer function method. The impedance tube method has gained popularity for its various advantages, such as convenient specimen preparation and test repeatability. The standing wave method calculates the sound absorption rates from the standing wave ratio, and the two-microphone transfer function method uses the measured transfer function between two microphones at two adjacent positions in the impedance tube (Kang et al., 2008).
Rice straw is a plentiful, reusable by-product of rice production. Its main components are carbon and oxygen, and its macroscopic constituents include moisture and ash. Owing to its uniform appearance, stable generation as a raw material, and plentiful output, rice straw is expected in many future applications. However, rice straw is unsuitable as a building material because its low specific gravity confers low mechanical properties. Moreover, it is an unattractive reusable fuel source because of its low calorific value.
The present study considers the reuse of rice straw particles as a sound-absorbing material. To evaluate whether rice straw particles provide an adequate sound-absorbing mat, the sound absorption capabilities of rice straw mats with different apparent densities and thicknesses were measured by the two-microphone transfer function method. For comparison with the transfer function method, the sound absorption of a 90 mm-thick rice straw mat with a specific gravity of 0.12 g/cm3 was also measured by the reverberation room method.
2. MATERIALS and METHODS
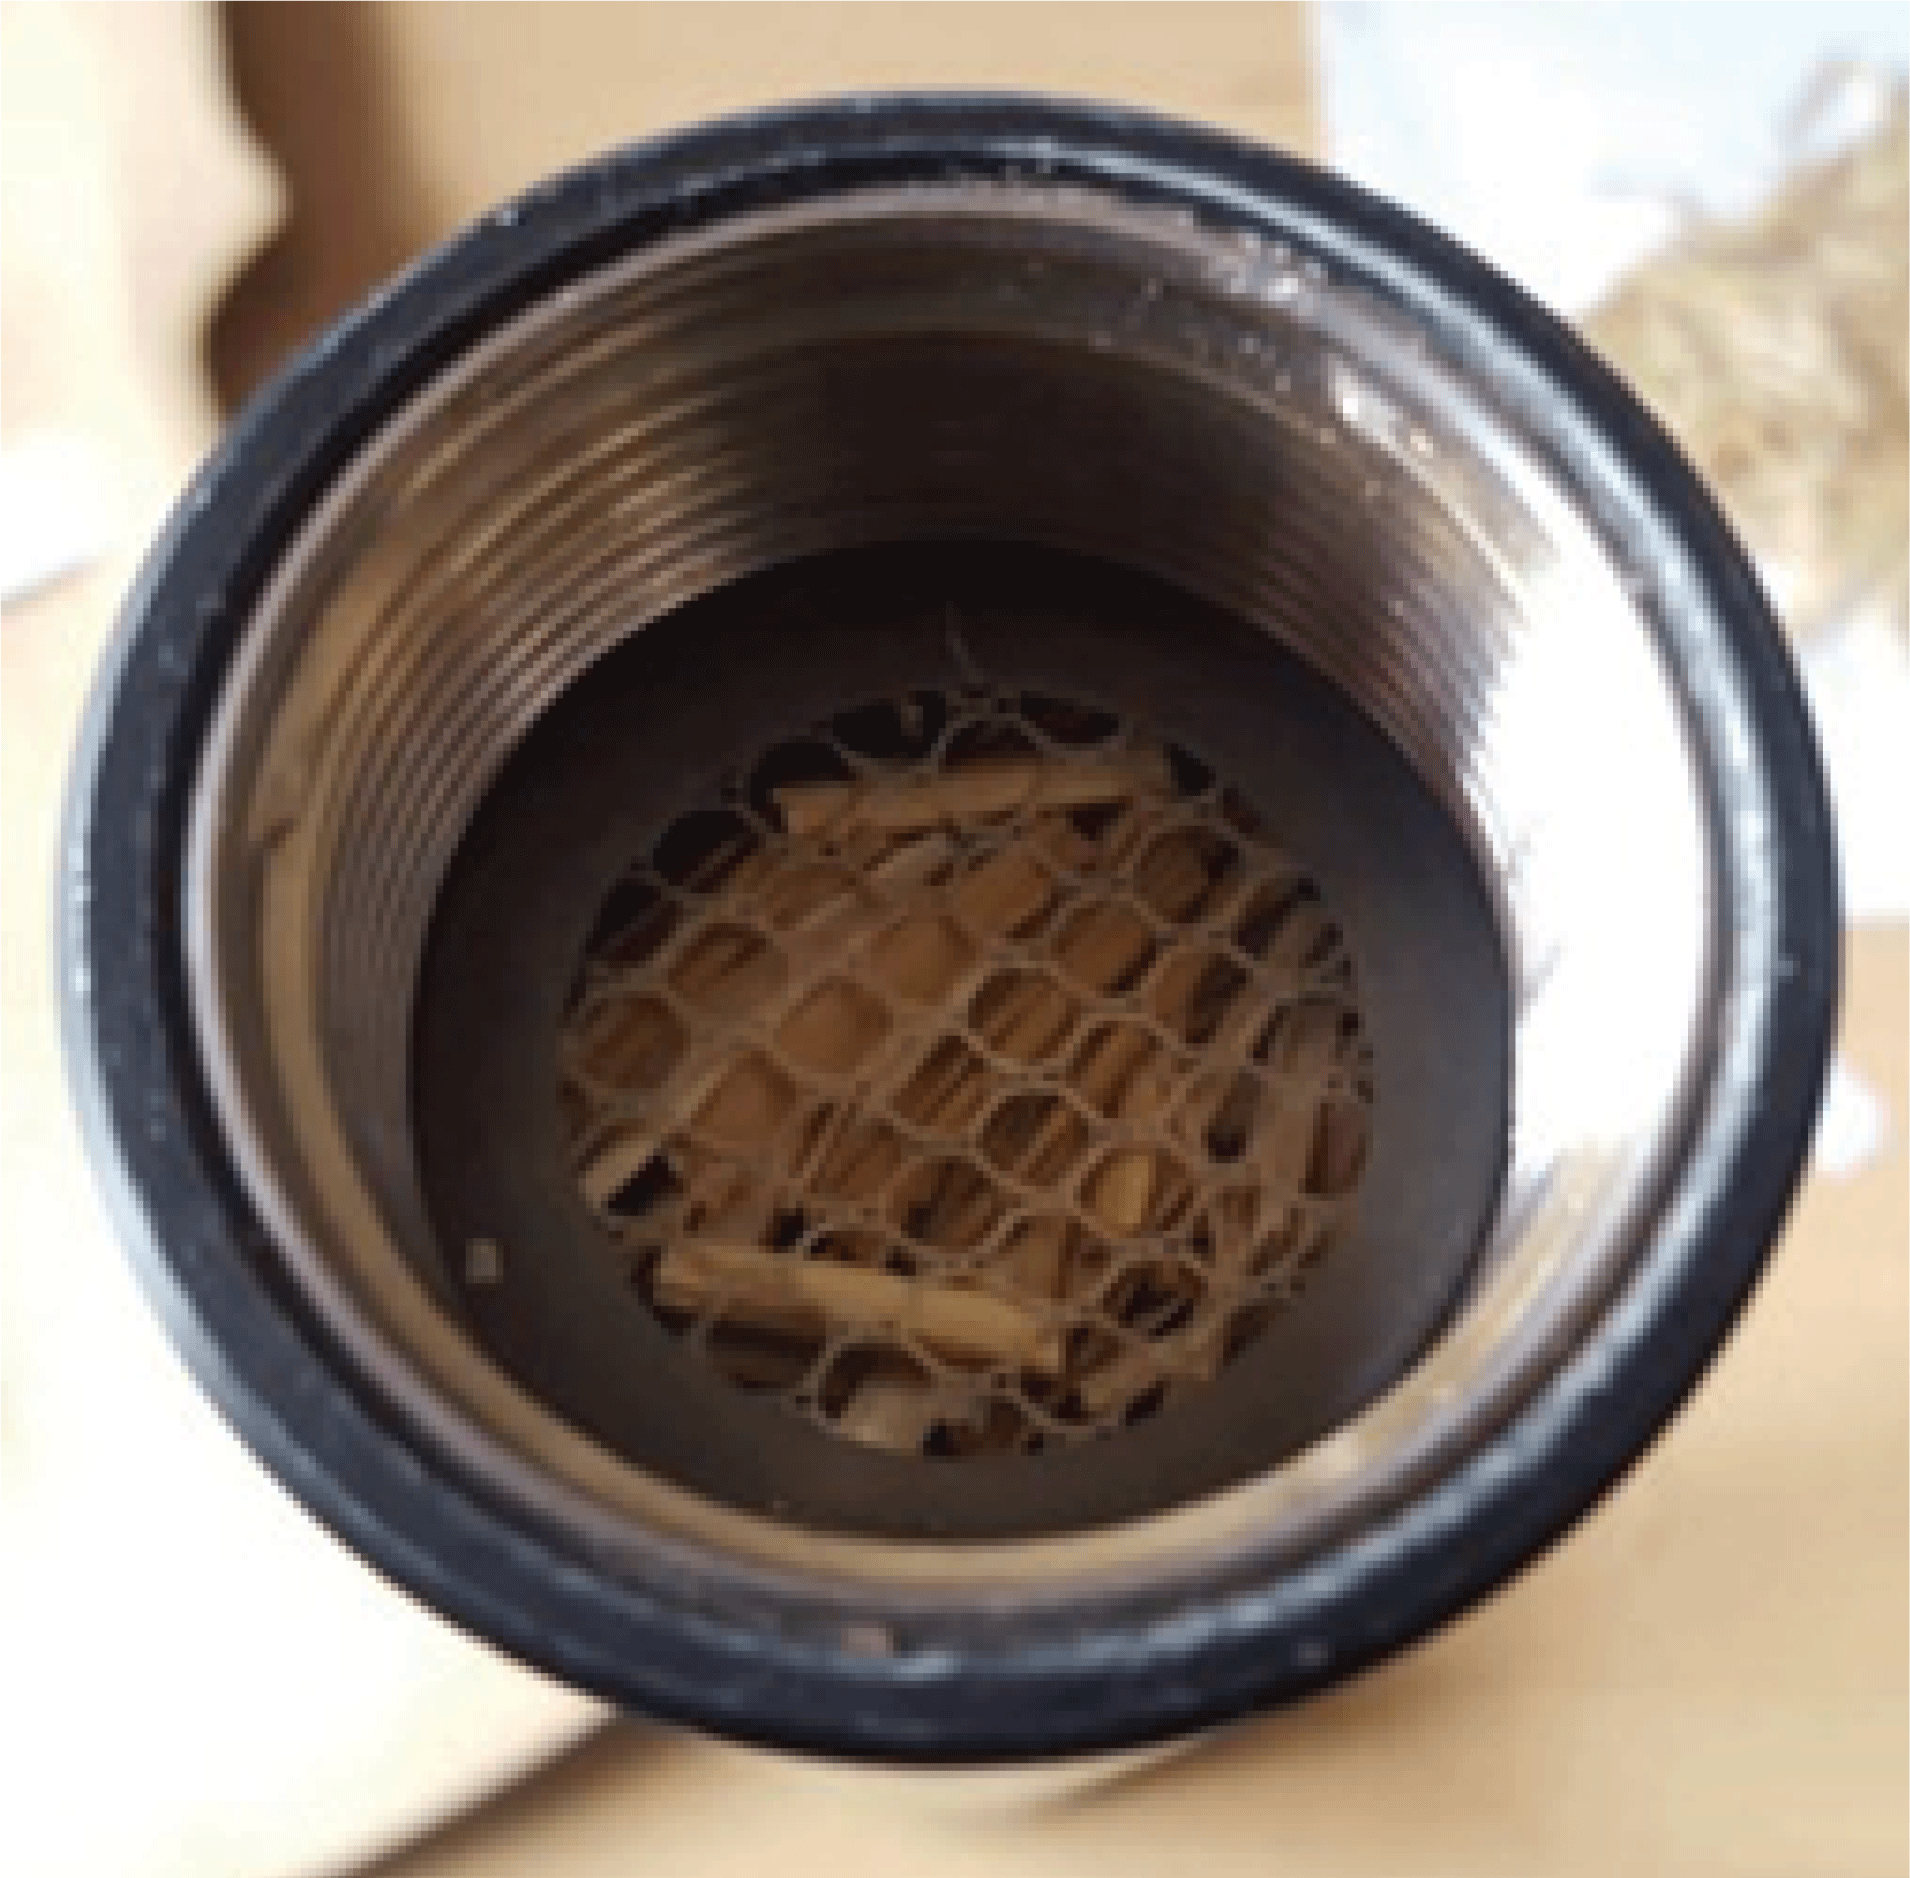
Air-dried rice straw particles (approximate length 10 mm) were packed into an impedance tube (Fig. 1). The apparent density of the rice straws was changed by altering the filling pressure, and the mat thickness was changed by an adjustable knob on the sample holder. To estimate the effect of attaching log cross-sections, which can reduce the sound transmission loss, a 10 mm-thick yellow poplar log cross-section was attached to the back of the 90 mm-thick rice straw mat with a specific gravity of 0.12 g/cm3.
The sound absorption rate in the practical frequency range was measured by the transfer function method using an impedance tube (B&K 4206, B&K Co., Nærum, Denmark) and a spectrum analyzer (B&K 3560-B, B&K Co., Nærum, Denmark), as previously described (Kang et al., 2012). The frequency range of this method was 500-6400 Hz. The influence of the air gap between the specimen and impedance tube was suppressed by a silicon O-ring installed in front of the sound-incidence surface. During the measurements, the temperature, relative humidity, and atmospheric pressure were 16.2 °C, 24% and 1013.2 hPa, respectively. The sound velocity, air density, and acoustic impedance were 341.01 m/s, 1.218 kg/m3 and 415.3 Pa/(m/s), respectively.
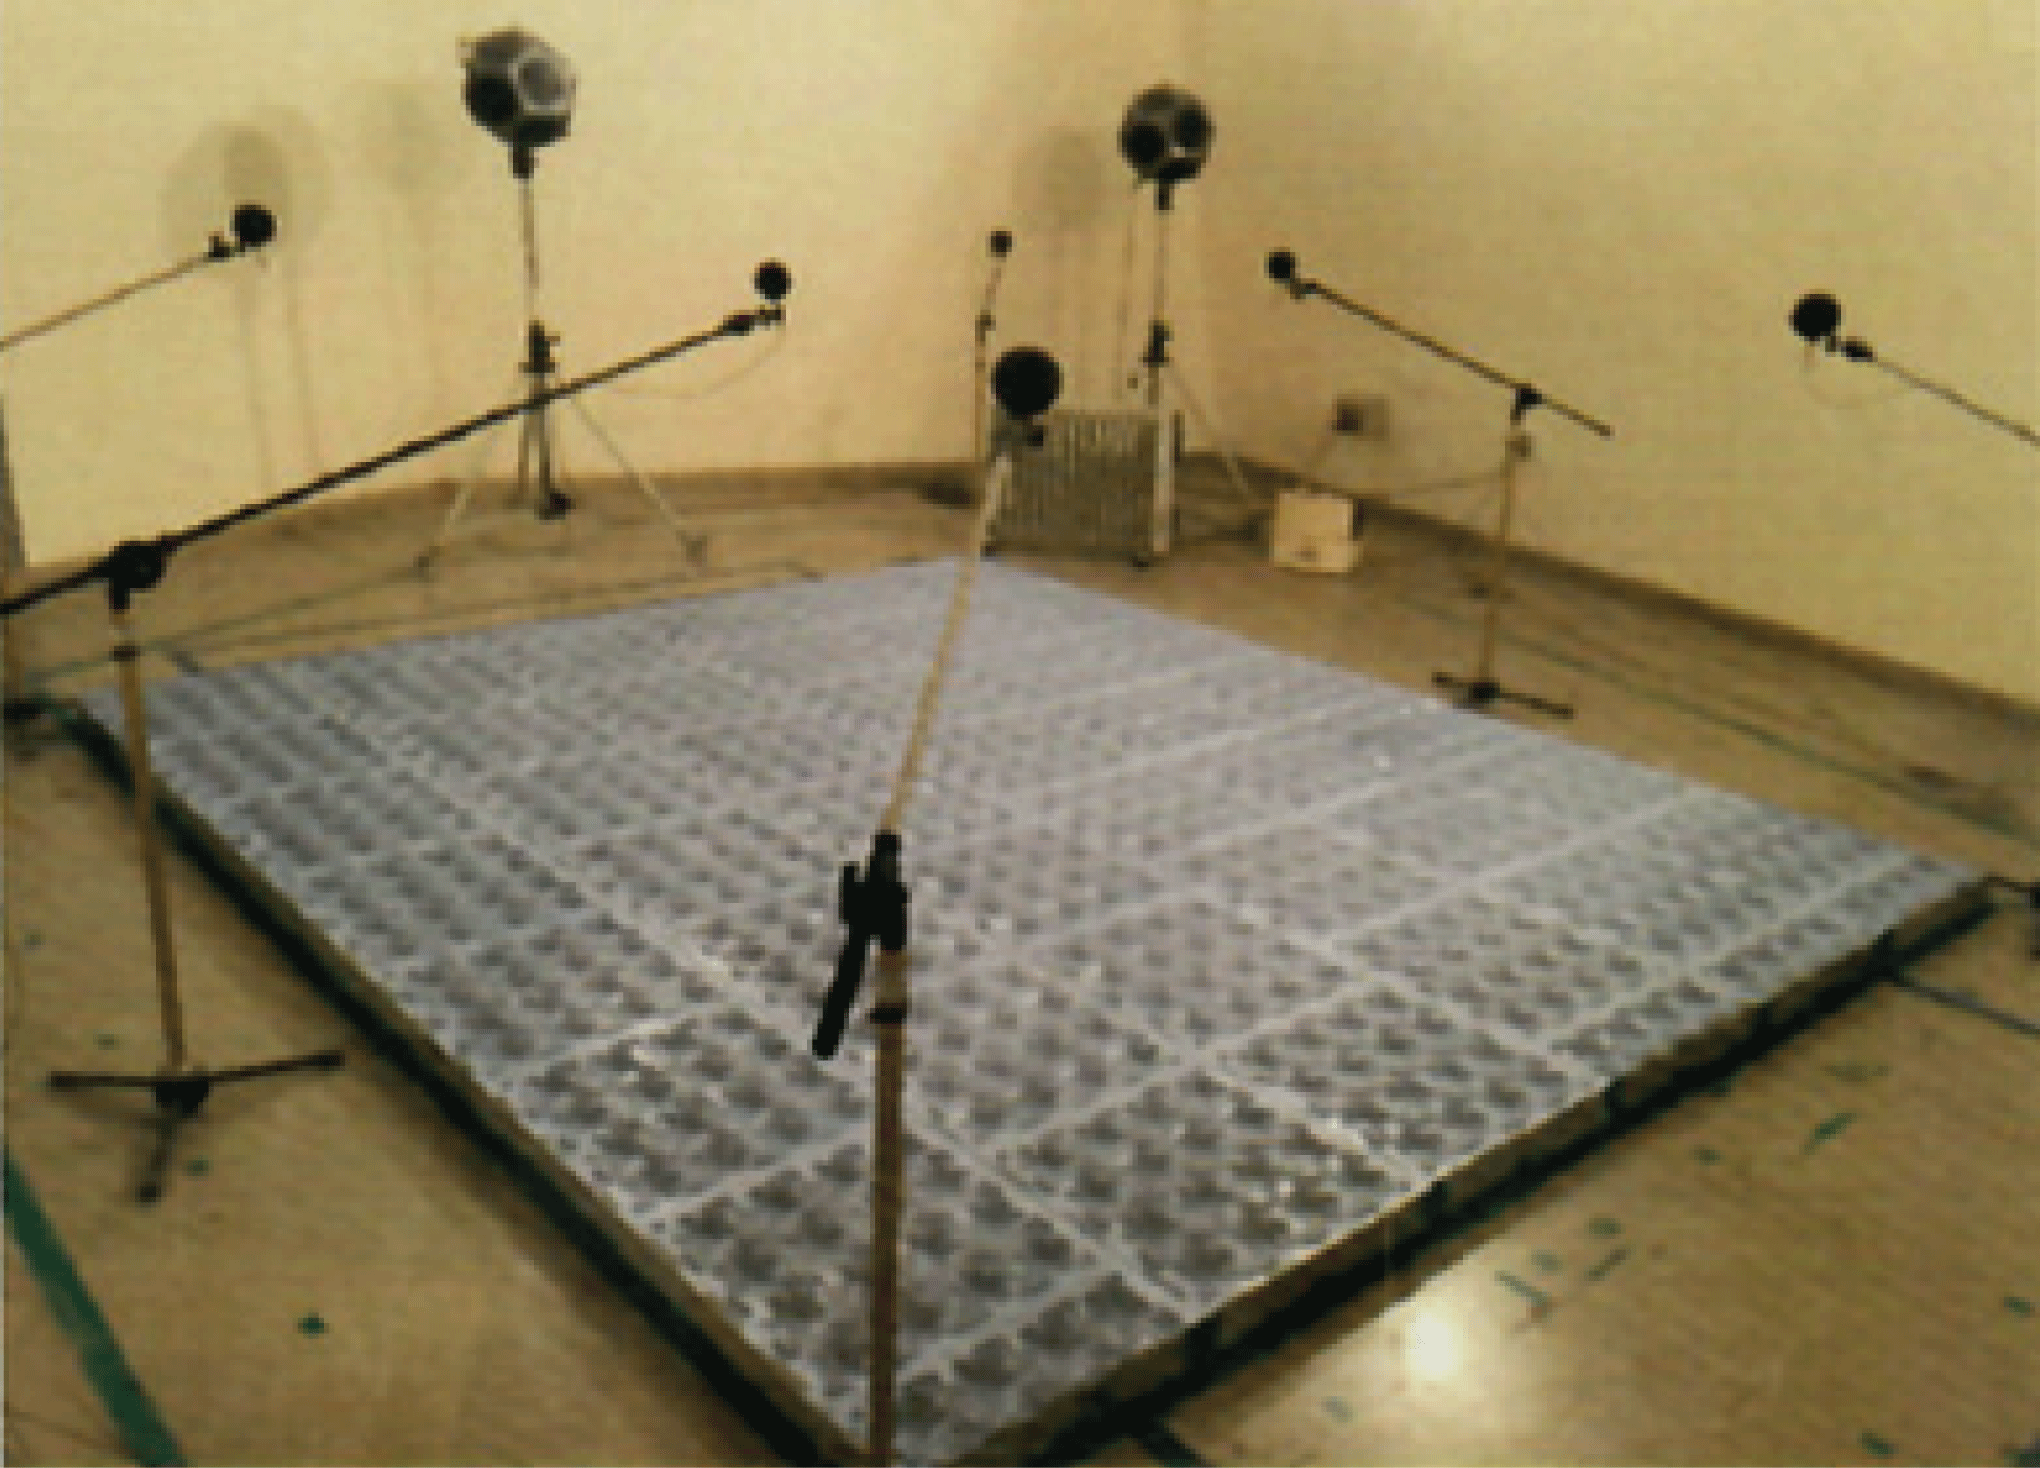
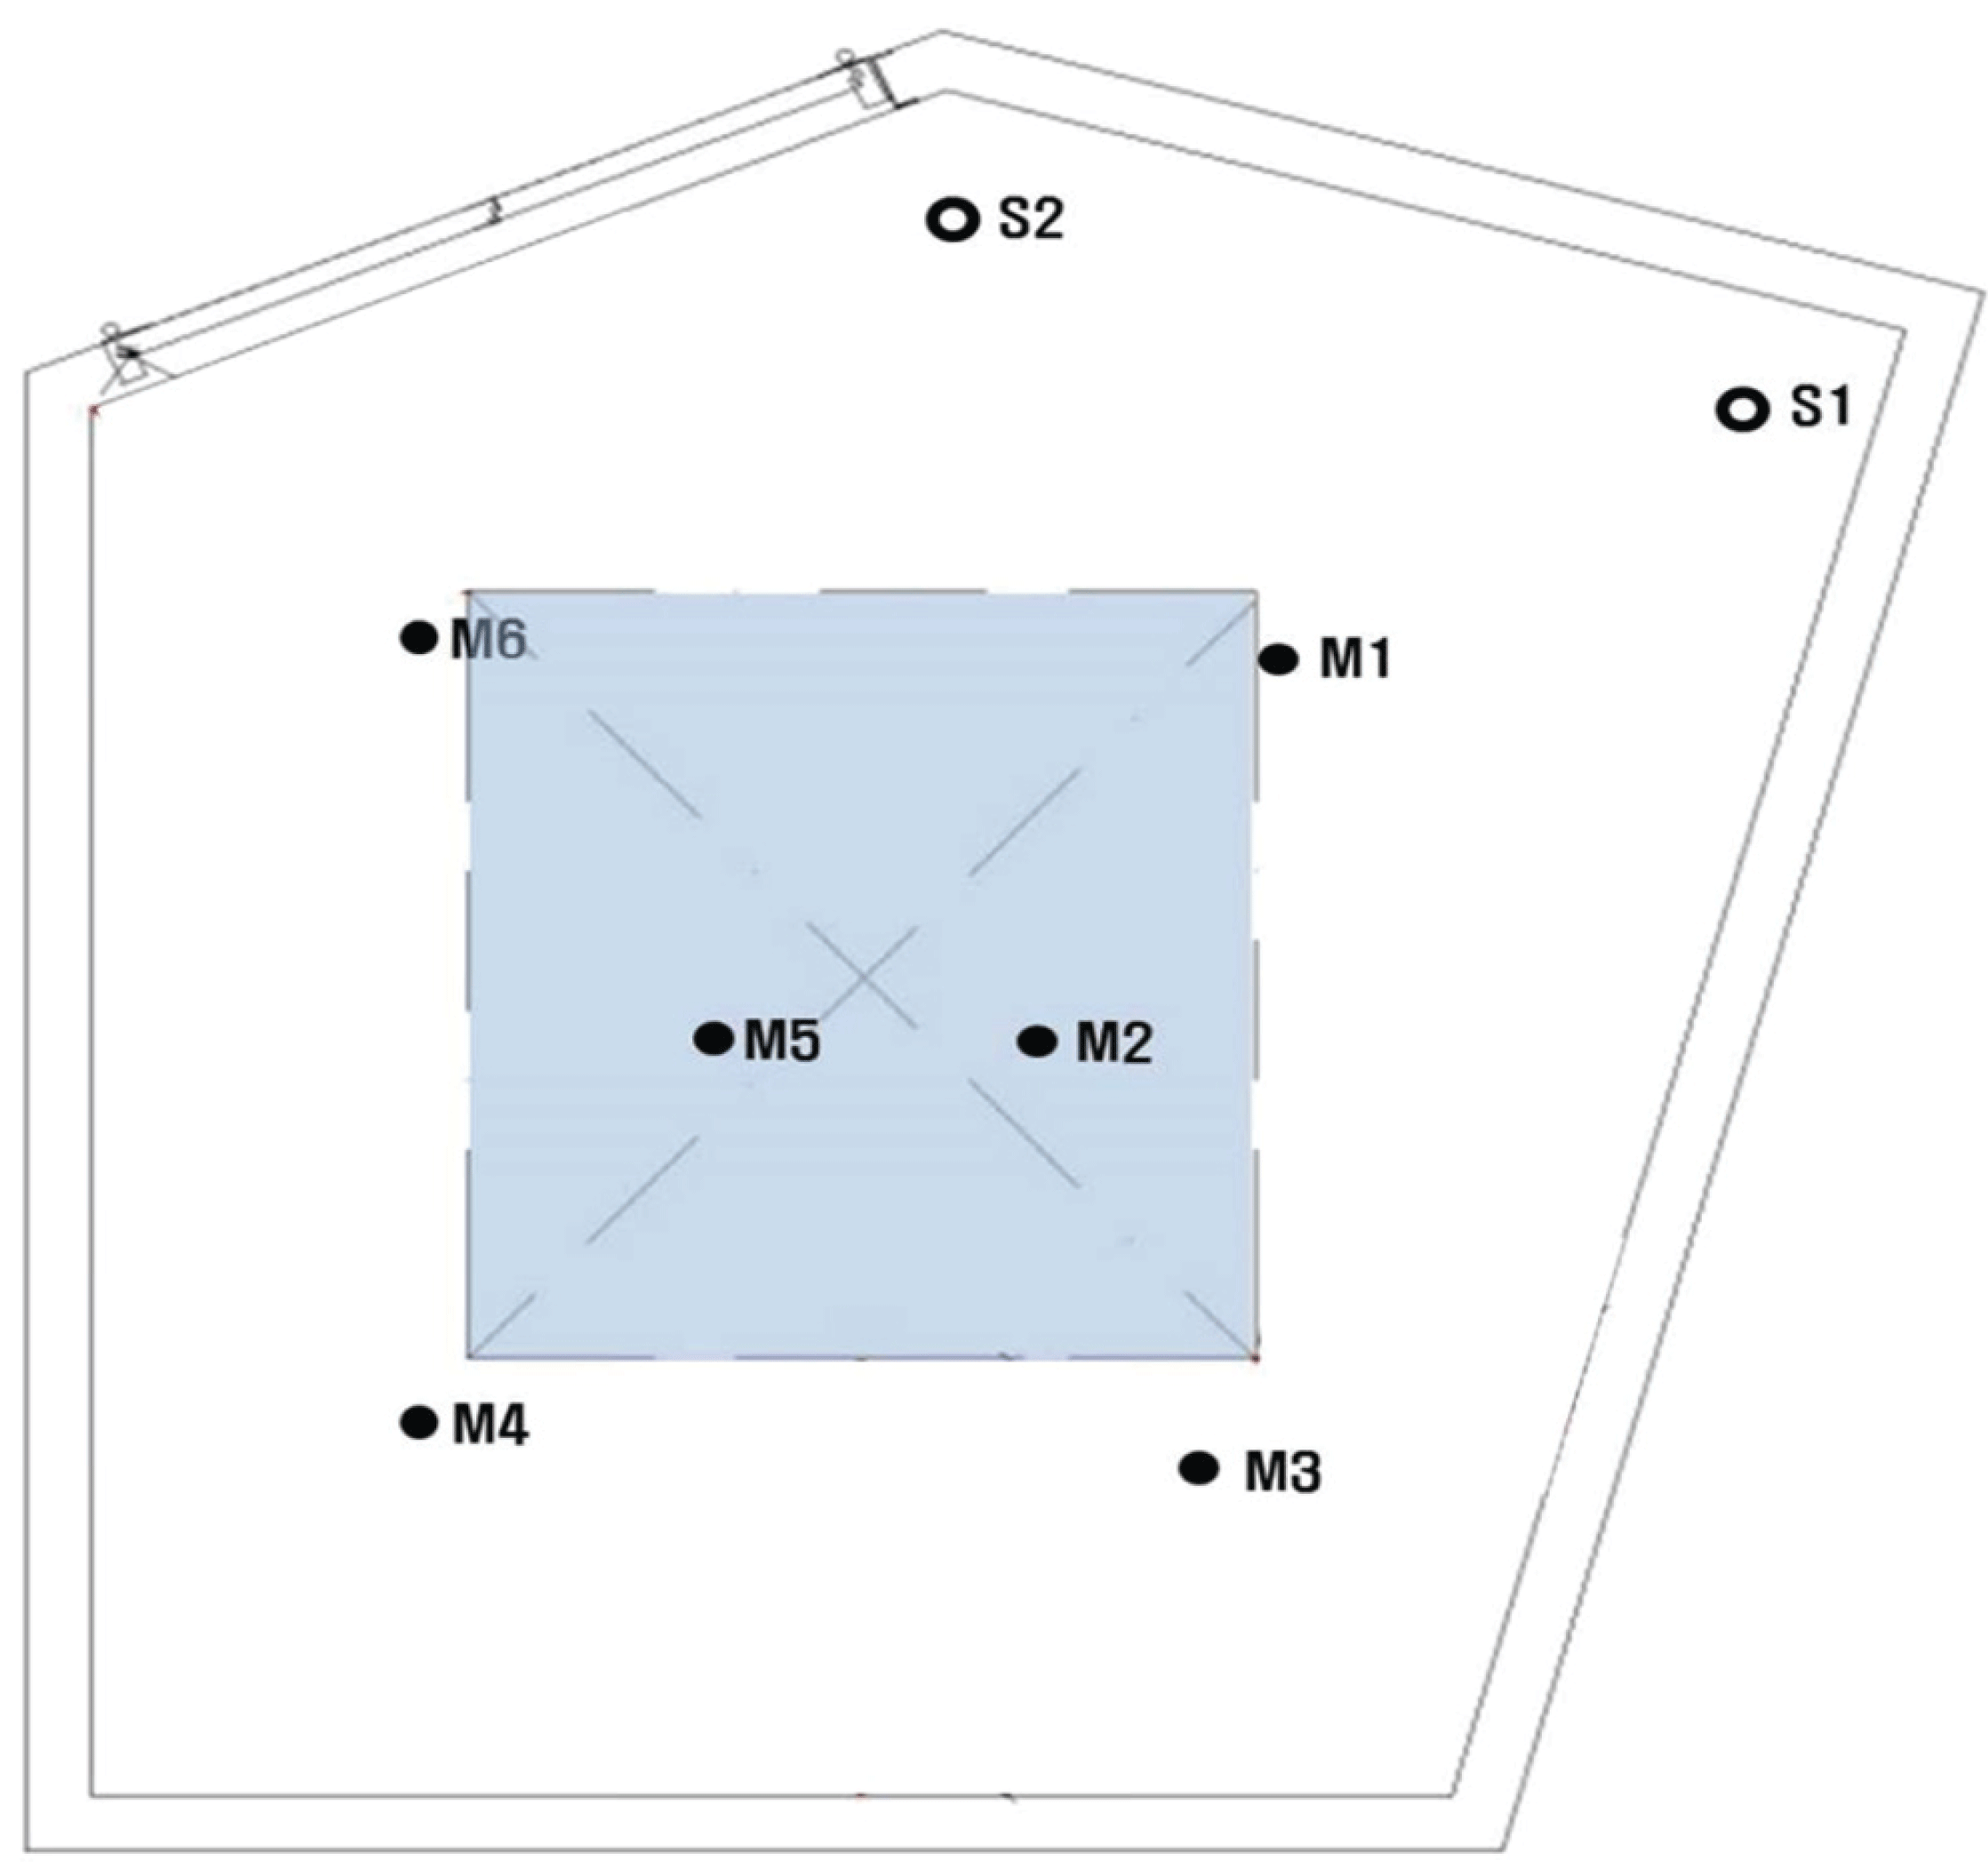
The reverberation room was an irregularly shaped room with five walls, constructed from reinforced concrete. The wall thickness and room volume were 300 mm and 209.7 m3, respectively, and the ceiling was partly covered with 15 m2 of sound diffuser material. The rice straw mats were 3.040 m wide and 3.605 m long (area 10.96 m2), with a thickness of 0.095 m. The rice straw mats were installed on the floor and covered with an aluminum frame. The edges of the whole specimens were sealed with tape as shown in Fig. 2. The temperature and relative humidity were 15.1 ± 1.0 °C and 43.0 ± 3.0 % respectively in the empty reverberation room, and 15.1 ± 1.1 °C and 39.0 ± 3.5 % respectively when the specimens were installed.
Pure sound (the central frequency of the one-third octave band in the 100-5000 Hz range) was generated through a loudspeaker. The reverberating time at six positions (see Figs. 2 and 3) was measured using a 1/2" condenser microphone, a real time analyzer, and a power amplifier. After measuring the time required to attenuate the acoustic energy to 60 dB, the sound absorption rate was calculated as follows:
where
αS is the sound absorption coefficient of the estimated material
AT is the equivalent area of sound absorption by the sample specimen (m2)
S is the area of the sample specimen (m2),
A2 is the equivalent area of sound absorption in the reverberation room installed with the specimen (m2)
A1 is the equivalent area of sound absorption in the empty reverberation room (m2)
V is the volume of the empty reverberation room (m3)
c2 is the velocity of sound in air after installing the specimen (m/s)
t is the air temperature (°C)
T2 is the reverberation time in the reverberating room installed with the specimen (s)
T1 is the reverberation time in the empty reverberating room (s)
m2 is the power attenuation coefficient in the reverberating room installed with the specimen (m-1)
m1 is the power attenuation coefficient in the empty reverberating room (m-1).
3. RESULTS and DISCUSSION
The sound absorption rate of the 9 cm-thick rice straw mat with a density of 0.12 g/cm3 was obtained from the reverberation times calculated before and after installation of the 10 m2 specimen in the reverberation room (see Fig. 2). The average reverberation times, calculated from those of the microphones at 6 locations for various pure sounds (central frequency of the octave bands generated by the first speaker), are presented in Table 1. The reverberation times before and after installation of the acoustic material differed by 7 seconds around 100 Hz, and by 0.6 seconds around 5000 Hz. Fig. 4 plots the acoustic absorption coefficients calculated from the differences in reverberation times. At each pure-frequency sound, the sound absorption rate was averaged among those of the six microphones placed at different locations. The sound absorption coefficients were below 0.55 in the low-frequency range (up to 250 Hz) and exceeded 0.8 at frequencies above 500 Hz (reaching 0.97-0.98 in the 1000-1250 Hz range). This indicates that the sound absorption rate of the rice straw mats increased with increasing frequency, which typifies the characteristics of porous sound absorbers. The sound absorption capability of a material is determined by the noise reduction coefficient (NRC), calculated by averaging the sound absorption coefficients at 250, 500, 1000, and 2000 Hz. The NRC of the rice straw mats was 0.8, exceeding that of 95 mm-thick sound-absorbing aluminum frames conventionally employed as sound barriers (NRC = 0.76).
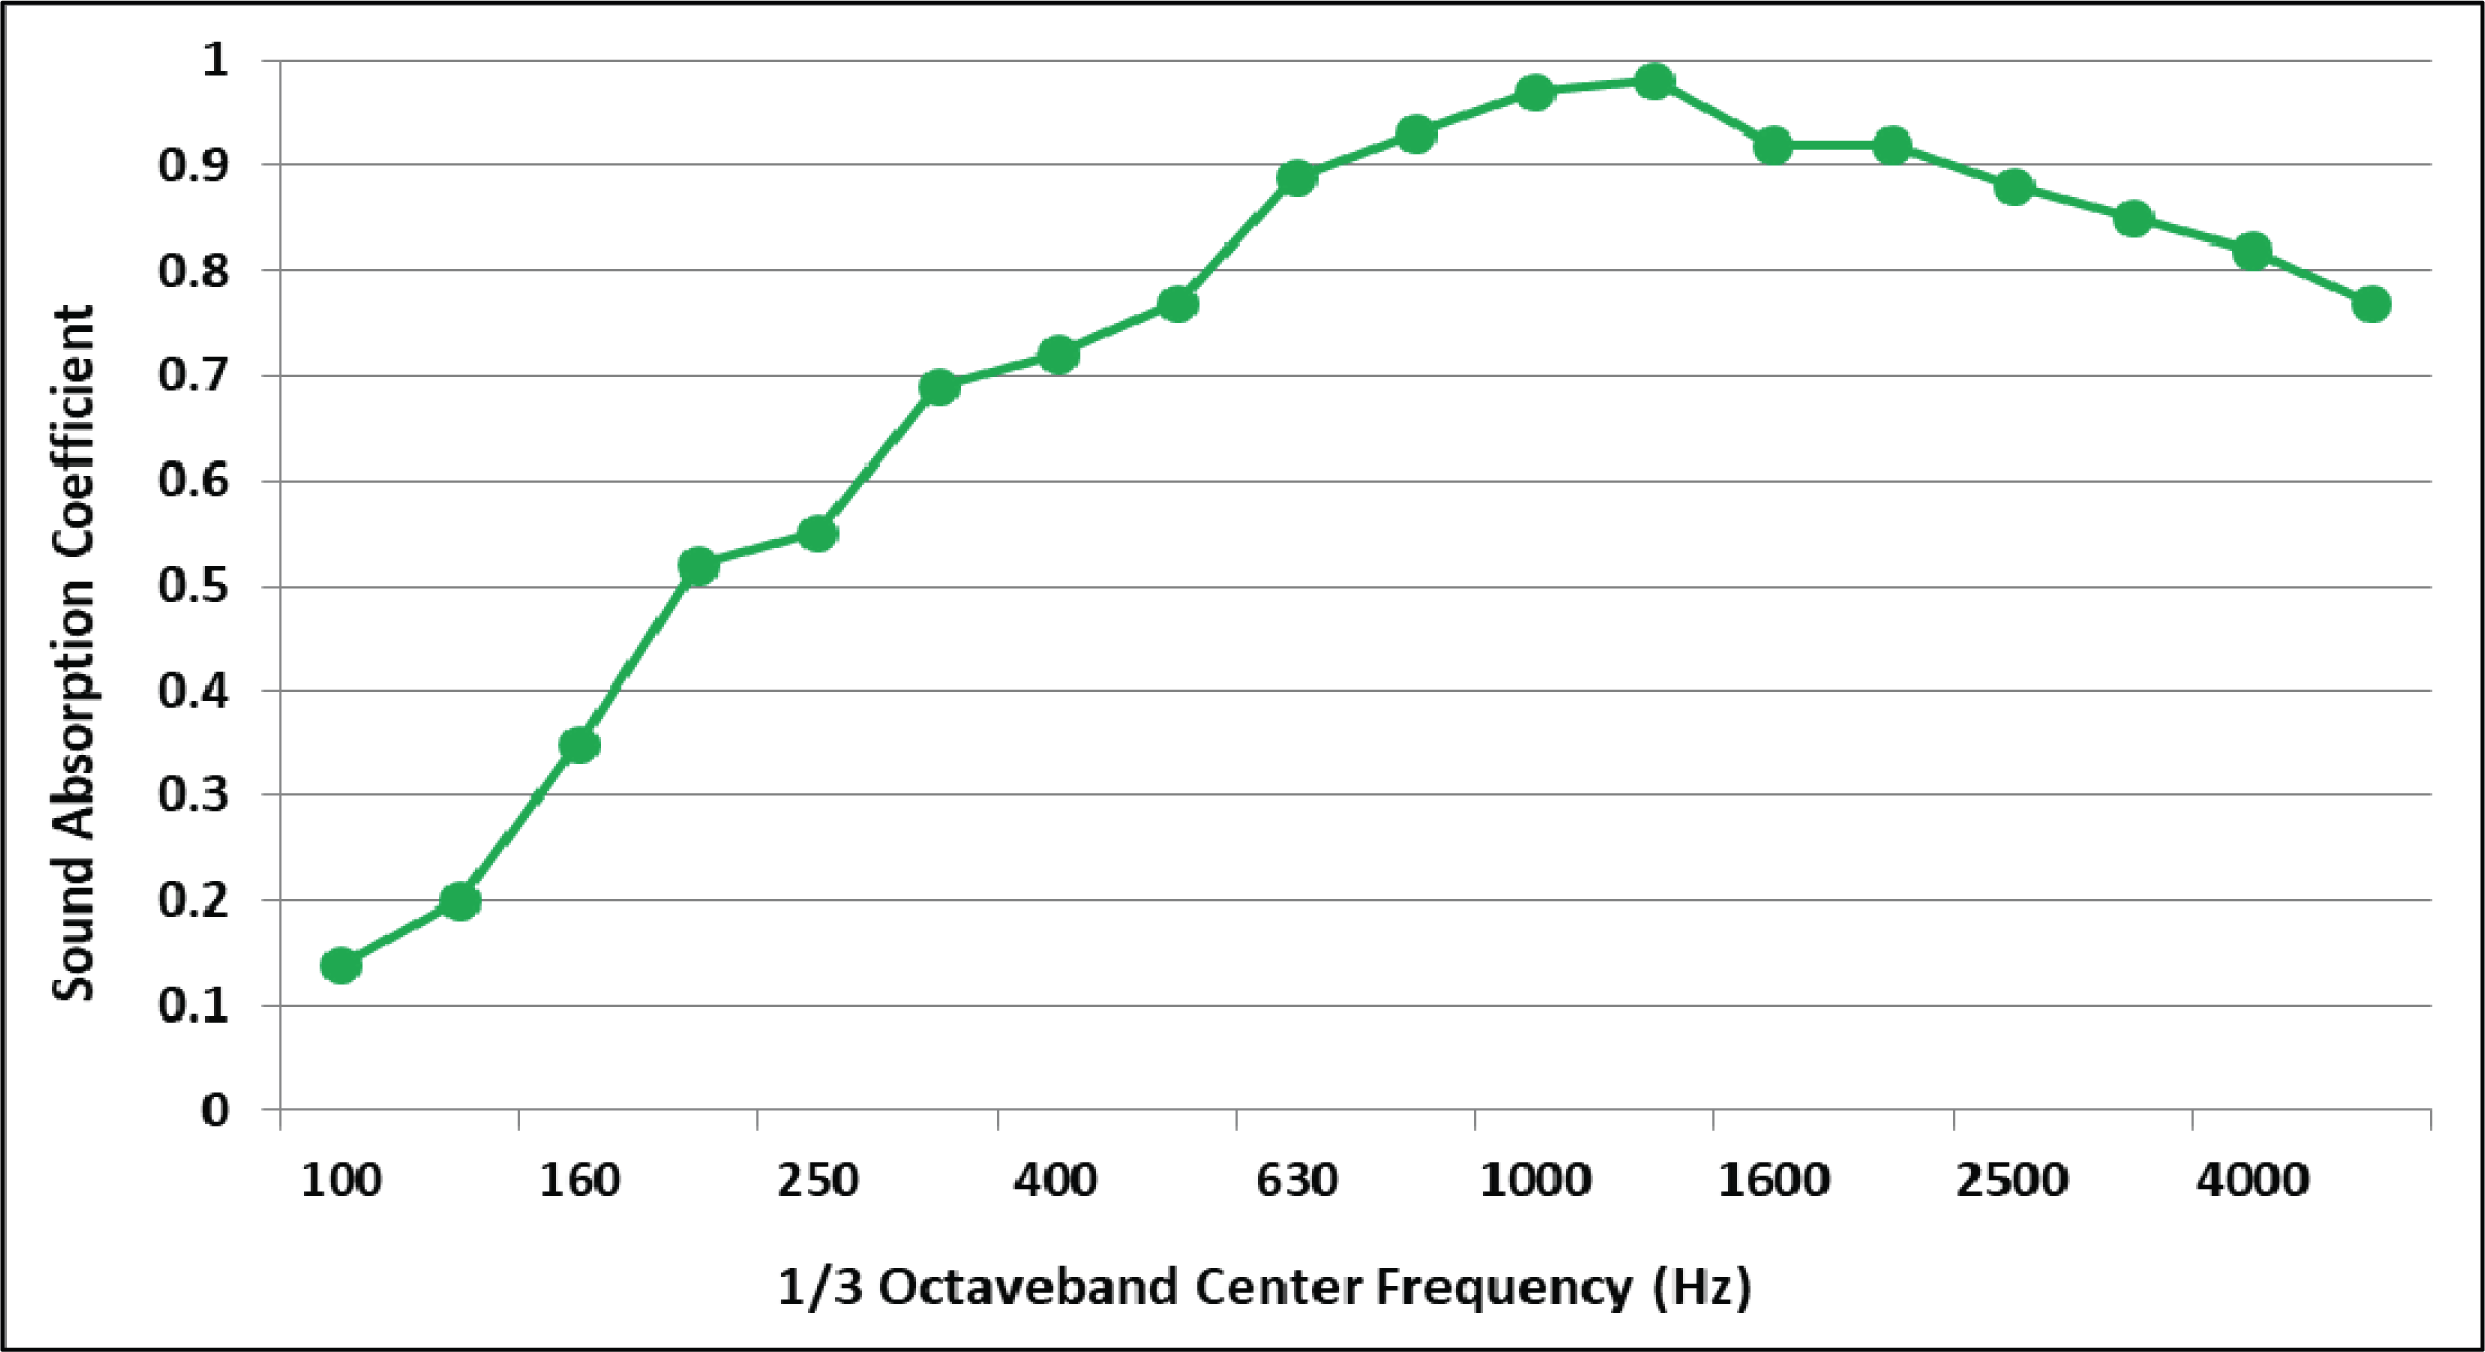
In a frequency analysis of highway noise at Kyongbu-line (Ansung I.C.-Chonan I.C.), the noise of an Ascon paved highway was maximized around 1000 Hz (Kim et al., 2012). At this frequency, the sound absorption coefficient of the rice straw mat was 0.97, meaning that almost all of the 1000-Hz noise was removed. Therefore, the rice straw matting is a suitable candidate material for soundproof walls erected along highways.
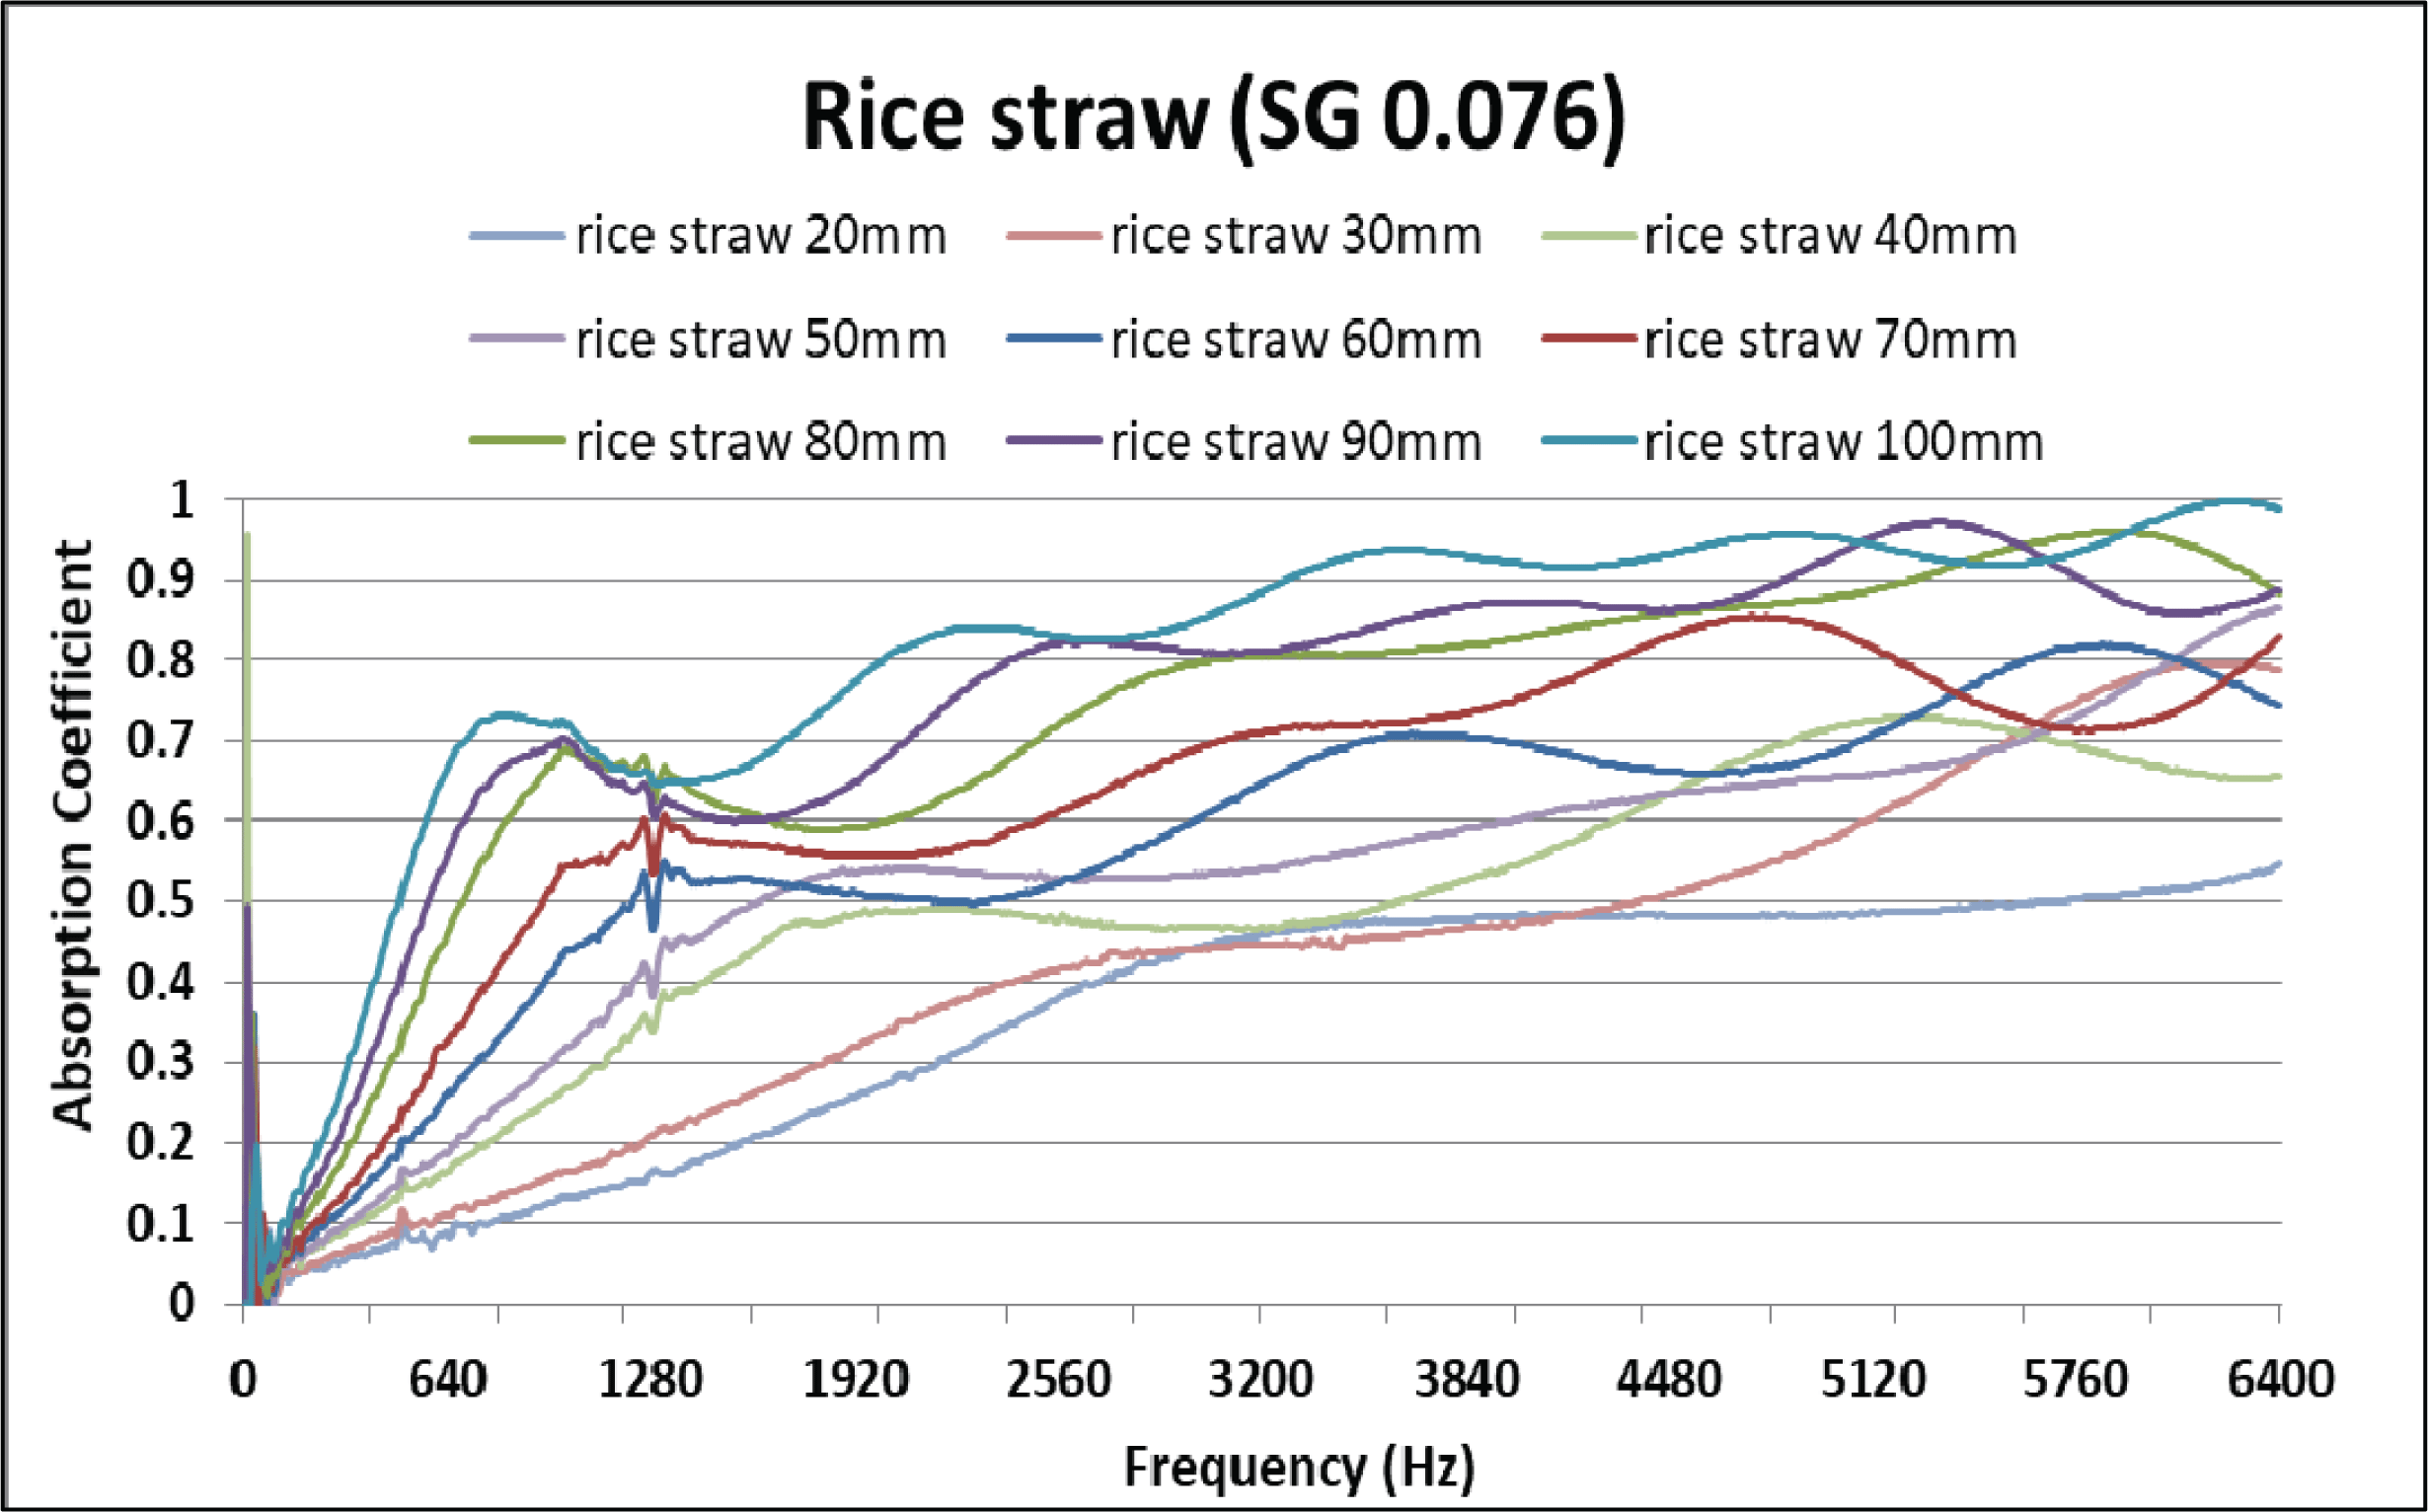
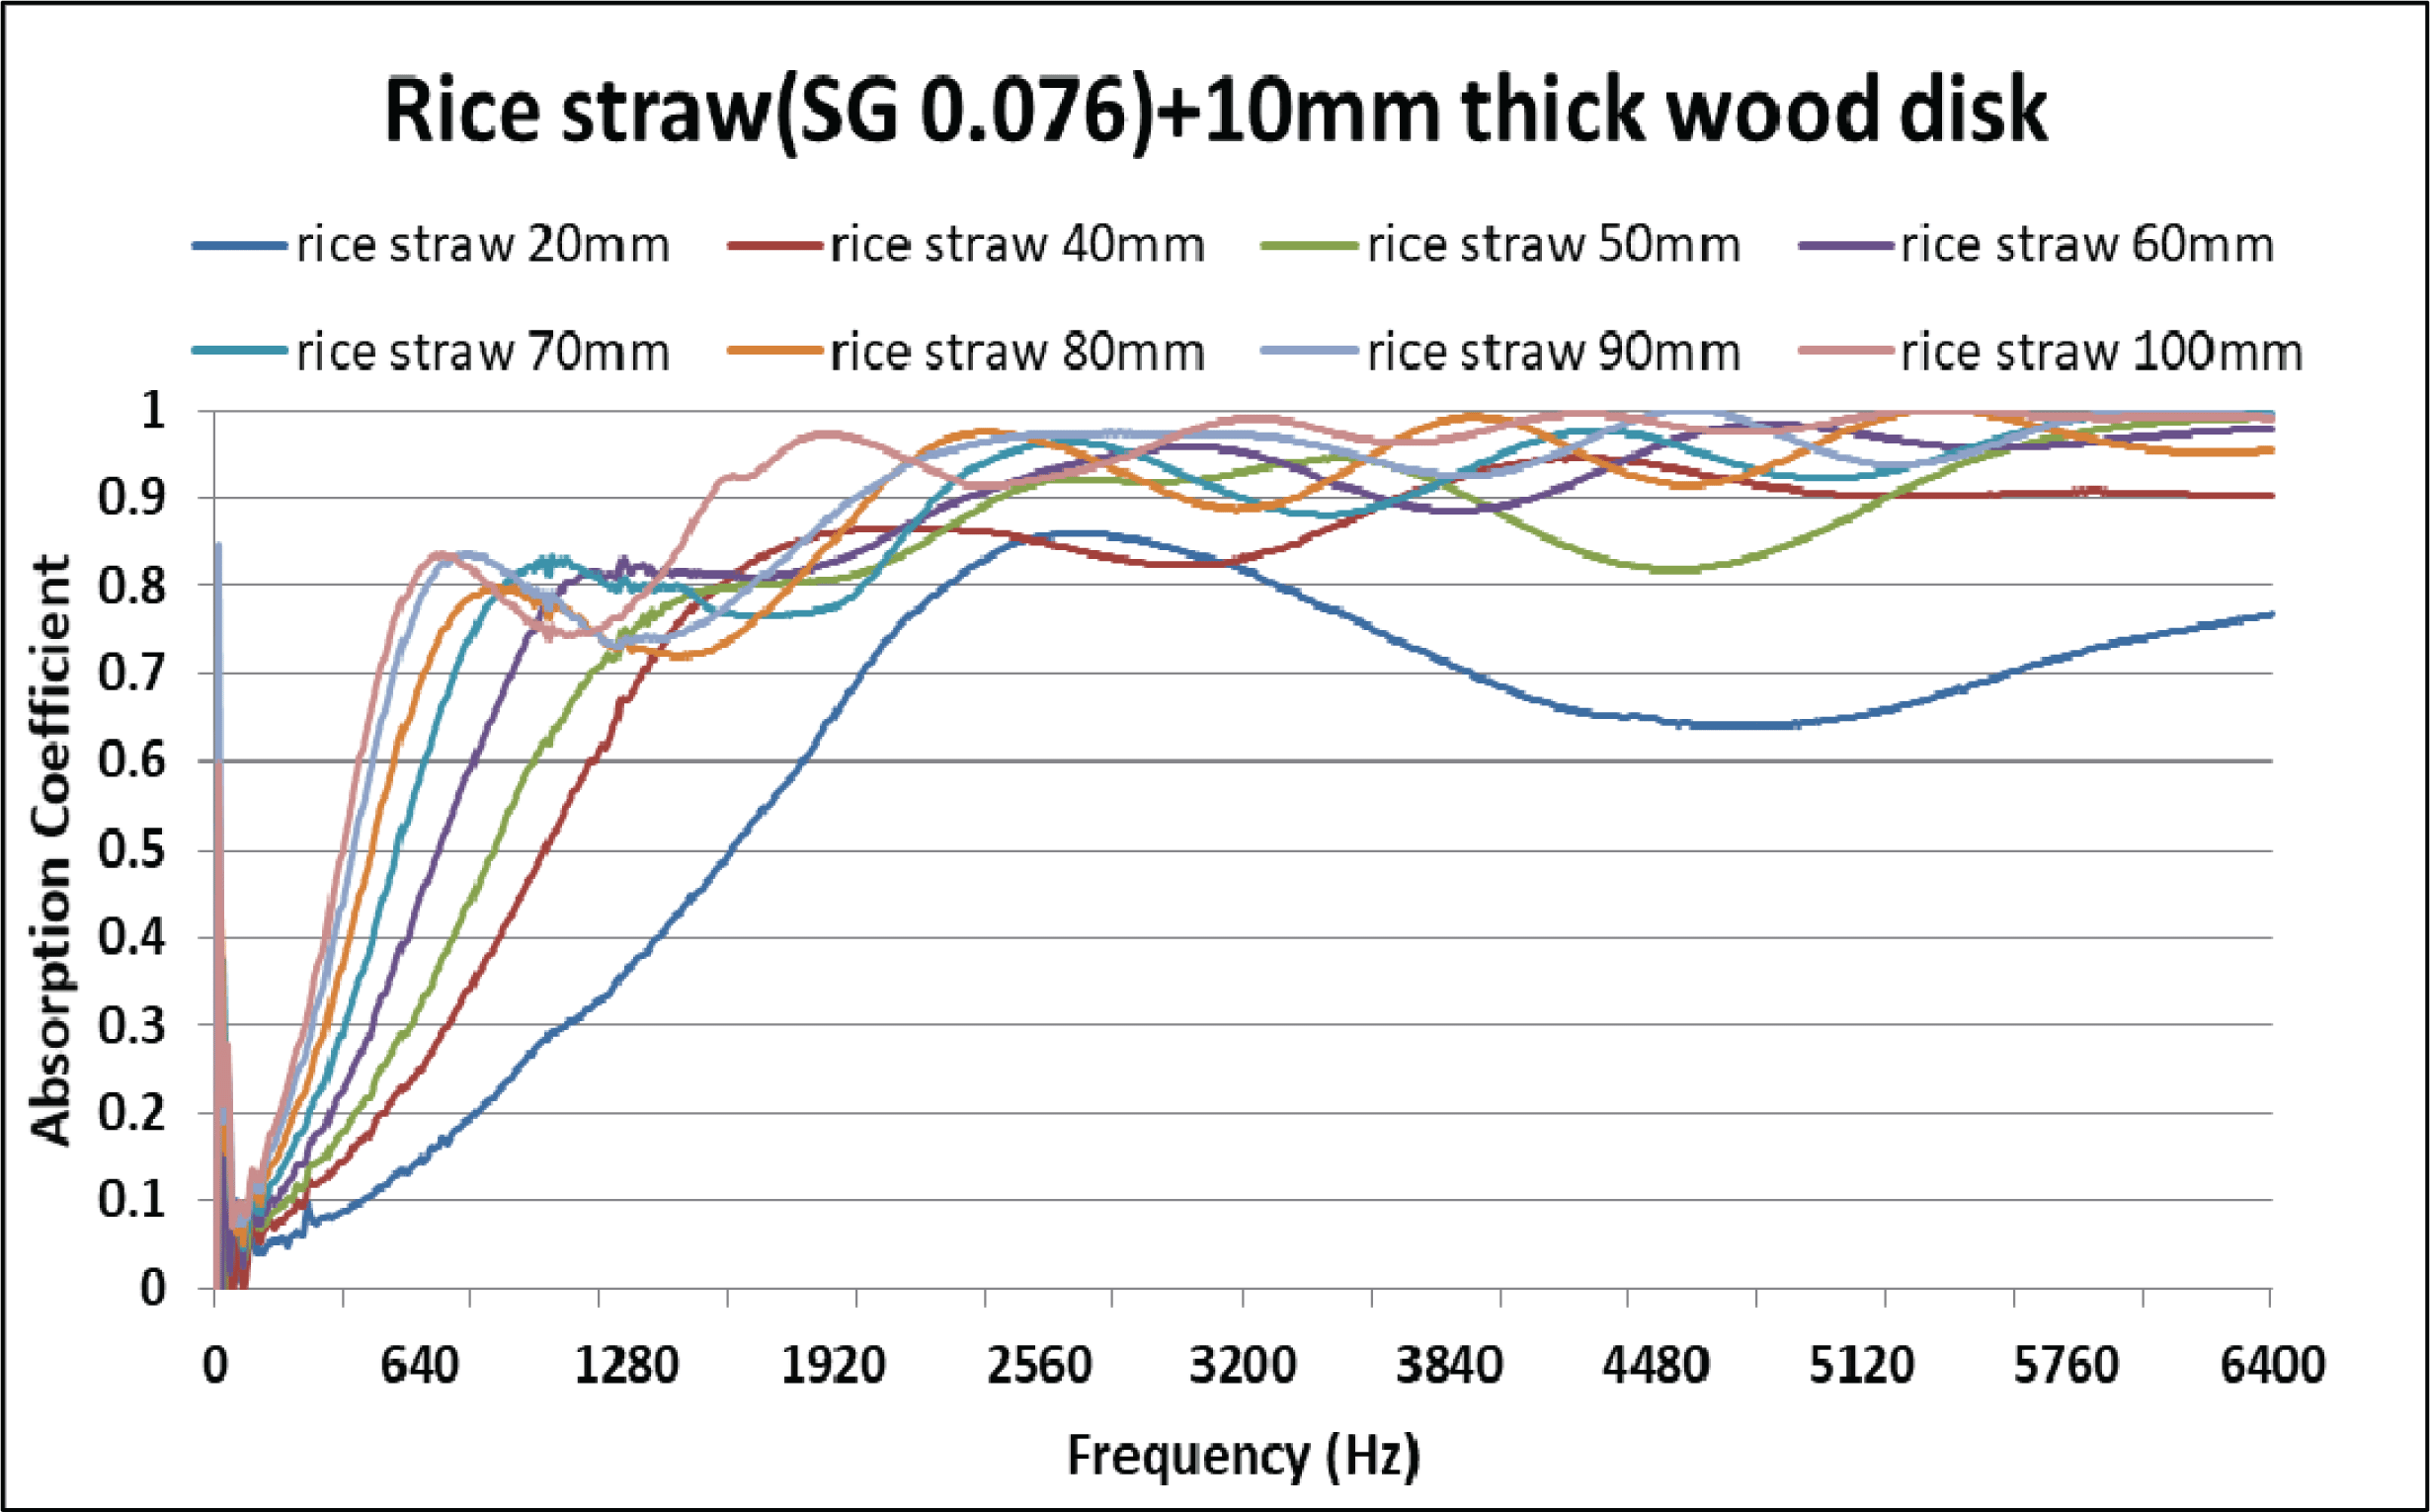
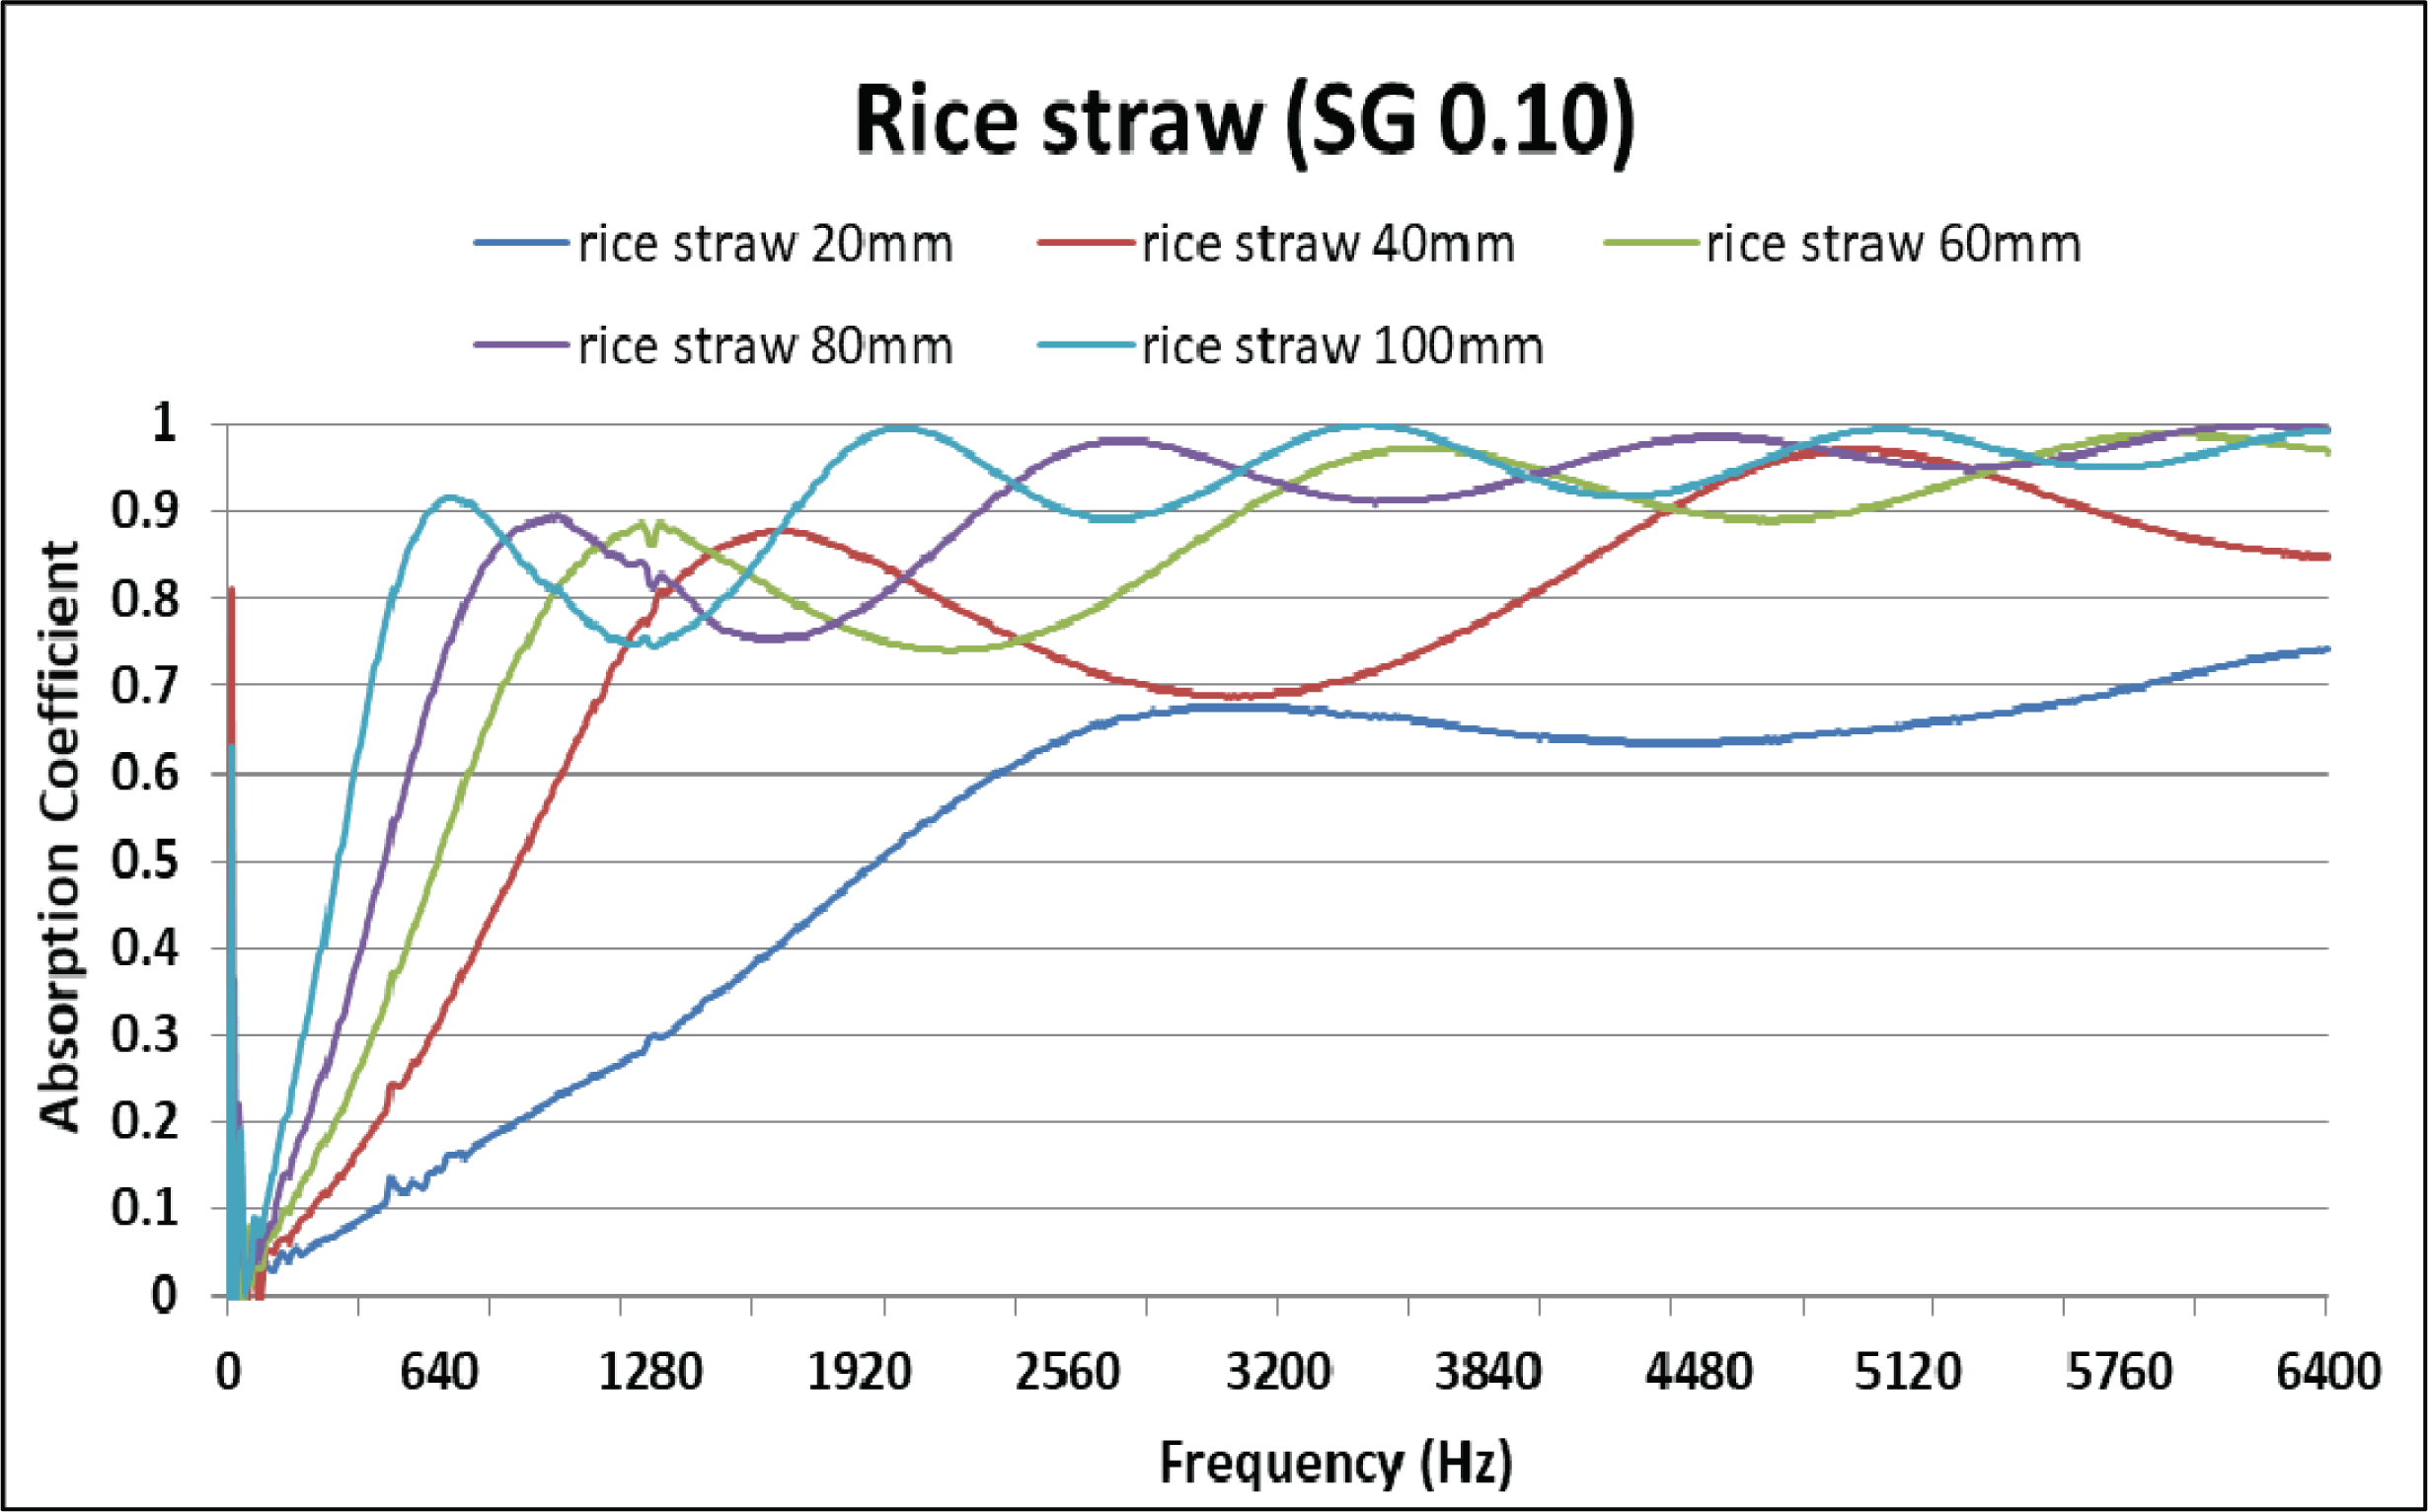
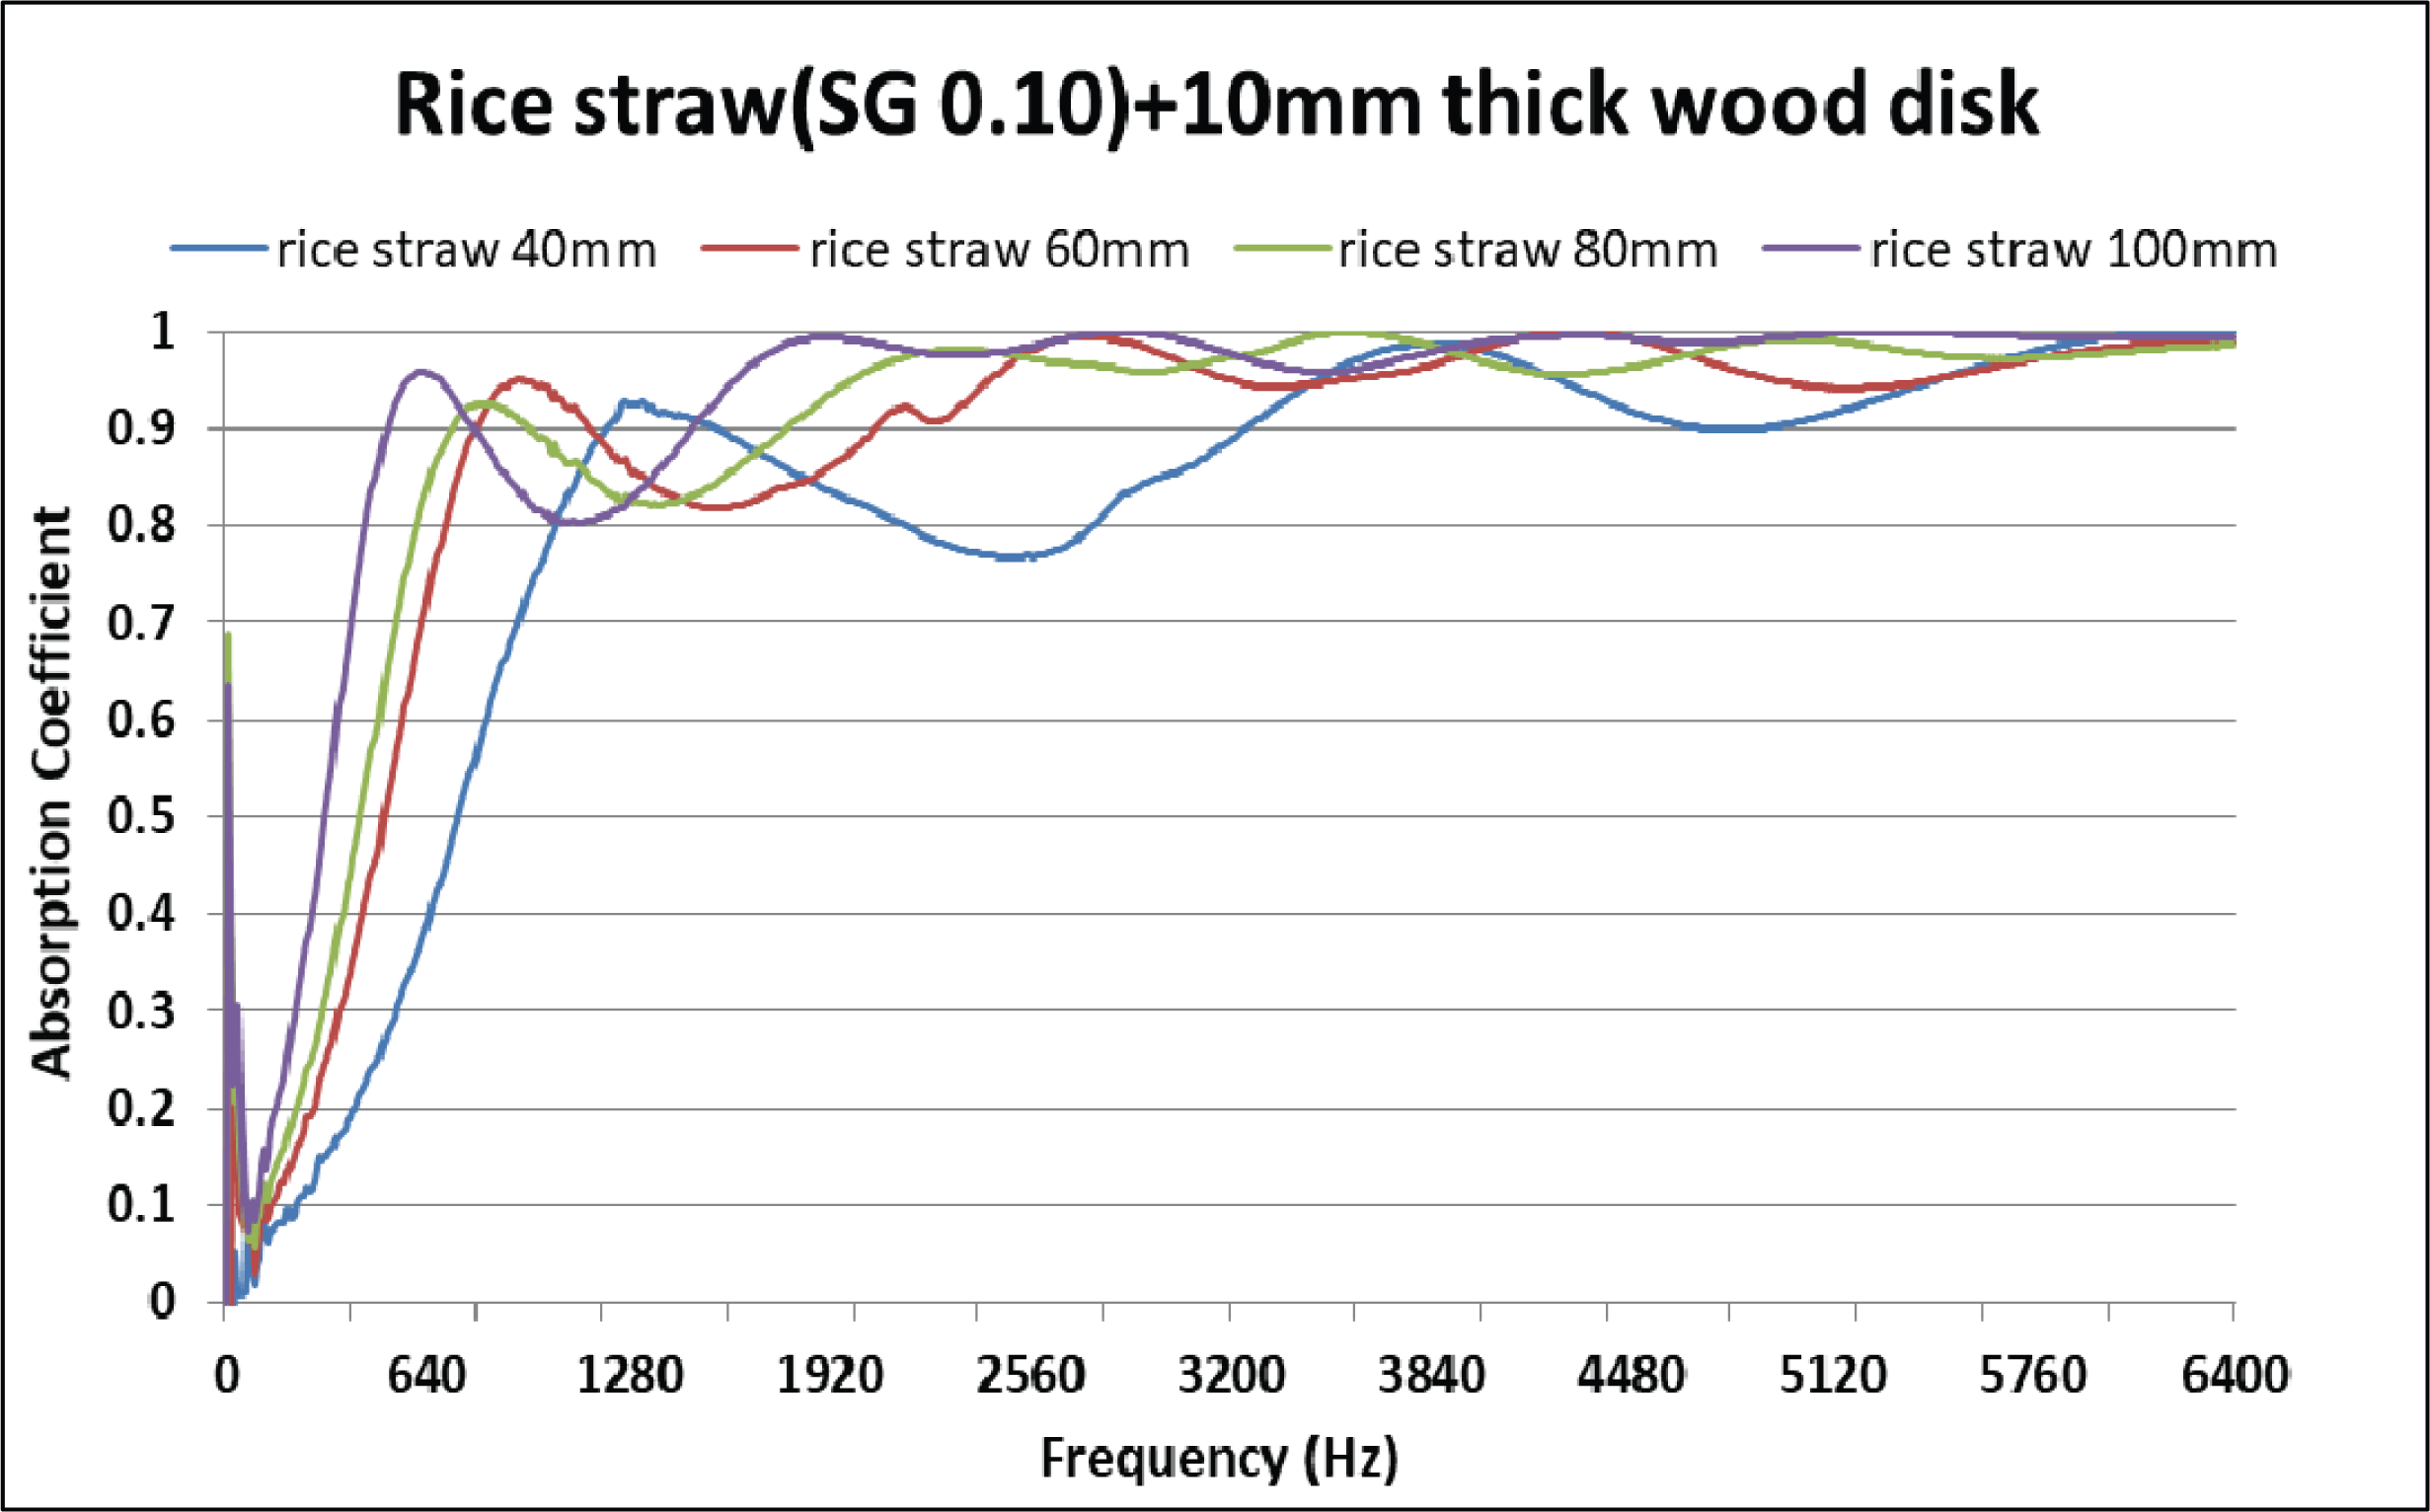
Sound absorption rates of rice straw mats of different densities and in the presence and absence of a poplar log cross-section, estimated by the transfer function method in the 500-6400 Hz frequency range, are presented in Figs. 5-8. Whereas the reverberation room method measures the sound absorption at discrete frequencies, the frequency axis (x-axis) in the transfer function method is continuous, because this method detects white noise covering all frequencies in the measuring range. The sound absorption coefficients estimated by the transfer function and reverberation room methods are directly comparable, because both values are corrected by the environmental conditions. As shown in Figs. 5 and 7, increasing the mat thickness from 20 mm to 100 mm and the mat density from 0.076 g/cm3 to 0.1 g/cm3 increased the sound absorption rates from 0.1 to 0.65 at frequencies below 1000 Hz, and from 0.1 to 0.95 at frequencies above 1000 Hz. The sound absorption rate of the dense 100 mm-thick mat was 0.95 at 2000 Hz. This indicates that the sound absorption rates are increasing functions of frequency, thickness, and material density, as observed in typical porous materials. In the 100 mm-thick rice straw mat with a density of 0.12 g/cm3, the sound absorption rates exceeded 0.8 at frequencies above 500 Hz, reaching 0.95 at 800 Hz. These results suggest that after adjusting their thickness and density, rice straw walls can provide excellent soundproofing control of highway noise. In the 100 mm-thick rice straw mat with a density of 0.12 g/cm3 and affixed with a 10 mm-thick yellow poplar log cross-section, the NRC was 0.77, similar to that obtained by the reverberation room method (0.8; see Figs. 6 and 8).
4. CONCLUSION
The sound absorption rates of rice straw mats exposed to random incident noise were measured by two methods: the reverberation room method and the transfer function method. This study compared the measurements of both methods. The results are summarized below:
Both methods yielded similar noise reduction coefficients of the rice straw mats. The noise reduction coefficient of the 100 mm-thick rice straw mat with a density of 0.12 g/cm3 and affixed with a 10 mm-thick yellow poplar log cross-section was 0.77 in the transfer function method, and 0.8 in the reverberation room method.
Owing to their high sound absorption rates at typical highway frequencies, the rice straw mats are promising candidates for highway-soundproofing walls.


