1. INTRODUCTION
An air-dry density of wood is one of the most basic physical properties influence on mechanical properties of wood. After being conducted an experiment, for that reason, the air-dry density of wood has been essentially measured by using various methods. The gravimetric method has been commonly used to measure an air-dry density by calculating the ratio between mass and volume of wood in the equilibrium with the atmospheric condition. The method has advantages for calculating an air-dry density with high accuracy and easy way. However, it is time-consuming process to make small specimen avoiding any defects such as knot, resin, etc. from a test material.
Nondestructive test and evaluation (NDT&E), of which advantage is analyzing physical properties of wood without any damage to a test material, can replace the gravimetric method. It has been reported that various NDT&Es can be determined an air-dry density of wood (Goy et al., 1992; Hoffmeyer and Pedersen, 1995; Bucur, 2013). Also, there are various studies reported how X-ray can be used to determine wood density since the radiation method was first conducted by Phillips (1960). In wood science, monochromatic X-ray, which has single photon energy, was usually used to conduct measurement of wood density. The wood density easily can be measured by the amount of absorption as described by the Lambert-Beer’s law when monochromatic X-ray used.
In wood industry, however, polychromatic X-ray having a bundle of broad spectrum of X-ray energy is mainly used practically. The polychromatic tubes are not only lower in cost than monochromatic radiation equipment but also simple reliable tools (Kaelble, 1967). Few studies, however, have been conducted to establish attenuation characteristics of wood although the polychromatic tubes and detection technology has been highly developed. Kim et al. (2006) revealed that mass attenuation coefficients (MACs), which represent a characteristic of X-ray absorption, were changed by penetration depth in wood when polychromatic X-ray and film were used. Kim et al. (2014) also confirmed that wood species and penetration depth affected on the change of MAC when polychromatic X-ray and digital detector was used. However, there was a point in dispute to derive the MAC of wood because the MAC gained from regression analysis.
In this study, an equation of Lambert-Beer’s law with probability function of polychromatic X-ray was introduced to calculate MACs of wood. Before calculating MACs of wood, values associated with the probability function of polychromatic X-ray were also determined. Lastly, air-dry densities of wood were measured and the accuracy of measurement was verified.
2. MATERIALS and METHODS
Small specimens from three species - Korean pine (Pinus koraiensis Sieb. et Zucc.), red pine (Pinus densiflora Sieb. et Zucc.) and Japanese larch (Larix kaempferi C.) - were prepared in this study. The number of specimens was ten per species. Five dimensional lumbers were used to make small specimens per each species. Each specimen had dimensions of 20 × 50 × 200 mm (thickness × width × length). Average air-dry density of Korean pine, pine and larch was 0.40, 0.52 and 0.58 g/cm3 while average moisture content of that was 8.3, 9.4 and 9.4%, respectively.
X-ray tube named K-4 (Softex, Japan) was used, and it generates polychromatic X-ray by being struck high velocity electrons at target metal (tungsten) with anode angle of 19 degrees. The maximum voltage and current of tube was 64 kV and 5 mA. Three tube voltages of 35, 45 and 55 kV and one tube current of 5 mA were used for experiment. Digital detector, EVS4343 (DRtech., Korea), was used to gain X-ray projections. A scintillator of the detector is made of cesium. Active area and pixel pitch of detector was 430 × 430 mm and 140 μm, respectively. The projections were directly saved in a laptop as DICOM format files.
When monochromatic X-ray penetrates a material, a transmitted X-ray intensity can be estimated by the Lambert-Beer’s law as follow,
where, Imono is a transmitted X-ray intensity (μGy), I0 is an initial X-ray intensity (μGy), μ is MAC (cm2/g), ρ is an air-dry density (g/cm3), and t is a penetration depth in wood (cm). In case of polychromatic X-ray, however, the Lambert-Beer’s law is not valid because the digital system has energy dependent efficiency. This energy dependency had to take into account as weighting factors which were associated with X-ray energy in a broad spectrum of wavelength (Nishihata et al., 2012; Lifton et al., 2013). The relation between an initial polychromatic X-ray intensity (I0) and a transmitted X-ray intensity (Ipoly) could be expressed by the following equation,
where, S(E) is an X-ray beam spectrum, D(E) is an energy dependent detection efficiency, μ(E) is an MAC of wood for energy E (cm2/g). Energy E referred to a total intensity of initial polychromatic X-ray. The weighting factors related with X-ray beam spectrum and energy dependent detection efficiency could be combined as a probability function. The probability function in Eq. (3) was taken by doing integration by parts of Eq. (2) as follow,
where, W(E) is a probability function. Various studies to calculate the probability function have been reported. The difference between previous and this study was that we didn’t get the whole function of probability function but calculate only the integral value of probability function according to tube voltages and penetration depths with experimental method. The integral value of probability function must be constant less than 1. As the μ(E) ρt is a constant, Eq. (3) could be simple with α (the integral value of probability function) as Eq. (4),
The natural logarithm of Eq. (4) was used to calculate the integral value of probability function and MAC of wood,
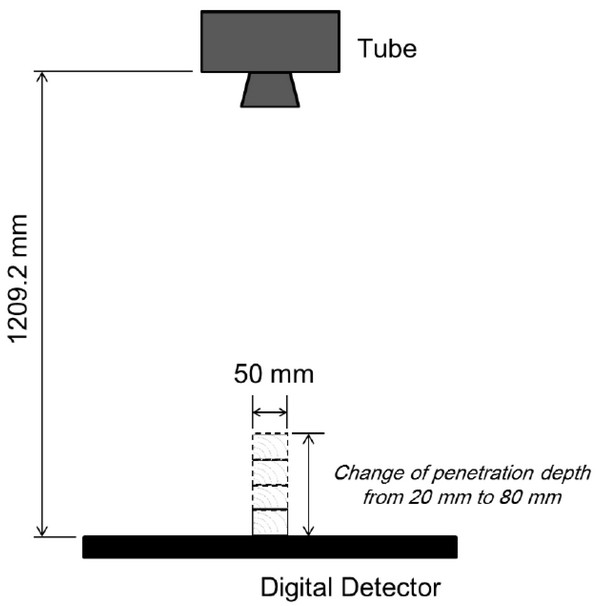
Fig. 1 shows the schematic drawing for taking projections, and the distance between the tube and detector was set to 1209.2 mm. Penetration depths of X-ray were changed by altering the number of specimens from one to four, and range of the depths was from 20 mm to 80 mm. Air-dry densities of wood blocks were also calculated by using air-dry density of each specimen, of which air-dry density was measured by the gravimetric method. Total number of projections in accordance with the depths of 20, 40, 60 and 80 mm was 10, 25, 25 and 25 per each species and tube voltage. These projections were examined to determine the ratio of initial to transmitted X-ray intensities. The details for this procedure to determine the ratio can refer to Kim (2016).
All results of the penetration depth, air-dry density and ratio of initial to transmitted X-ray intensity were divided into two groups; group A and B. Firstly, group A was used to calculate the integral value of probability function and MAC. The number of results in group A was 5, 15, 15 and 15 at penetration depth of 20, 40, 60 and 80 mm per each species and tube voltage, respectively. Secondly, group B was used to verify an accuracy of estimated air-dry density with polychromatic X-ray and digital detector. The number of results in group B was 5, 10, 10 and 10 at each penetration depth per each species and tube voltage. Eq. (6) derived from Eq. (5) was used to determine air-dry density,
where, μ(E) was obtained from the results of group A.
3. RESULTS and DISCUSSION
The 150 projections for three species in group A were analyzed to calculate integral values of probability function. The integral value of probability function is related with polychromatic X-ray spectrum and energy dependent detection efficiency as presented in Eq. (2). The value could be affected by characteristic of X-ray source, detector or transmitted X-ray intensity. Therefore, the 150 projections were investigated according to tube voltage and penetration depth. Fig. 2 is an example showing relations between natural logarithm of ratio of initial to transmitted X-ray energy and wood quantity, which was a product of air-dry density and penetration depth. The y-intercept denotes a natural logarithm of the integral value as shown in Eq. (5).
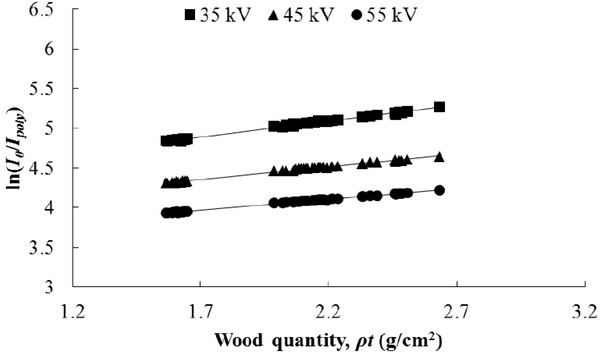
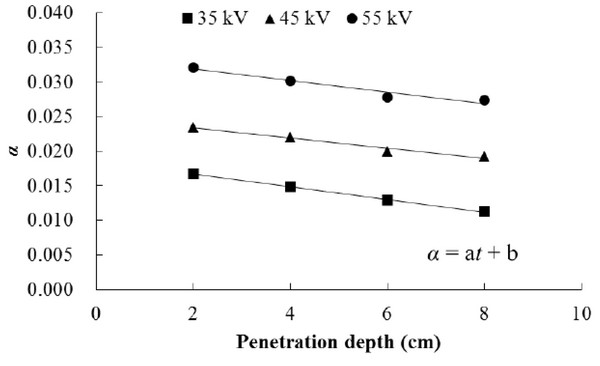
Fig. 3 shows linear regression of the integral values in each condition. And Table 1 indicates the coefficients of the regression. The integral value of the probability function decreased as the penetration depth increased. The probability of activating a detector by transmitted X-ray could decrease as penetration depth increased for same condition of tube voltage; because more reduced X-ray intensity has less probability to excite a detector, which is in accordance with the energy dependent detection efficiency. On the contrary, the integral value was positively correlated with change of the tube voltage. Waggener et al. (1972) reported that X-ray spectra from 25 to 110 kVp tube voltage and effective energies of polychromatic X-ray, which designate ability to compare with monochromatic X-ray. It was founded that the effective energy increased as the tube voltage increased. Therefore, there is a high possibility of stimulating a detector when high tube voltage was used.
| Tube voltage (kV) | A | B | ||||
|---|---|---|---|---|---|---|
|
|
|
|||||
| a | b | R2 | c | d | R2 | |
| 35 | -0.00091 | 0.01848 | 0.99 | 0.5414 | 0.0734 | 0.99 |
| 45 | -0.00074 | 0.02487 | 0.97 | 0.3763 | 0.0444 | 0.98 |
| 55 | -0.00083 | 0.03351 | 0.94 | 0.3233 | 0.0394 | 0.94 |
The linear regressions of integral value according to penetration depth in each tube voltage were used to calculate MAC or air-dry density. The integral value played role as weighting factor in the Lambert-Beer’s law. It was different when the Lambert-Beer’s law in monochromatic X-ray or gamma ray was used to predict transmitted X-ray energy or to calculate MAC of materials. Thus, the integral value or probability function must be investigated when the Lambert-Beer’s law was used to establish attenuation characteristic of polychromatic X-ray in material. It meant that pre-test to gain the weighting factor should be conducted when the polychromatic X-ray system with digital detector was applied to a process of quality test of wood. The weighting factor could be different as what kind of tube source or digital detector had been used.
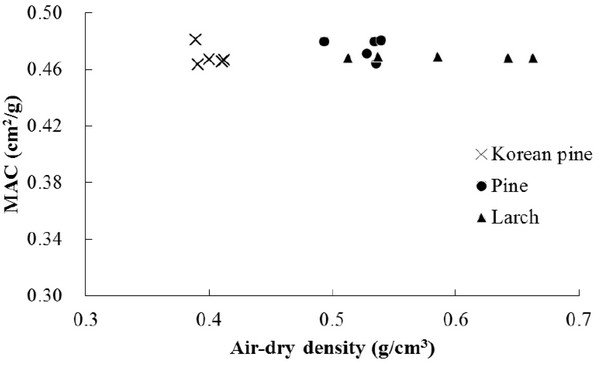
Effect of species on MAC of wood was investigated. The 15 projections for three species of penetration depth of 20 mm at 35 kV tube voltages were analyzed to calculate the MACs according to species and to confirm the effect. Fig. 4 shows the MACs of three species; Korean pine (average of MAC: 0.4688 cm2/g, standard deviation: 0.0070 cm2/g), red pine (average of MAC: 0.4754 cm2/g, standard deviation: 0.0072 cm2/g) and larch (average of MAC: 0.4688 cm2/g, standard deviation: 0.0006 cm2/g). The statistical results of t-test with 95% confidence interval about Korean pine-red pine, red pine-larch and larch-Korean pine indicated that there is no significant difference between species. The p-values of two-tail of Korean pine-red pine, red pine-larch and larch-Korean pine were 0.175, 0.075 and 0.981, respectively. The researches of determining the MAC of wood have been conducted by many authors using X-ray or gamma ray. However, results of MAC for different species were inconsistent. Malan and Marais (1992) confirmed that the difference in chemical composition cause variation in the MAC between and within wood. Meanwhile, changes in volume percentage of cellulose, hemicellulose and lignin were not influenced on the MAC (Lindgren, 1991). Moreover, Olson et al. (1988) reported that an ash element in wood did not have significant effect on a calculation of wood density as larger elemental weight fractions such as Carbon, Oxygen, and Hydrogen have a main role in calculation of wood density. The MACs of wood were not influenced by the species as well in this study.
From the projections of 150 in group A, Fig. 5 shows the relations between MAC and penetration depth and tube voltage. The species did not take into consideration because it was confirmed that the species did not affect change of MAC of wood. The MAC of wood decreased as the penetration depth increased. When the Lambert-Beer’s law with weighting factor was used to calculate the MAC, the results were consistent with previous studies (Kim et al., 2006; Kim et al., 2014). It was considered that beam hardening of polychromatic X-ray caused the change of MAC according to the penetration depth. Lower energy parts tend to be attenuated more severely than high energy parts in polychromatic X-ray (Brooks and Di Chiro, 1976). The proportion of high energy parts would be increased as the length of polychromatic X-ray propagation in a material increased. It means that transmitted polychromatic X-ray became harder as penetration depth increased. Therefore, the ratio of initial to transmitted polychromatic X-ray was not exactly proportional to the penetration depth in wood. Table 1 summarizes the coefficient of regression about the MAC. The function of MAC with penetration depth at various tube voltages was induced to reflect the beam hardening in wood. The change of MAC according to penetration depth was greater at the condition of low tube voltage (35 kV). Poludniowski et al. (2009) reported that the proportion of low energy parts in polychromatic X-ray increased as a tube voltage decreased. Therefore, it was confirmed that the change of MAC of wood according to the penetration depth was more distinct at lower tube voltage condition than at higher tube voltage condition.
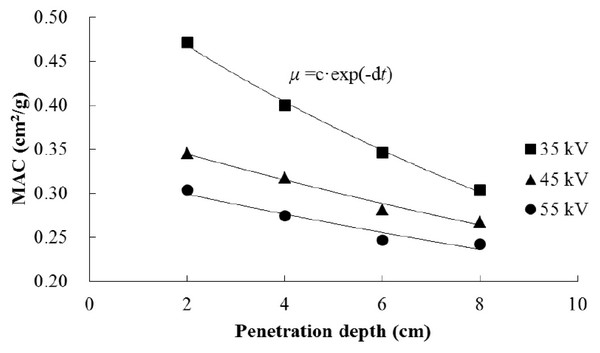
Fig. 6 shows the comparison between the measured air-dry density and the estimated air-dry density. The measurement of air-dry density was gained by using the gravimetric method, while the estimated value was obtained by conducting analysis of taken X-ray projection. It was shown that the integral value and the MAC of wood were influenced by the penetration depth in wood and tube voltage although species did not affect the variance of the MAC. Based on the results, air-dry density of wood in group B was evaluated by using the relationship of the integral value and MAC according to penetration depths at each tube voltage. Calculation of density of the specimens in group B was conducting by using Eq. (6). Even though the estimation had been conducted to wood having various penetration depths and air-dry densities, the accuracies of the estimation were pretty high at each tube voltage. When calculation of root mean squared error (RMSE) was performed to check the accuracy, RMSE of 35, 45 and 55 kV was 0.010, 0.013 and 0.009 g/cm3, respectively.

Although there was little difference in overall RMSE for all tube voltages, partial RMSE in relation to air-dry density was varied according to tube voltage. The partial RMSE below air-dry density of 0.41 g/cm3 was 0.008 g/cm3 when tube voltage of 35 kV used. On the other hands, the partial RMSEs gained by using tube voltage of 45 and 55 kV were equal to 0.012 g/cm3. It means that the estimation of accuracy below the air-dry density of 0.41 g/cm3 was the highest when tube voltage of 35 kV was used. However, the partial RMSE above air-dry density of 0.41 g/cm3 decreased as applied tube voltage increased. Compared with the partial RMSE above the air-dry density according to tube voltage, the accuracy of estimation in tube voltage of 55 kV was higher than other conditions. Therefore, an operator who is going to manage X-ray radiation system composed of polychromatic X-ray source and digital detector should select proper X-ray intensity according to what he want to exam, especially air-dry density. Based on these results, the estimation of air-dry density by using polychromatic X-ray and digital detector can supplant the gravimetric method. If the integral value and MAC of wood are determined precisely or a condition of examination is chosen properly, the accuracy of estimation is quite high.
4. CONCLUSION
Revised Lambert-Beer’s law was induced to quantify air-dry density by using polychromatic X-ray and digital detector. The probability function was used as weighting factor in the Lambert-Beer’s law. There are many researches to obtain a probability function, but alternative method was used in this study to determine the weighting factor as the integral value. The relation of integral value was taken at various penetration depth and tube voltage, and then the regression of MAC also was determined under same conditions. Finally, estimation of air-dry density was conducted by using the Lambert-Beer’s law with the integral value and the MAC. The way with polychromatic X-ray and digital detector has high accuracy. Moreover, it is fast, cheap and may have been applied at process of making wood product. It seemed that the polychromatic X-ray method can be substituted for gravimetric method to measure air-dry density of wood.


