1. INTRODUCTION
Timber is crucial in improving the green environment due to being a renewable material with smaller CO2 emissions during construction than other building materials (Duan et al., 2022; Harte, 2009). A study reported that a ten-storey timber-concrete hybrid building showed significant reductions of self-weight by approximately 30% and base shear by 27%–37%, then produced 65% less emissions compared to the concrete building (Zhang et al., 2023). Through photosynthesis activities, timber is the only construction material that can offset the CO2 in the atmosphere and store the Carbon in fibers. Recently constructed multi-storey timber buildings such as Brock Commons Tallwood House in Vancouver, Hoho Tower in Vienna, and the planned W350 Timber Skyscraper in Tokyo signified the trend of global preference toward more sustainable and eco-friendly building constructions.
Excellent engineering properties, specifically strength-to-weight ratio, promote satisfactory performance of timber and engineered products in earthquake-prone regions (Awaludin et al., 2018, 2024). Connections in timber structures mainly consist of metal connectors or l fasteners, which play an essential role as a source of ductility and energy dissipation mechanisms (Awaludin, 2018). In tall buildings, timber is commonly combined with other materials such as concrete or steel. Tall hybrid systems such as timber-concrete or timber-steel hybrid buildings are in use and have been proven for earthquake-resistance performance (Badal and Tesfamariam, 2024; Dias et al., 2016; Stepinac et al., 2020). This hybrid system enables composite action, increases composite strength, as well as suppresses the durability and service-life limitation of the timber structures when exposed to outdoor environment conditions.
Engineered products such as cross-laminated timber (CLT) and glued laminated timber (glulam) have been increasingly manufactured to support mass-engineered timber buildings in many regions worldwide. Glulam is an innovative solution to problems of lumber cross-section dimension and length limitation that solid timber beams currently face (Hendrik et al., 2019; Park et al., 2020). This method facilitates a combination of laminas from different species as well as produces timber sections with better homogeneity often consider an evitable problem in solid wood as a natural product, fewer defects, and improved mechanical properties. Meanwhile, CLT is the newest engineered wood product prepared from gluing together layers of solid-sawn lumber in which each layer is oriented perpendicular to the adjacent layers forming panel-size structural elements superior in terms of dimension stability as well as stiffness in both axes of the in-plane direction (Ha et al., 2023; Jang and Lee, 2019; Jung et al., 2020; Kang et al., 2019; Kim et al., 2024; Song and Kim, 2023; Yang et al., 2021). In mass-engineered timber buildings, glulam is used as beams or column components, and CLT serves as bearing walls or floors/horizontal diaphragm components (Abed et al., 2022; Hasani and Ryan, 2022; Tulebekova et al., 2022).
Glulam production using Indonesia tropical timber species was largely investigated in recent decades (Darwis et al., 2014; Hadi et al., 2021; Hadjib et al., 2015; Herawati et al., 2008; Komariah et al., 2015; Kusnindar et al., 2018; Lestari et al., 2018; Mohamad et al., 2019; Ngadianto et al., 2020; Prabuningrum et al., 2020; Pranata et al., 2020; Sulistyawati et al., 2008; Yoresta, 2014; Yuniarti et al., 2020). These tropical wood species were reported to include pine (Pinus merkusii), Jabon (Anthocephalus cadamba), Mangium (Acacia mangium willd), Sengon (Paraserianthes falcataria), African wood (Maesopsis emini Engl.), oil palm trunk (Elaeis guineensis Jacq.), Mahogany (Switenia mahagoni), Teak (Tectona grandis), Trembesi (Albizia saman), Merpauh (Swintonia floribunda), Jelutong (Dyera costulata), and Sesendok (Endospermum spp.), as shown in Table 1. Additionally, some investigations considered adhesive variation and lamellas delamination (Hadi et al., 2021; Herawati et al., 2008; Komariah et al., 2015; Lestari et al., 2018; Mohamad et al., 2019). Delamination is an indication of bond quality between lamellas and greatly influenced by many factors such as wood species, adhesive types, and manufacturing errors related to the amount of adhesive, curing condition, and pressure application. Based on previous studies, glulam production with hydraulic press machines generated less delamination compared to using a series of local pressure through pre-stressed steel rods, which might be caused by a non-uniform pressure due to insufficient stiffness of spreader steel beams. Few wood are considered fast-growing species, such as Sengon, Mangium, Pine, and Jabon, which ensure fulfillment of the sustainability requirement (Corpataux et al., 2020; Hadi et al., 2020; Karlinasari et al., 2018).
| Wood species | Density (kg/m3) | Types of adhesives | Young modulus (MPa) | Modulus of rupture (MPa) | Reference |
|---|---|---|---|---|---|
| Pinus merkusii | NA | Polyurethane | NA | 60.25 | Yoresta (2014) |
| 730 | Isocyanate | 10,600 | 86.20 | Lestari et al. (2018) | |
| Anthocephalus cadamba | 360 | Isocyanate | 5,500 | 46.10 | Lestari et al. (2018) |
| 320 | Isocyanate | 5,500 | 40.30 | Hadi et al. (2021) | |
| 425 | Strong epoxy | NA | 20.38 | Pranata et al. (2020) | |
| Acacia mangium | 560 | Isocyanate | 6,775 | 53.23 | Sulistyawati et al. (2008) |
| 530 | Isocyanate | 13,154 | 72.79 | Komariah et al. (2015) | |
| 430 | NA | 8,930 | 97.30 | Ngadianto et al. (2020) | |
| 610 | Isocyanate | 12,490 | 59.10 | Herawati et al. (2008) | |
| 700 | Isocyanate | 9,822 | 109.50 | Hadjib et al. (2015) | |
| Paraserianthes falcataria | 320–340 | Urea-formaldehyde resin | 2,947–5,070 | 38.90–55.60 | Kusnindar et al. (2018) |
| 270 | Isocyanate | 6,514 | 31.12 | Komariah et al. (2015) | |
| Maesopsis emini Engl. | 330 | NA | 6,820 | 72.70 | Ngadianto et al. (2020) |
| 440 | Isocyanate | 9,630 | 41.90 | Herawati et al. (2008) | |
| 390 | Isocyanate | 9,027 | 48.79 | Komariah et al. (2015) | |
| Elaeis guineensis Jacq. | NA | Tannin | 8,711 | 75.20 | Yuniarti et al. (2020) |
| 470 | Isocyanate | 4,000 | 27.80 | Prabuningrum et al. (2020) | |
| 360 | Isocyanate | 3,214 | 19.20 | Darwis et al. (2014) | |
| Swietenia mahagoni | NA | Tannin | 12,627 | 96.66 | Yuniarti et al. (2020) |
| Tectona grandis | 660 | Isocyanate | 8,777 | 137.20 | Ngadianto et al. (2020) |
| Albizia saman | 780 | Isocyanate | 6,490 | 93.10 | Hadjib et al. (2015) |
| Swintonia floribunda | 869 | Phenol resorcinol formaldehyde | 17,800 | 31.75 | Hadjib et al. (2015) |
| Dyera costulata | 492 | Phenol resorcinol formaldehyde | 9,990 | 41.33 | Mohamad et al. (2019) |
| Endospermum spp. | 487 | Phenol resorcinol formaldehyde | 9,410 | 33.64 | Mohamad et al. (2019) |
The above-mentioned studies mainly focused on glulam engineering properties, such as modulus of elasticity (MoE) and modulus of rupture (MoR), under bending tests. Table 1 shows the achieved glulam engineering properties originating from Indonesian tropical timber species. In terms of the properties, glulam beams composed of high-density lamina apparently have a high magnitude of MoE and MoR due to important factors including the production process, type of adhesive, and beam size. Glulam beams composed of more than one wood species were reported as an effort to increase both MoR and MoE (Komariah et al., 2015; Kusnindar et al., 2018; Lestari et al., 2018; Mohamad et al., 2019; Ngadianto et al., 2020) in addition to avoiding certain species domination capable of influencing resource availability.
Knowledge of commonly used tropical wood species is becoming critical as timber construction in Indonesia is continuously growing. Despite the great number of explorations on glulam production with Indonesian tropical wood species, no one thoroughly proposed and discussed constitutive model development to numerically evaluate the beam bending properties. The adoption of Hill’s orthotropic yield criterion method requires conducting a 2D finite element analysis (FEA) to simulate the load-deflection curve of glulam beams composed of single or mixed wood species under various loading configurations, including the four-point bending test configuration performed in this study. Material properties of each lamina, such as MoE, Poisson’s ratio, shear modulus, and tensile strength, are required in the FEA. This study focused on the experimental program, while the FEA part will appear in future investigations using the obtained experimental results.
2. MATERIALS and METHODS
Two tests were conducted in this study, namely the first group consisted of clear specimens from several wood species such as Jabon (Anthocephalus cadamba; density 359 ± 33 kg/m3), Mangium (Acacia mangium; density 584 ± 56 kg/m3; MC 10.77%), Bangkirai (Shorea obtusa; density 970 ± 30 kg/m3; MC 11.67%), Merbau (Intsia spp.; density 860 ± 36 kg/m3; MC 13.37%), Mahagony (Swetania mahagony; density 538 ± 13 kg/m3), Keruing (Dipterocarpus spp.; density 803 ± 54 kg/m3; MC 11%), Rubber wood (Hevea brasiliensis; density 682 ± 67 kg/m3), and Meranti Batu (Shorea palembanica Miq.; density 930 ± 30 kg/m3; MC 13.32%). The first group was performed according to EN 408 (CEN, 2012) as an effort to provide the engineering properties database required in FEA. This covered bending, compression parallel-to-grain, and tension parallel-to-grain tests in which ten replicates were prepared for each test of Jabon, Mangium, Mahagony, and Keruing, while five replicates were developed for each of the remaining wood species.
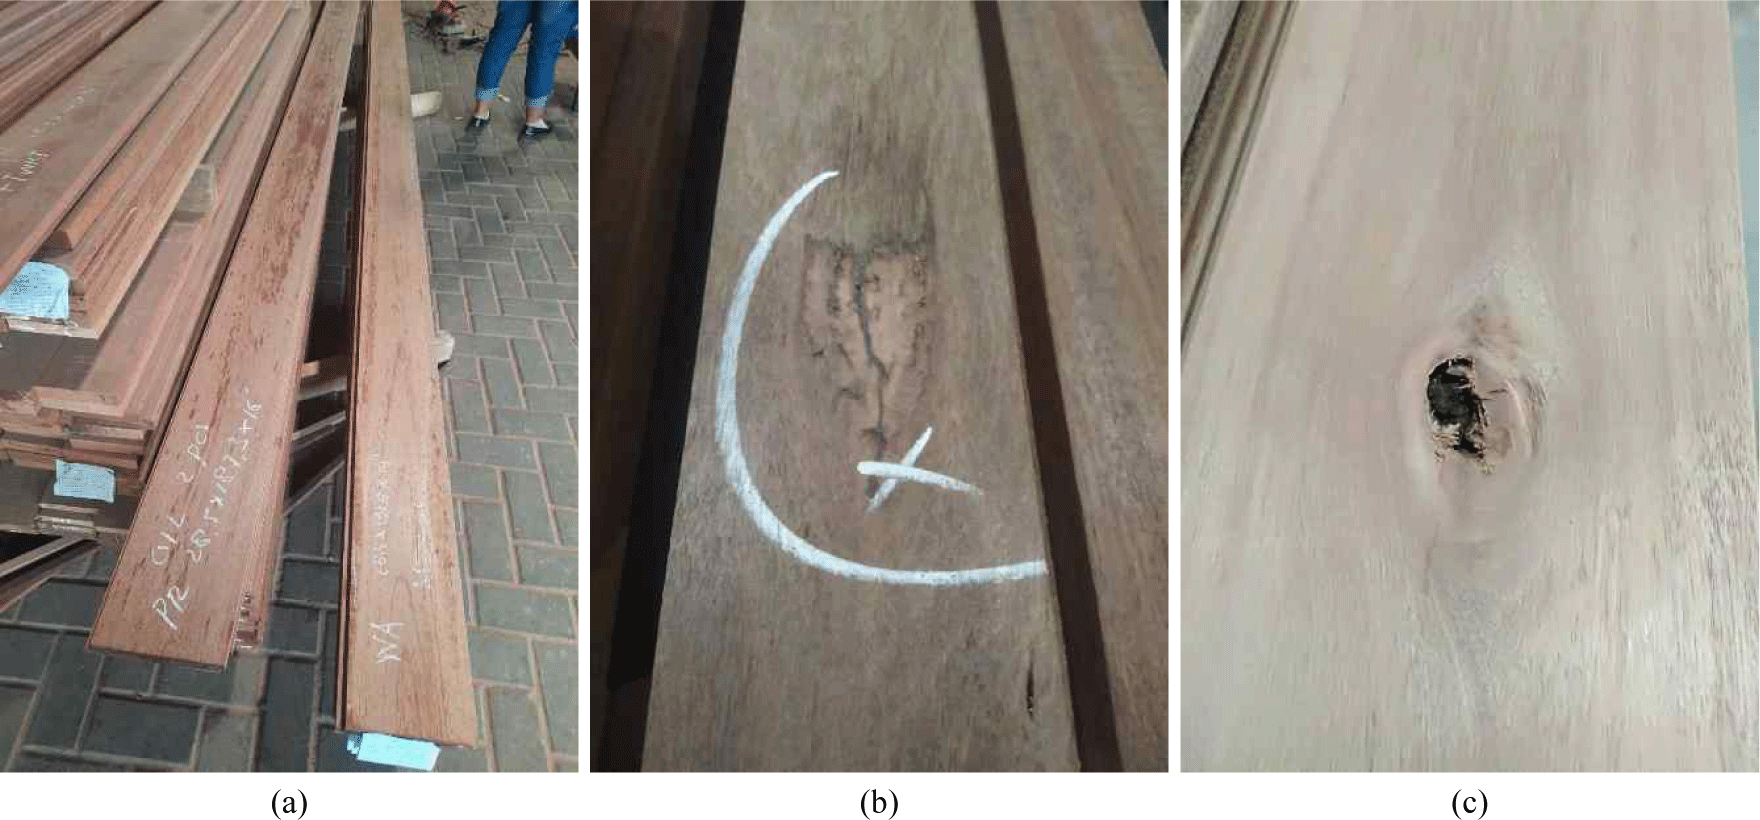
The second group is a four-point bending test of glulam beams, where only Jabon and Keruing species were considered. Fig. 1 shows the schematic of the four-point bending test configuration of glulam beams according to EN 408 (CEN, 2012). The beam cross-section dimension and other dimensions described in the test configuration are summarized in Table 2. For beams A and B, the span length-to-depth ratio was 17.5 and 17.4, respectively. Due to the size effect phenomenon in timber engineering properties, maximum focus is needed when using different span length-to-depth ratios considering that the bending strength increases as the ratio decreases (Kim et al., 2018). Six replicates were prepared for the Jabon glulam beams A and B, while eight replicates were prepared for the Keruing glulam beams A and B. Glulam beams of Jabon species were fabricated by Woodlam in Jakarta using polyurethane adhesive, and those of Keruing were produced by Buana Triarta in Semarang using phenol resorcinol formaldehyde adhesive. During glulam beam production, all laminas were visually assessed to the members containing defects such as insect damage, dead knots, rotten parts, splits, and oleoresin (only in Keruing laminas) from the following process. The size of knots, check, annual ring width, slope of grain, and limit values in laminas are defined by many standards, as well as the Korean Standard (KS F 3020; Korean Standards Association, 2023). Fig. 2 shows photos of wood defects found in the Keruing laminas provided by Buana Triarta.
| Beam name | b | d | L | a | c | h |
|---|---|---|---|---|---|---|
| A | 140 | 200 | 3,500 | 1,150 | 1,200 | 100 |
| B | 140 | 250 | 4,350 | 1,425 | 1,500 | 125 |
In this study, the load was generated using hydraulic pressure at a constant rate, transferred to glulam through the loading steel beam, and measured with a load-cell capacity of 100 kN. Glulam beam deflection at mid-span was measured using two linear variable displacement transducers (LVDTs) of 50-mm capacity and the final deflection was the average of these two LVDT measurements. All beam deflection measurements and the applied load were continuously recorded by a data logger connected to a personal computer. The test was terminated when the beam specimen collapsed or the applied load decreased by 15% of the maximum load, then the failure mode of each glulam beam was monitored and discussed.
In accordance with EN 408 (CEN, 2012), the MoR and MoE of glulam beams were evaluated using Equations (1) and (2), respectively. From the equations, Pmax is the maximum applied load measured by the load-cell, P0.4 represents 40% of the Pmax, P0.6 is 60% of the Pmax, D0.4 denotes the mid-span beam deflection corresponding to the applied load P0.4, D0.6 is the mid-span beam deflection corresponding to the applied load P0.6, while b, d, and L follow the definition provided in Fig. 1. Shear strength (τ) of glulam beams at the cross-section below the point load application corresponding to the maximum applied load is calculated using Equation (3). This is performed based on isotropic and elastic stress-strain relation, where I is the moment of inertia, Q represents the statical moment of area, and V is beam shear force equals to Pmax/ 2.
3. RESULTS and DISCUSSION
The results of the clear specimen test of wood species presented in Table 3 show that the average density of Bangkirai is the highest, followed by Meranti Batu, Keruing, Merbau, Rubber wood, Mangium, Mahogany, Meranti, Pine, and Jabon. All mechanical properties, MoR, MoE, tensile strength, and compressive strength parallel-to-grain are generally proportional to wood density, thereby increasing with higher wood density. Fig. 3 shows a typical load-displacement curve obtained from the clear specimens of Jabon, Keruing, Mangium, Meranti Batu, Bangkirai, and Merbau under tension and compression parallel-to-grain. The compressive strength was found to be significantly lower than the tensile strength. All specimens in tension tests failed because of sudden fiber fracture, and those in compression tests had stress softening after reaching the maximum load. Therefore, a linear stress-strain model is suitable to present timber material in the tension zone, and a bi-linear stress-strain model is essential to properly describe wood in the compression zone (Awaludin et al., 2019).
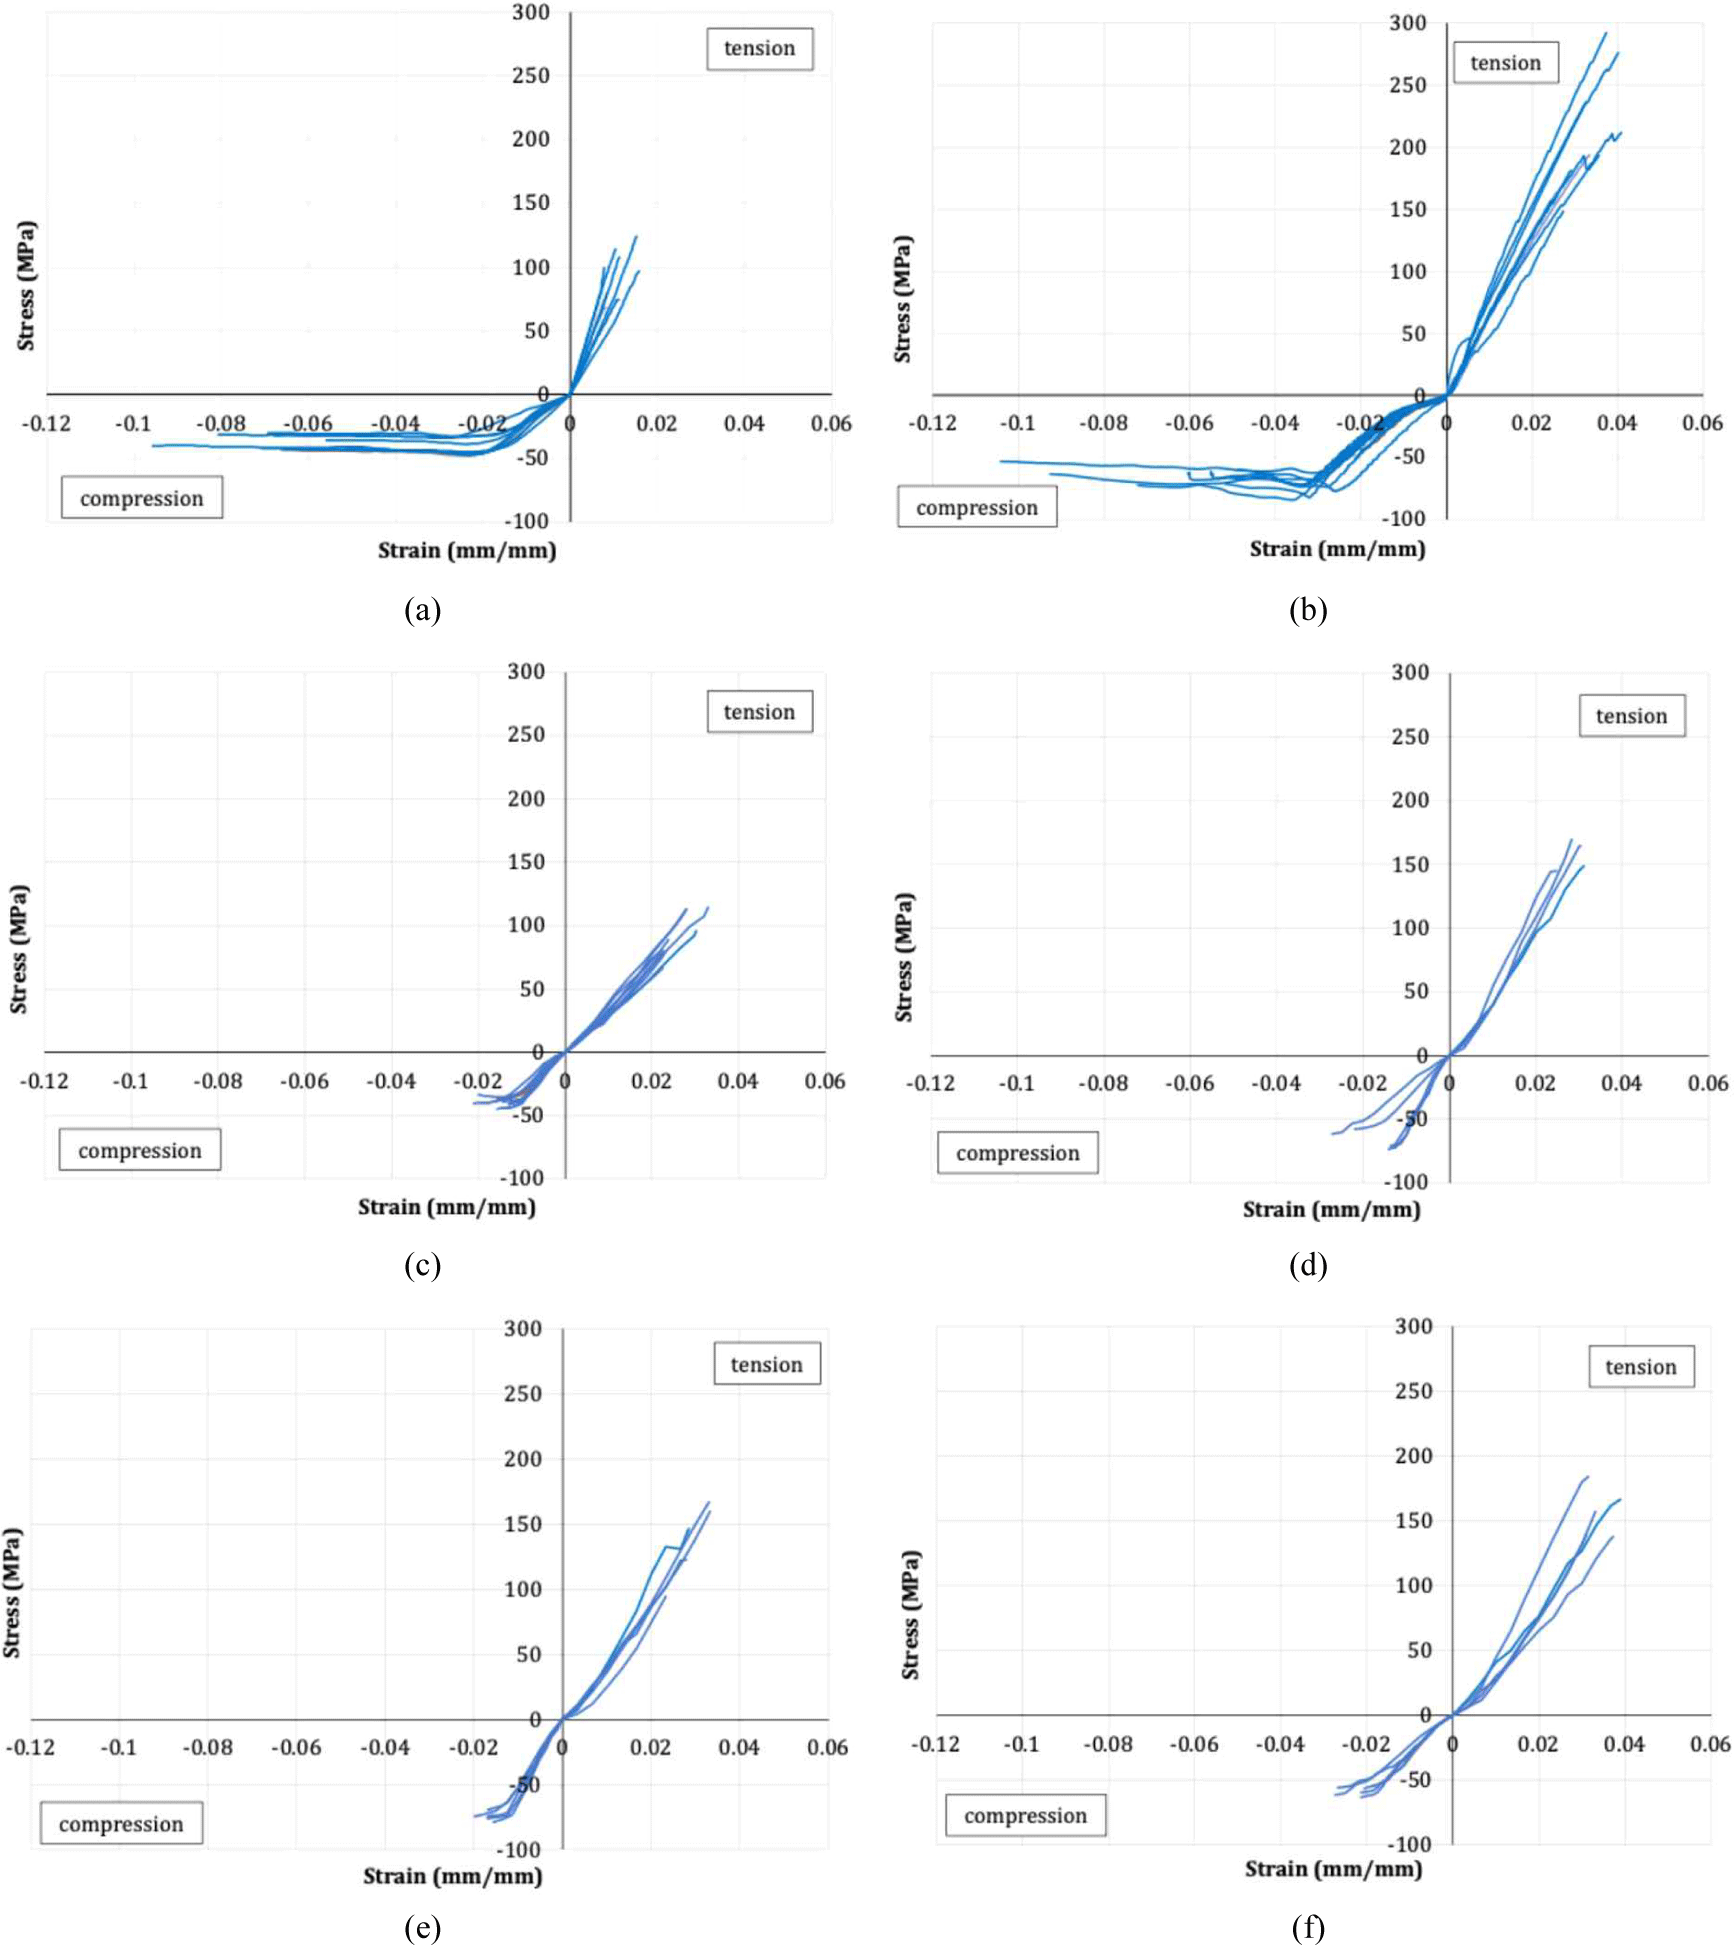
A significant variation in the magnitude of the mechanical properties occurred among the specimens in one timber species, specifically in the tension test (Fig. 3). This variation is attributed to wood being a natural product and often predicted by using many specimens. Another source of the large variation is ensuring the grain orientation of the clear specimen parallels the direction of the tension load. In most cases, this grain orientation is difficult to observe or not even visible in tropical wood species. Tensile strength data in Table 3 include an additional five replicates of Merbau, Bangkirai, and Meranti Batu as well as ten replicates of Keruing. In the future, more specimens will be required to establish a valuable and reliable database of these tropical wood species.
Fig. 4 shows the four-point bending test of Jabon glulam during initial loading and after reaching the maximum. The majority of the Jabon beams were not successful because of a combination of delamination between two adjacent laminas and tension failure at the mid-span of the beam, such as cross-grain lamina fracture at the vicinity of finger joints. Fig. 5 presents the schematic drawing of the Keruing glulam beam failures, which are similarly observed in Jabon. The red portion shown in Fig. 5 represents wood damage or failure area. Failure of the Keruing glulam beam A appears at the tension zone initiated by the failure of the finger joint glue line, followed by a cross-grain failure propagated from the tensile to the compression zone. This phenomenon was observed on KR-A2, KR-A3, and KR-A4 specimens. In the case of the KR-A1 beam, the cross-grain was not significant and could be categorized as a simple tension failure. Failure of glulam beam B was nearly identical to A, but the cross-grain in B was concentrated at the mid-span, and A had mode massive cross-grain failure.
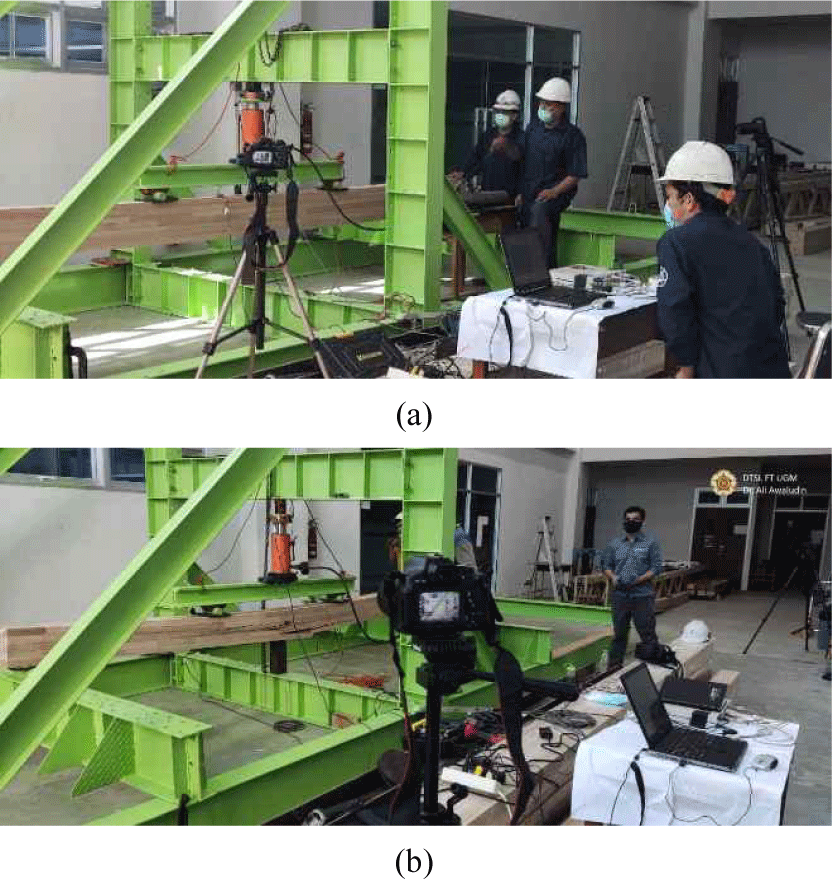
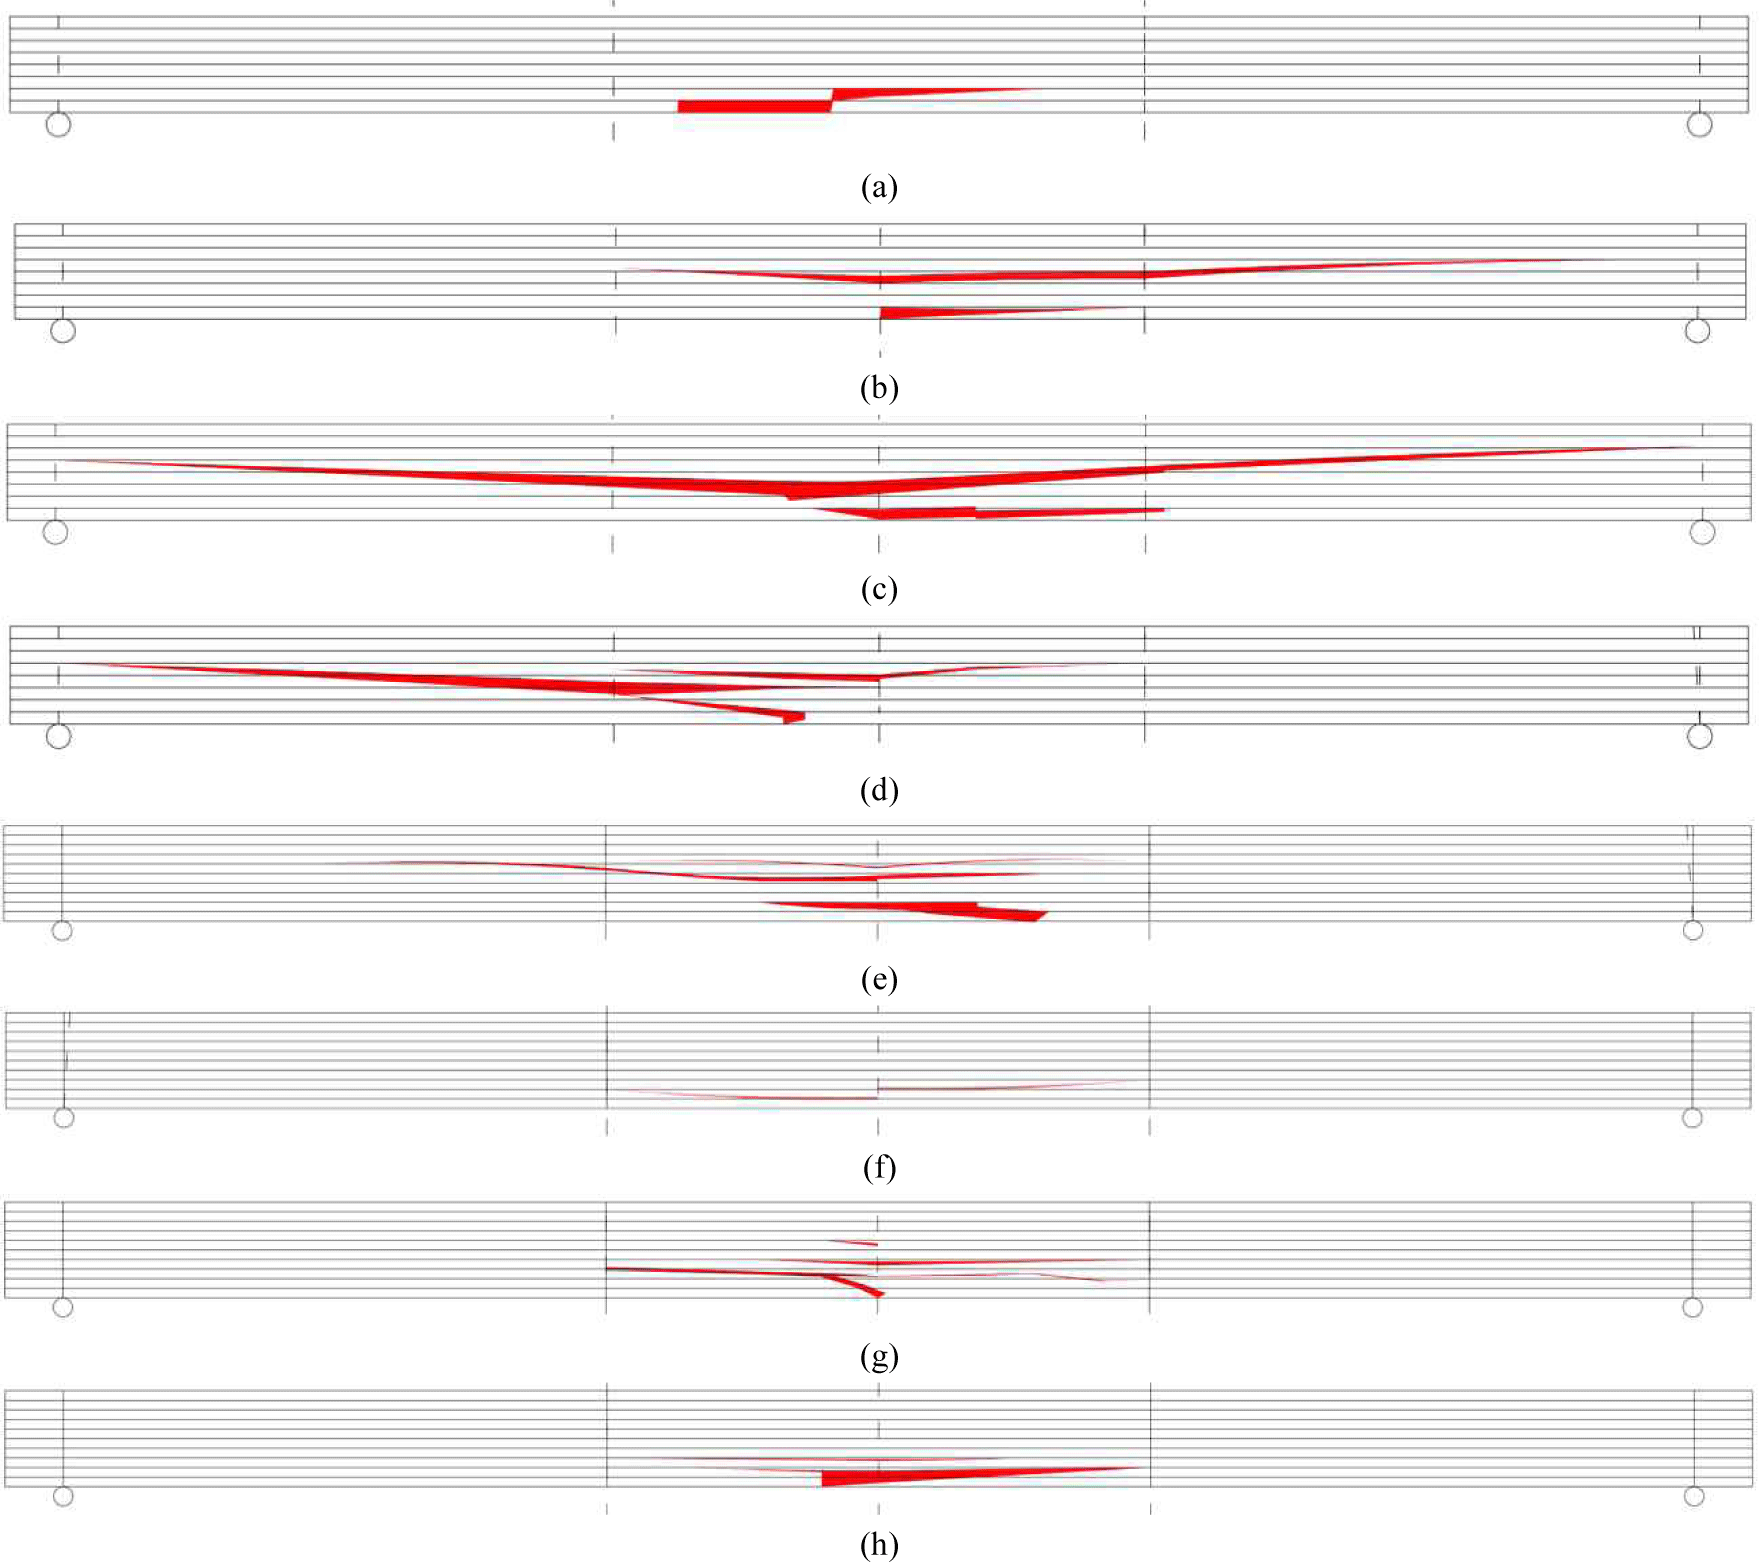
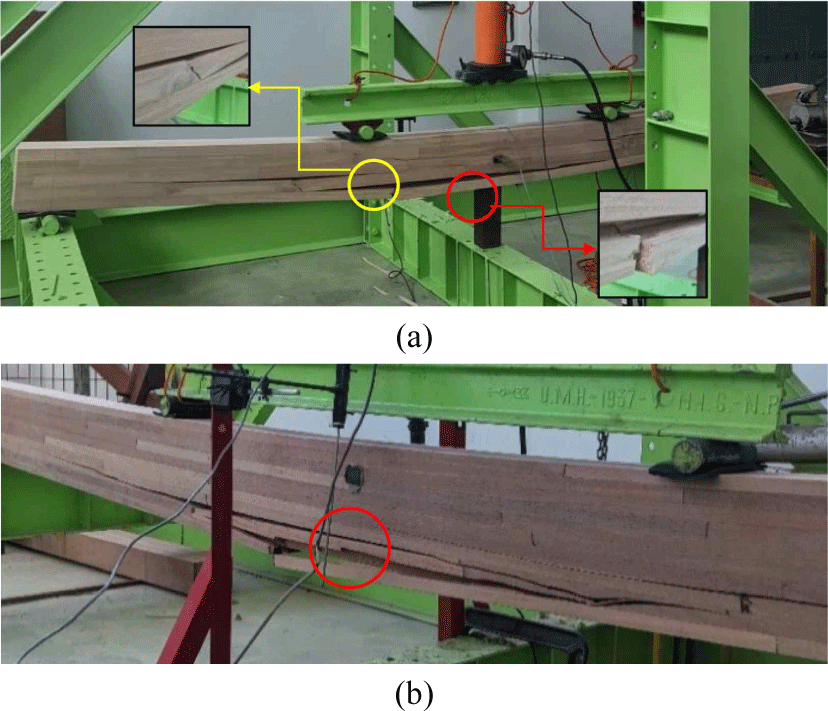
Fig. 6 shows a photo of glulam Jabon and Keruing beam failures observed in the tension zone of the finger joint vicinity (red circle), which becomes the weak link of the beams. In addition to finger joint fracture, lamina fracture is found in wood knot vicinity, as signified by the yellow circle [Fig. 6(a)]. Future production needs to improve the finger jointing method, and the presence of wood knots should be eliminated, specifically in the tension zone. Considering the significant variation of mechanical properties in one wood species, as discussed earlier, another recommendation is performing both visual and machine grading of each lamina to properly measure the strength quality.
Load-deflection curves obtained from the experiment are presented in Fig. 7(a) and (b) for the beams A and B, respectively. As expected, Keruing glulam beams had a stiffer curve and a higher maximum bending load compared to Jabon. However, the deflection measurement of two glulam beams of Jabon species [Fig. 7(a)] was not continued till failure load due to LVDT instrument safety considerations. All glulam beams of Jabon species (beams A and B) had only an elastic linear load-deflection curve before failure. Glulam of Keruing wood species, specifically beam A, had an in-elastic load-deflection curve after the linear part during initial loading. This in-elastic part of the load-deflection curve suggested that the compressive stress of wood fibers in the compression zone (due to bending load) had reached a plastic condition. The evaluation of tensile and compressive parallel-to-grain strength data of wood species in Table 3 shows that the ratio of the tensile to compressive strength of Keruing (4.0) is significantly greater than the ratio obtained for Jabon (2.0). An increase in this magnitude leads to a significant presence of an in-elastic response in the load-deflection curve (Buchanan, 1990).
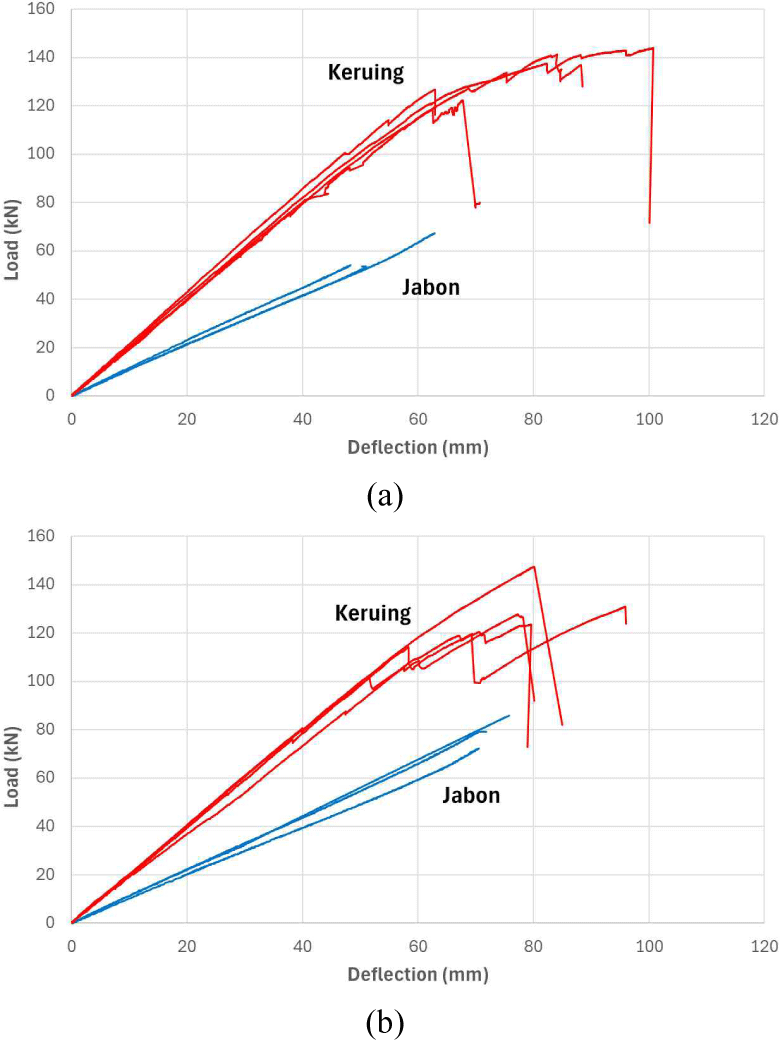
Table 4 presents the MoR and shear strength of glulam beams evaluated using Equations (2) and (3), respectively, while the MoE value was calculated using Equation (1). The average MoE of Keruing glulam beams was 17.34 GPa (SD: 1.33 GPa), which was nearly two times higher than the value obtained for Jabon (MoE: 8.64 GPa; SD: 0.56 GPa). The MoR of Keruing and Jabon glulam beams varied from 59.33 MPa to 88.67 MPa with an average of 72.94 MPa, and 30.56 MPa to 40.34 MPa with an average of 35.25 MPa, respectively. The MoR magnitude of Jabon glulam beams obtained was slightly lower than previously reported results (Hadi et al., 2021) presented in Table 1, which was probably due to the different sizes of glulam dimension. Glulam dimension of 450 × 50 × 30 mm3 previously used was extremely smaller than glulam dimension applied in this study.
Adopting the concept of a 5% exclusion limit (Pang et al., 2011), the characteristic property (MoR) corresponding to 75% of the confidence level of Jabon and Keruing glulam beams is 30.10 MPa and 57.79 MPa, respectively. Therefore, Jabon and Keruing glulam beams can be respectively categorized into GL30h and GL56h, which are uncommon or not yet defined in the current glulam strength class (EN 14080; CEN, 2013). Both Keruing and Jabon glulam beams exceed the minimum MoR of the lowest glulam grade allowed under the Korean Standard (6S-22B grade), which is 22 MPa (KS F 3021; Korean Standards Association, 2022).
4. CONCLUSIONS
In conclusion, this study developed a database of mechanical properties of nine potential Indonesian wood species, which could be extremely useful for the efficient production of engineered wood products such as glulam. Additionally, the bending test on the structural size of Jabon and Keruing glulam beams prepared by two local timber producers was conducted successfully. The results showed that MoR, MoE, tensile strength, and compressive strength parallel-to-grain increased with higher wood density. A linear stress-strain model in the tension zone and a bi-linear stress-strain relationship in the compression zone would be necessary as a material model in future numerical studies. Based on the MoR, glulam beams of Jabon and Keruing could be classified as GL30h and GL56h, respectively. Failure of glulam beams was dominated by the combination of lamina fracture in the vicinity of finger joints or wood knots in the tension zone and cross-grain tension failure. Delamination between two adjacent laminas was observed, specifically in the Jabon glulam beams. Therefore, improvement of glulam production process and strength evaluation of each lamina should be performed in future glulam production.


