Journal of the Korean Wood Science and Technology
The Korean Society of Wood Science & Technology
Original Article

Mask Region-Based Convolutional Neural Network (R-CNN) Based Image Segmentation of Rays in Softwoods

Hye-Ji YOO1, Ohkyung KWON2,https://orcid.org/0000-0002-6307-0060, Jeong-Wook SEO3,https://orcid.org/0000-0002-4395-0570
1Department of Forest Products, Chungbuk National University, Cheongju 28644, Korea
2National Instrumentation Center for Environmental Management, Seoul National University, Seoul 08826, Korea
3Department of Wood and Paper Science, Chungbuk National University, Cheongju 28644, Korea
Corresponding author: Ohkyung KWON (e-mail: zoom@snu.ac.kr)
Corresponding author: Jeong-Wook SEO (e-mail: jwseo@chungbuk.ac.kr)

Copyright 2022 The Korean Society of Wood Science & Technology. This is an Open-Access article distributed under the terms of the Creative Commons Attribution Non-Commercial License (http://creativecommons.org/licenses/by-nc/4.0/) which permits unrestricted non-commercial use, distribution, and reproduction in any medium, provided the original work is properly cited.

Received: Oct 16, 2022; Revised: Nov 10, 2022; Accepted: Nov 18, 2022

Published Online: Nov 25, 2022

ABSTRACT

The current study aimed to verify the image segmentation ability of rays in tangential thin sections of conifers using artificial intelligence technology. The applied model was Mask region-based convolutional neural network (Mask R-CNN) and softwoods (viz. Picea jezoensis, Larix gmelinii, Abies nephrolepis, Abies koreana, Ginkgo biloba, Taxus cuspidata, Cryptomeria japonica, Cedrus deodara, Pinus koraiensis) were selected for the study. To take digital pictures, thin sections of thickness 10–15 μm were cut using a microtome, and then stained using a 1:1 mixture of 0.5% astra blue and 1% safranin. In the digital images, rays were selected as detection objects, and Computer Vision Annotation Tool was used to annotate the rays in the training images taken from the tangential sections of the woods. The performance of the Mask R-CNN applied to select rays was as high as 0.837 mean average precision and saving the time more than half of that required for Ground Truth. During the image analysis process, however, division of the rays into two or more rays occurred. This caused some errors in the measurement of the ray height. To improve the image processing algorithms, further work on combining the fragments of a ray into one ray segment, and increasing the precision of the boundary between rays and the neighboring tissues is required.

Keywords: instance segmentation; Mask region-based convolutional neural network (R-CNN); rays; quantitative wood anatomy

1. INTRODUCTION

The anatomical features of woods vary with tree species. Therefore, by observing the anatomical features of wood in cross, tangential, and radial sections of the wood under light microscope, different types of wood can be identified (IAWA Committee, 1989, 2004).

The anatomical features of softwoods typically used for wood identification are the presence or absence of intercellular resin canals, bordered pit’s lines or spiral thickening observed in axial tracheids, axial parenchyma cells, and the shape of cross field fits, rays, and aspirated pits (Choi et al., 2022; Eom and Park, 2018; Kwon et al., 2020; Lee and Bae, 2021; Lee et al., 2021a, 2021b; Nam and Kim, 2021; Park et al., 1987). Moreover, the size of wood cells or tissues can also be used to identify wood (Lee et al., 2009; Seo and Eom, 2017; Seo et al., 2014), but such data are insufficient to draw any inference.

To apply the size of wood tissues to species identification, considerable measurement data are required, which requires a huge amount of time. Also, long working hours cause both physical and mental fatigue, which in turn, may reduce measurement accuracy. To address such issues, automatic wood identification technique based on image processing is gaining popularity in recent years (Kwon et al., 2017; Lopes et al., 2021; Ravindran et al., 2021).

Quantitative wood anatomy involves quantitative analysis of anatomical features of wood and evaluation of its geographical origin and growing condition based on the anatomical features (Gebregeorgis et al., 2021; von Arx et al., 2016). To note, the anatomical structure of wood varies from tree species to species, while external environmental factors influence the size of wood cells (da Silva et al., 2021; Hwang et al., 2020; Kim et al., 2018; Seo and Eom, 2017; Seo et al., 2014). Therefore, based on this, the quantitative data can be used to identify a wood and its geographical origin. The quantitative data can also be used to control the distribution of wood of endangered species in the wood market (de Palacios et al., 2020; Lee et al., 2020; Parades-Villanueva et al., 2018; Savero et al., 2020; Yu et al., 2017).

The size of rays in a tangential section of wood is large enough to be identified under a loupe and is different for different tree species (Alves and Angyalossy-Alfonso, 2000; Burgert and Eckstein, 2001). This signifies that the axial size of the rays in the tangential section can be used as a criterion to identify wood. Furthermore, not too many studies have been done on application of ray size in wood identification.

Deep learning is a part of machine learning that enables automatic measurement, a vast amount of data acquisition and analysis through learning. Therefore, deep learning has the potential to automatically identify wood species efficiently (de Geus et al., 2021; Fabijańska et al., 2021; Fathurahman et al., 2021; Wu et al., 2021). To apply deep learning in wood identification using size of rays in tangential section, quantitative data on ray size are needed.

The present study was conducted to confirm the detectability of rays in the tangential section of conifers using mask region-based convolutional neural network (Mask R-CNN), which is an instance segmentation model among image segmentation models, and the accuracy of the instance segmentation. This work is expected to contribute to automatic wood identification means and bring improvement in the strategy of using a large amount of quantitative wood anatomical data for wood identification.

2. MATERIALS and METHODS

2.1. Wood samples and their digital image preparation
2.1.1. Wood samples

Softwoods such as P. jezoensis, L. gmelinii, A. nephrolepis, A. koreana, G. biloba, T. cuspidata, C. japonica, C. deodara, and P. koraiensis were selected as experimental samples (Table 1).

Table 1. List of softwoods used in the study
Family Scientific name Common name
Ginkgoaceae Ginkgo biloba Maidenhair tree
Pinaceae Abies koreana Korean fir
Pinaceae Abies nephrolepis Khingan fir
Pinaceae Cedrus deodara Himalayan cedar
Pinaceae Larix gmelinii Dahurian larch
Pinaceae Picea jezoensis Dark-bark spruce
Pinaceae Pinus koraiensis Korean pine
Taxaceae Taxus cuspidata Rigid-branch yew
Taxodiaceae Cryptomeria japonica Japanese cedar
Download Excel Table

Cubes of length 1 cm were cut out of the experimental woods to make cross thin sections for examination under optical microscope. The cubes were softened in a mixture of glycerin and distilled water (1:4) adjusted at 60°C for 1 to 3 days. The softened cubes were cut into sections of thickness 10 to 15 μm using a small sliding microtome (GSL1, WSL), and then stained with a mixture (1:1) of astra blue (0.5%) and safranin (1%) to contrast colorations between cellulose (blue) and lignified cell walls (red). The stained thin sections were dehydrated by sequentially immersing in 30%, 50%, 70%, and 100% ethanol to minimize bubble generation while mounting with a cover glass. Euparal was used for mounting.

2.1.2. Digital images

Digital images of cross, tangential, and radial sections were obtained using a slide scanner (Axio Scan.Z1, Zeiss, Oberkochen, Germany). Magnification of the objective lens was 20× and numerical aperture (NA) was 0.8. The images cropped to 2,048 × 2,048 pixels were used for training the model and the size per pixel was 0.220 μm × 0.220 μm.

2.2. Annotation

The training course for instance segmentation requires an annotation marking the boundary of the target object area. Only tangential section images were taken, and Computer Vision Annotation Tool (CVAT) was used to annotate the rays in the tangential section. The total number of tangential images taken was 524, out of which 400 images were used for training and 124 for verification. The total number of annotations was 633, out of which 427 were used for training and 206 for verification. The annotated images were evenly selected from all tangential images to avoid overestimation of any particular image.

2.3. Test image set

To quantitatively test the performance of the trained model, test images were prepared using the images that had not been used for training purpose. The boundary of the rays in the test images were marked to produce the ground truth (GT) data. The GT data were used to verify the accuracy of the annotation result by CVAT. The accuracy was evaluated as the mean average precision (mAP), which is a quantitative indicator used to select a training model for measuring the ray height.

2.4. Image segmentation and training

In this study, Mask R-CNN model was used for image segmentation. Mask R-CNN is an extended version of Fast R-CNN, one of the existing object detection models, and is used to divide the boundary of an object in the detected area (He et al., 2017). Object detection is a technology to detect the location information of an object in an image and classification of objects in a detected area. On the other hand, instance segmentation is a technique to distinguish individual objects from overlapping of the same type of objects.

The Mask R-CNN model used for training is based on Python, Tensorflow, and Keras (GitHub, 2022). For transfer learning, a weight file trained using MS COCO (Microsoft Common Objects in Context) dataset was used.

The training of the model in the present study were conducted using Tensorflow 1.14.0, Keras 2.1.6, and Python 3.7.5 for segmentation of rays in the tangential section. Computers with Intel Xeon (2.2 GHz, 10 Core/20 Thread, 13.75 MB Cache), 192GB RAM, and Nvidia RTX 2080Ti were used for training.

3. RESULTS and DISCUSSION

3.1. Training of Mask region-based convolutional neural network (R-CNN)

The hyper-parameters and basic values of Mask R-CNN used in this study are as follows.

  • BACKBONE = resnet50

  • DETECTION_MIN_CONFIDENCE = 0.7

  • IMAGE_MIN_DIM = 512

  • IMAGE_MAX_DIM = 512

  • LOSS_WEIGHTS: rpn_class_loss = 1.0

  • LOSS_WEIGHTS: rpn_bbox_loss = 1.0

  • LOSS_WEIGHTS: mrcnn_class_loss = 1.0

  • LOSS_WEIGHTS: mrcnn_bbox_loss = 1.0

  • LOSS_WEIGHTS: mrcnn_mask_loss = 1.0

Among the above factors, the model was trained by varying the values of IMAGE_MIN_DIM and IMAGE_ MAX_DIM, which determine the size of the input image, and LOSS_WEIGHTS: mrcnnn_mask_loss, which greatly affects the alignment accuracy of the generated mask. The learning rate, momentum, and weight decay were 0.001, 0.9, and 0.0001, respectively. The batch size set in this study was 4, and learning was conducted for 10 to 20 epochs. The input image sizes were 512 × 512 and 1,024 × 1,024.

As a result of training under the above conditions, the highest mAP was resnet50 as a backbone, and 0.837 was found when the input image size was 1,024 × 1,024 (Table 2). The correlation analysis with GT also showed significant results, and it was confirmed that the time taken to derive the results was half that of GT. So, it was verified that the applied model could be used to automatically measure the height of rays.

Table 2. Hyper-parameters and mean average precision (mAP) used to train the Mask R-CNN model
Image size Backbone Mask loss Epoch mAP
512 × 512 resnet50 1.0 8 0.616
512 × 512 resnet50 1.0 12 0.673
1,024 × 1,024 resnet50 1.0 8 0.837
1,024 × 1,024 resnet50 1.0 12 0.609
1,024 × 1,024 resnet50 2.0 7 0.777
1,024 × 1,024 resnet50 2.0 12 0.836

Mask R-CNN: mask region-based convolutional neural network.

Download Excel Table
3.2. Instance segmentation

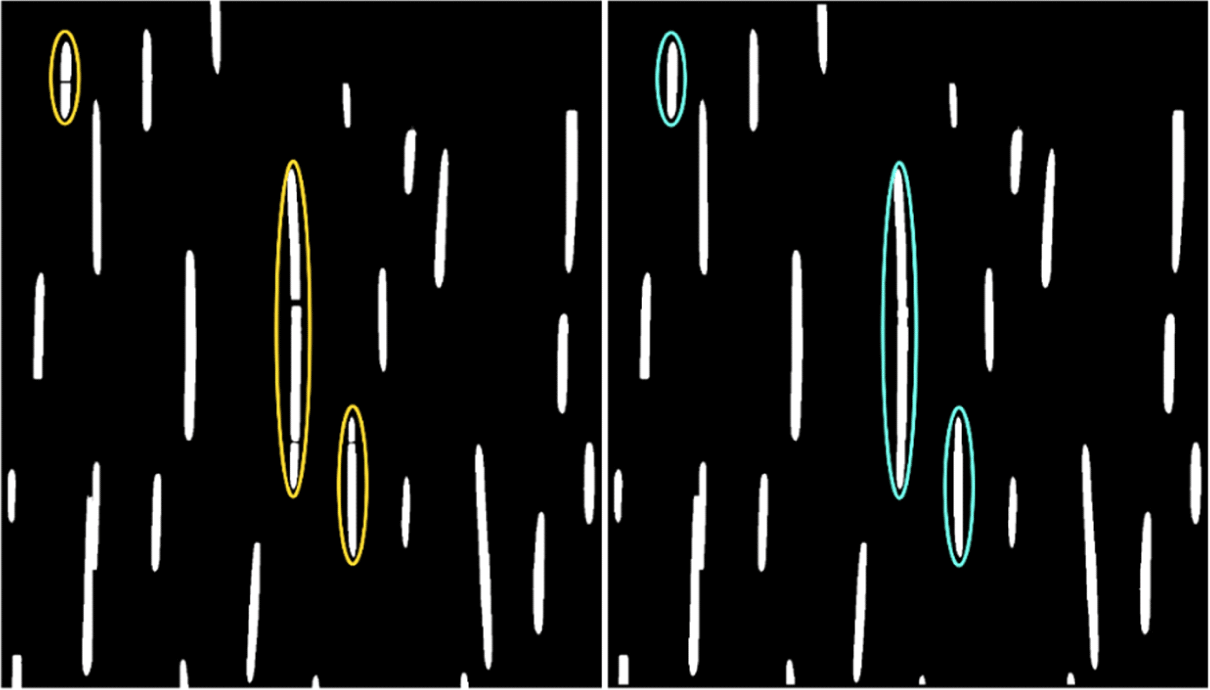
When the height of the rays was high, there were rays divided into two or more rays and recognized as separate rays (Left in Fig. 1). These were called as fragmented rays in this study. To minimize the decrease in the average height of the rays due to fragmentation, image processing was done to combine the fragmented rays into one. Through image processing, a large number of fragmented rays was corrected to form combined rays (Right in Fig. 1). However, not all fragmented rays could be corrected which needs to be improved in the future.

wood-50-6-490-g1
Fig. 1. Examples of the fragmented rays (left) and corrections of the same rays (right).
Download Original Figure
3.3. Comparison of ray heights by tree species

For G. biloba, T. cuspidata, and C. japonica, there was a difference of more than 100 between the numbers of rays of GT and instance segmentation (Table 3). The average height of the rays in these species did not exceed 100 μm (Fig. 2 the uppermost row). Except for P. koraiensis, the difference in the number of rays from GT and instance segmentation was relatively low. The reason for observing more differences in tree species having rays lower than 100 μm might be poor performance of Mark R-CNN for small rays. Even for tree species with relatively high rays, the mean height of the rays decreased due to fragmentation.

Table 3. Comparisons of the number of rays from the ground truth and instance segmentation, and the mean heights from the ground truth
Wood species Ground truth Instance segmentation Height of rays (μm)
Abies koreana 382 344 155.5
Abies nephrolepis 320 295 138.9
Cedrus deodara 256 243 207.4
Cryptomeria japonica 500 400 77.3
Ginkgo biloba 447 246 71.4
Larix gmelinii 289 293 158.0
Picea jezoensis 359 396 134.2
Pinus koraiensis 197 85 146.7
Taxus cuspidate 501 384 84.1
Download Excel Table
wood-50-6-490-g2
Fig. 2. Histogram of ray heights from the experimental tree species.
Download Original Figure

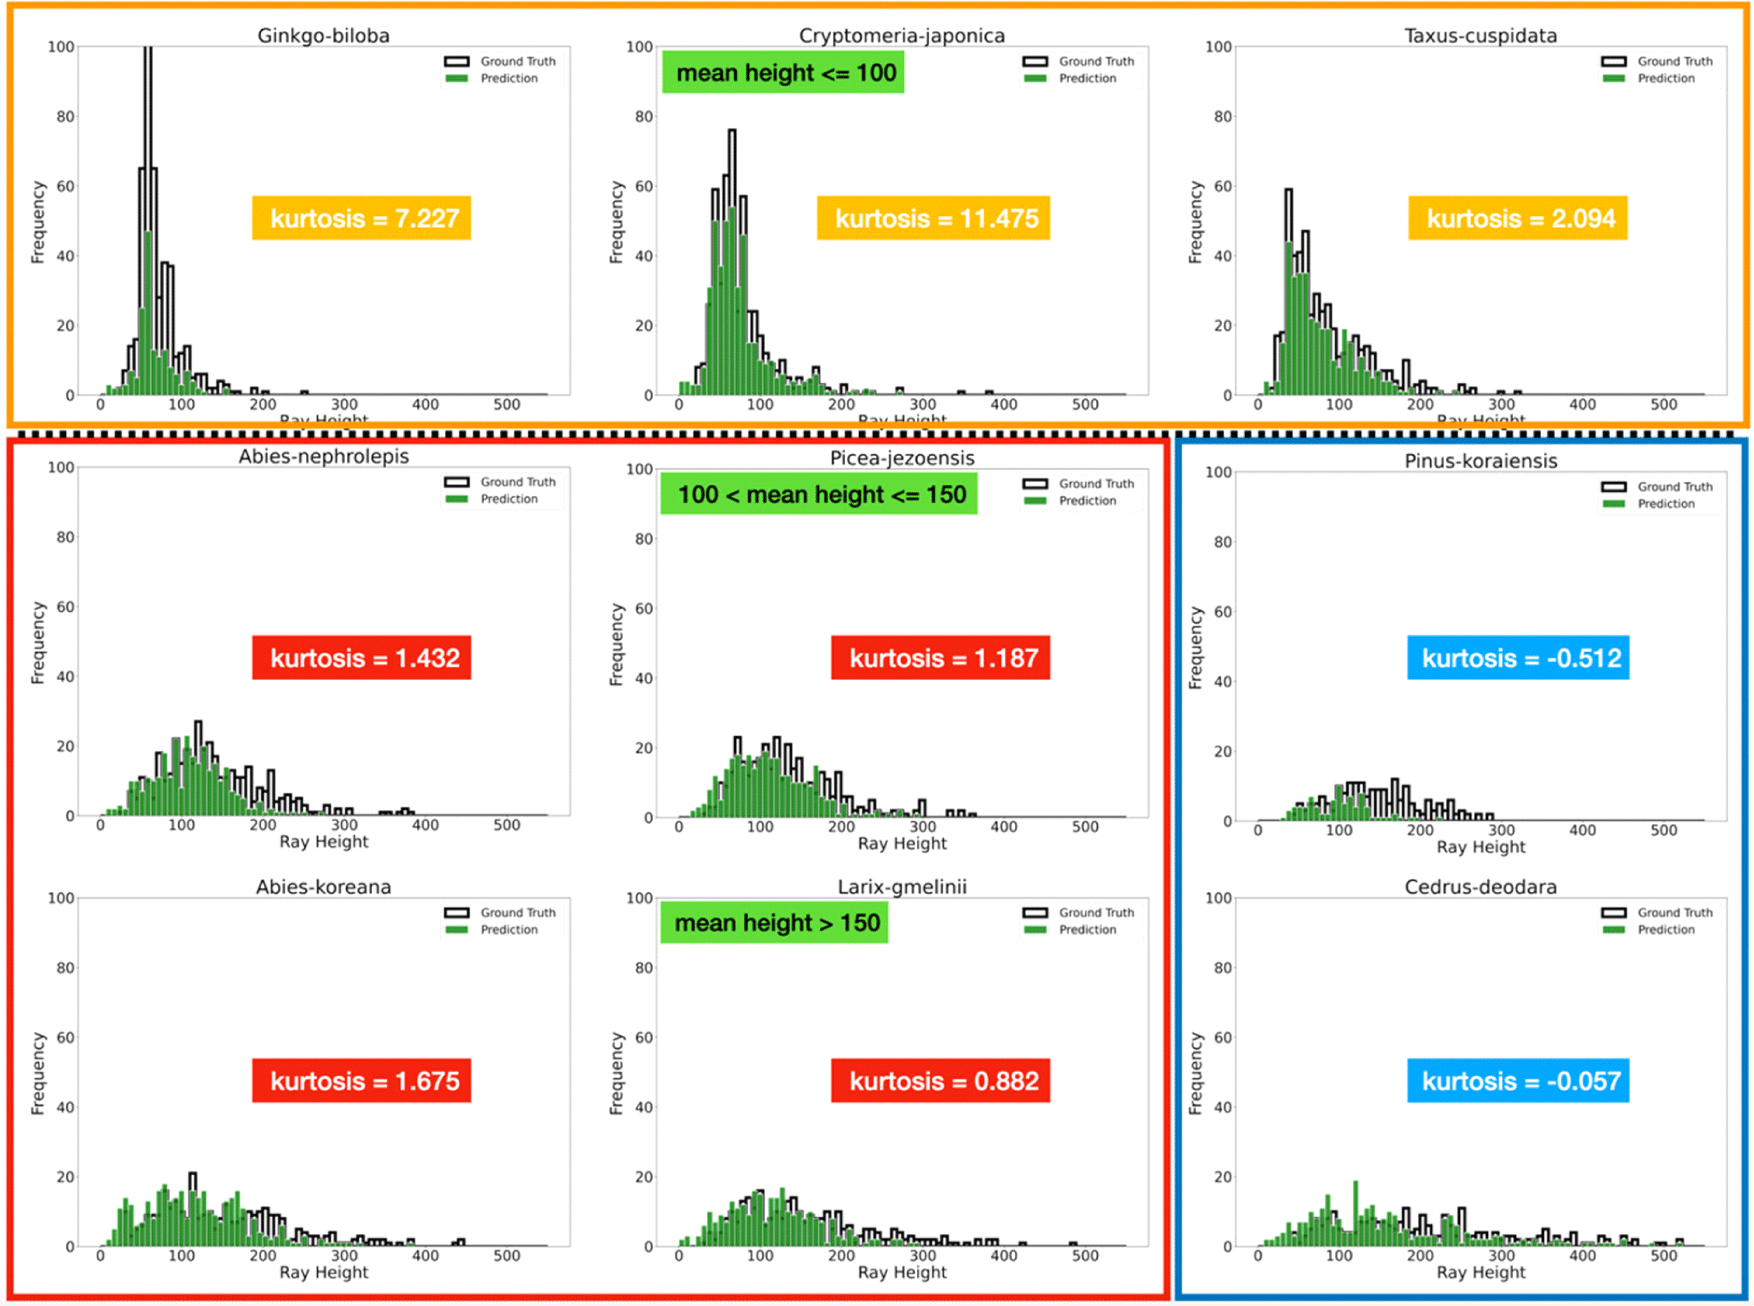
It was verified that kurtosis can be used as a key parameter to classify tree species (Fig. 2). Because, despite of the problem with fragmentation, there was a difference in the kurtosis of the height of the rays according to tree species except for P. koraiensis. The kurtosis of G. biloba, T. cuspidata, and C. japonica was more than 2.0, P. jezoensis, L. gmelinii, A. nephrolepis, A. koreana was approximately 1.0, and C. deodara showed negative values (Fig. 2). Only the tree species with a skewness of 2.0 or more had a mean height of rays approximately 100 μm or less.

4. CONCLUSIONS

The present study confirmed that Mask R-CNN, trained to detect rays in the tangential section, can be used to measure rays’ height. The highest mAP of the trained Mask R-CNN was 0.837. The height of the rays measured through Mask R-CNN showed a very high correlation with the results from GT, and the time to obtain the result using the model took less than half of the time required for the GT.

The frequency distribution of the ray height was verified to be unique according to the wood species. Based on these results, it was concluded that statistical values such as average values, skewness, or kurtosis of the height of rays from different wood species can be used as a basis for identification of the wood species. To apply these values, however, more improved object segmentation model and a large number of data on the height of rays are needed.

The major problems in the measurement of the height of rays using Mask R-CNN were the undetected rays and fragmentation of the rays. These two issues caused reduction in the mean ray height in each tree species. The fragmentation mostly occurred in tree species with ray height greater or equal to 100 μm. For more accuracy and reliable results, further research is necessary on improving the detection performance of the trained model and reducing the fragmentation of rays.

CONFLICT of INTEREST

No potential conflict of interest relevant to this article was reported.

ACKNOWLEDGMENT

Yoo, H.Y. and Seo, J.W. were supported by the project of ‘Collecting Wood Samples and Establishing the Image Database of their Surfaces and Kwon, O. was supported by the project of ‘Establishment of Standard Database for Wood Identification and Development of Automatic Identification of Wood Species’, which were funded by Korea Forest Service.

REFERENCES

1.

Alves, E.S., Angyalossy-Alfonso, V. 2000. Ecological trends in the wood anatomy of some Brazilian species. 1. Growth rings and vessels. IAWA Journal 21(1): 3-30.

2.

Burgert, I., Eckstein, D. 2001. The tensile strength of isolated wood rays of beech (Fagus sylvatica L.) and its significance for the biomechanics of living trees. Trees 15(3): 168-170.

3.

Choi, J., Park, J., Kim, S. 2022. Investigation of wood species and conservation status of wooden seated Amitabha Buddha Triad and wooden Amitabha Buddha Altarpiece of Yongmunsa temple, Yecheon, Korea (treasure). Journal of the Korean Wood Science and Technology 50(3): 193-217.

4.

de Geus, A.R., Backes, A.R., Gontijo, A.B., Albuquerque, G.H.Q., Souza, J.R. 2021. Amazon wood species classification: A comparison between deep learning and pre-designed features. Wood Science and Technology 55(3): 857-872.

5.

de Palacios, P., Esteban, L.G., Gasson, P., García-Fernández, F., de Marco, A., García-Iruela, A., García-Esteban, L., González-de-Vega, D. 2020. Using lenses attached to a smartphone as a macroscopic early warning tool in the illegal timber trade, in particular for CITES-listed species. Forests 11(11): 1147.

6.

da Silva, D.B., de Vasconcellos, T.J., Callado, C.H. 2021. Effects of urbanization on the wood anatomy of Guarea guidonia, an evergreen species of the Atlantic forest. Trees.

7.

Eom, Y.J., Park, B.D. 2018. Wood species identification of documentary woodblocks of Songok clan of the Milseong park, Gyeongju, Korea. Journal of the Korean Wood Science and Technology 46(3): 270-277.

8.

Fabijańska, A., Danek, M., Barniak, J. 2021. Wood species automatic identification from wood core images with a residual convolutional neural network. Computers and Electronics in Agriculture 181: 105941.

9.

Fathurahman, T., Gunawan, P.H., Prakasa, E., Sugiyama, J. 2021. Wood classification of Japanese Fagaceae using partial sample area and convolutional neural networks. Journal of the Korean Wood Science and Technology 49(5): 491-503.

10.

Gebregeorgis, E.G., Boniecka, J., Piętkowski, M., Robertson, I., Rathgeber, C.B.K. 2021. SabaTracheid 1.0: A novel program for quantitative analysis of conifer wood anatomy: A demonstration on African juniper from the Blue Nile basin. Frontiers in Plant Science 12: 595258.

11.

GitHub. 2022. Mask R-CNN for object detection and segmentation. https://github.com/matterport/Mask_RCNN

12.

He, K., Gkioxari, G., Dollár, P., Girshick, R. 2017. Mask R-CNN. In: Venice, Italy, Proceedings of 2017 IEEE International Conference on Computer Vision (ICCV), pp. 2980-2988.

13.

Hwang, S.W., Tazuru, S., Sugiyama, J. 2020. Wood identification of historical architecture in Korea by synchrotron X-ray microtomography-based three-dimensional microstructural imaging. Journal of the Korean Wood Science and Technology 48(3): 283-290.

14.

IAWA Committee. 1989. IAWA list of microscopic features for hardwood identification. IAWA Bulletin 10(3): 219-332.

15.

IAWA Committee. 2004. IAWA list of microscopic features for softwood identification. IAWA Journal 25(1): 1-70.

16.

Kim, M.J., Seo, J.W., Kim, B.R. 2018. Anatomical characteristics of Korean red pines according to provinces. Journal of the Korean Wood Science and Technology 46(1): 100-106.

17.

Kwon, O., Lee, H.G., Lee, M.R., Jang, S., Yang, S.Y., Park, S.Y., Choi, I.G., Yeo, H. 2017. Automatic wood species identification of Korean softwood based on convolutional neural networks. Journal of the Korean Wood Science and Technology 45(6): 797-808.

18.

Kwon, O., Kim, N.H., Kim, J.S., Seo, J.W., Jeong, Y.J. 2020. Wood Anatomy. The Wood Society of Korea, Seoul, Korea.

19.

Lee, H.M., Bae, J.S. 2021. Major species and anatomical characteristics of the wood used for national use specified in Yeonggeon-Uigwes of the late Joseon dynasty period. Journal of the Korean Wood Science and Technology 49(5): 462-470.

20.

Lee, H.M., Jeon, W.S., Lee, J.W. 2021b. Analysis of anatomical characteristics for wood species identification of commercial plywood in Korea. Journal of the Korean Wood Science and Technology 49(6): 574-590.

21.

Lee, K.H., Park, C.H., Kim, S.C. 2021a. Species identification and tree-ring dating of the wooden elements used in Juheulgwan of Joryeong (Gate No.1), Mungyeong, Korea. Journal of the Korean Wood Science and Technology 49(6): 550-565.

22.

Lee, M., Jeong, S.H., Mun, S.P. 2020. Conditions for the extraction of polyphenols from radiata pine (Pinus radiata) bark for bio-foam preparation. Journal of the Korean Wood Science and Technology 48(6): 861-868.

23.

Lee, S.H., Kwon, S.M., Lee, S.J., Lee, U., Kim, M.J., Kim, N.H. 2009. Radial variation of anatomical characteristics of chestnut wood (Castanea crenata) grown in Korea: Vessel element and ray. Journal of the Korean Wood Science and Technology 37(1): 19-28.

24.

Lopes, D.J.V., Bobadilha, G.S., Burgreen, G.W., Entsminger, E.D. 2021. Identification of North American softwoods via machine-learning. Canadian Journal of Forest Research 51(9): 1245-1252.

25.

Nam, T.G., Kim, H.S. 2021. A fundamental study of the Silla shield through the analysis of the shape, dating, and species identification of wooden shields excavated from the ruins of Wolseong moat in Gyeongju. Journal of the Korean Wood Science and Technology 49(2): 154-168.

26.

Paredes-Villanueva, K., Espinoza, E., Ottenburghs, J., Sterken, M.G. 2018. Chemical differentiation of Bolivian Cedrela species as a tool to trace illegal timber trade. Forestry: An International Journal of Forest Research 91(5): 539.

27.

Park, S.J., Lee, W.Y., Lee, W.H. 1987. Timber Organization and Identification. Hyangmunsa, Seoul, Korea.

28.

Ravindran, P., Owens, F.C., Wade, A.C., Vega, P., Montenegro, R., Shmulsky, R., Wiedenhoeft, A.C. 2021. Field-deployable computer vision wood identification of Peruvian timbers. Frontiers in Plant Science 12: 647515.

29.

Savero, A.M., Wahyudi, I., Rahayu, I.S., Yunianti, A.D., Ishiguri, F. 2020. Investigating the anatomical and physical-mechanical properties of the 8-year-old superior teakwood planted in Muna island, Indonesia. Journal of the Korean Wood Science and Technology 48(5): 618-630.

30.

Seo, J.W., Eom, C.D. 2017. Comparisons of Korean red pine tracheid lengths collected from Anmyeondo and Sokwang-ri. Journal of Korea Technical Association of the Pulp and Paper Industry 49(1): 18-24.

31.

Seo, J.W., Eom, C.D., Park, S.Y. 2014. Study on the variations of inter-annual tracheid length for Korean red pine from Sokwang-ri in Uljin. Journal of the Korean Wood Science and Technology 42(6): 646- 652.

32.

von Arx, G., Crivellaro, A., Prendin, A.L., Čufar, K., Carrer, M. 2016. Quantitative wood anatomy: Practical guidelines. Frontiers in Plant Science 7: 781.

33.

Wu, F., Gazo, R., Haviarova, E., Benes, B. 2021. Wood identification based on longitudinal section images by using deep learning. Wood Science and Technology 55(2): 553-563.

34.

Yu, M., Jiao, L., Guo, J., Wiedenhoeft, A.C., He, T., Jiang, X., Yin, Y. 2017. DNA barcoding of vouchered xylarium wood specimens of nine endangered Dalbergia species. Planta 246(6): 1165-1176.