1. INTRODUCTION
Waterlogged wood is found in wetlands, peat layers, ocean floors, and intertidal zones. As anaerobic conditions can be maintained for a long time in waterlogged wood, the growth of aerobic microbes is inhibited (Yi, 1997). Fine-grained soil and various minerals can also fill the lumen of wood cells and limit the oxygen supply, thus inhibiting the growth of aerobic microbes (Almkvist and Persson, 2008). Therefore, wood in the aforementioned environments is either subjected to slow biodegradation depending on the oxygen conditions, which influences the types of microorganisms involved in the degradation process (e.g., erosion bacteria, tunneling bacteria, and/or softrot fungi) or it remains intact depending on the burial period (Bjõrdal et al., 1999; Bjõrdal, 2012; Singh, 2012). Hemicellulose and cellulose are degraded, and partial lignin degradation has also been reported; however, the results can still be considerable after a long period of degradation.
In the 1995s, wooden ship (Dalido Shipwreck) was found in the intertidal zone of South Korea, and is believed to date back to be the Goryeo Dynasty. Although the wooden ships appeared to be relatively well preserved, the surfaces of the ships were soft and sponge-like, which implied that the wood degradation had progressed (Broda and Mazela, 2017). In aquatic environments or highly saturated soil, wood is mainly degraded by anaerobic bacteria or soft-rot fungi due to the reduced availability of oxygen (Colombini et al., 2009). In particular, erosion bacteria represent the dominant form of attack in waterlogged wood and contribute significantly to the deterioration of wooden ships, thus resulting in chemical, physical, and structural changes of the components (Nilsson and Björdal, 2008).
A simple and non-destructive method for determining the degradation of archaeological waterlogged wood is to measure the maximum moisture content by using a sample that has been separated from the main waterlogged wood. However, it is difficult to determine the exact degradation degree by using only by the maximum moisture content. Recently, Fourier transform infrared (FT-IR), scanning electron microscopy with energy dispersive X-ray analysis (SEM-EDX), nuclear magnetic resonance (NMR) and X-ray diffraction (XRD) have been applied to investigate the degradation of waterlogged wood (Oron et al., 2016; Łucejko et al., 2018). These methods only require a small amount of sample and also require little to no preparation. Further, it is convenient to combine several different techniques to gain as much information as possible. However, it is difficult to perform wet chemical analysis (chemical composition analysis) with a limited amount of sample. Moreover, the results from the aforementioned analytical methods mentioned above make it difficult to quantify the chemical compositions, whereas more accurate results may be obtained when accompanied by wet chemical analysis. The degradation degree of the archaeological waterlogged wood can be predicted by various analytical methods, but continuous observation is not possible during the degradation process. To date, there have been a few cases of analyzing the physical and chemical properties according to the deterioration process (Komorowicz et al., 2018; Park et al., 2018; Zisi and Dix, 2018).
In this study, a wood deterioration experiment was performed in an intertidal zone to monitor the changes in the chemical and structural properties of two wood species: Korean red pine and sawtooth oak. These were selected as they were founded to be the types used for wooden ships that were excavated during the 1970s. Korean red pine and sawtooth oak samples buried for 6 months in the intertidal zone and were removed both after 3 months and 6 months to analyze the chemical properties by using inductively coupled plasma atomic-emission spectroscopy (ICP-OES), XRD, and the wet chemical method. Based on this information, the degree of deterioration according to the burial period could be predicted. These results will also provide basic information for understanding the degradation mechanism of waterlogged wood. In addition, the results may be useful for suggesting suitable preservation methods for archaeological waterlogged wood with great cultural value.
2. MATERIALS and METHODS
Korean red pine (Pinus densiflora S. et Z.) and sawtooth oak (Quercus acutissima Carr.) were used as test wood blocks and each sample was prepared to a size of 100 mm (length) × 30 mm (radial) × 30 mm (tangential).
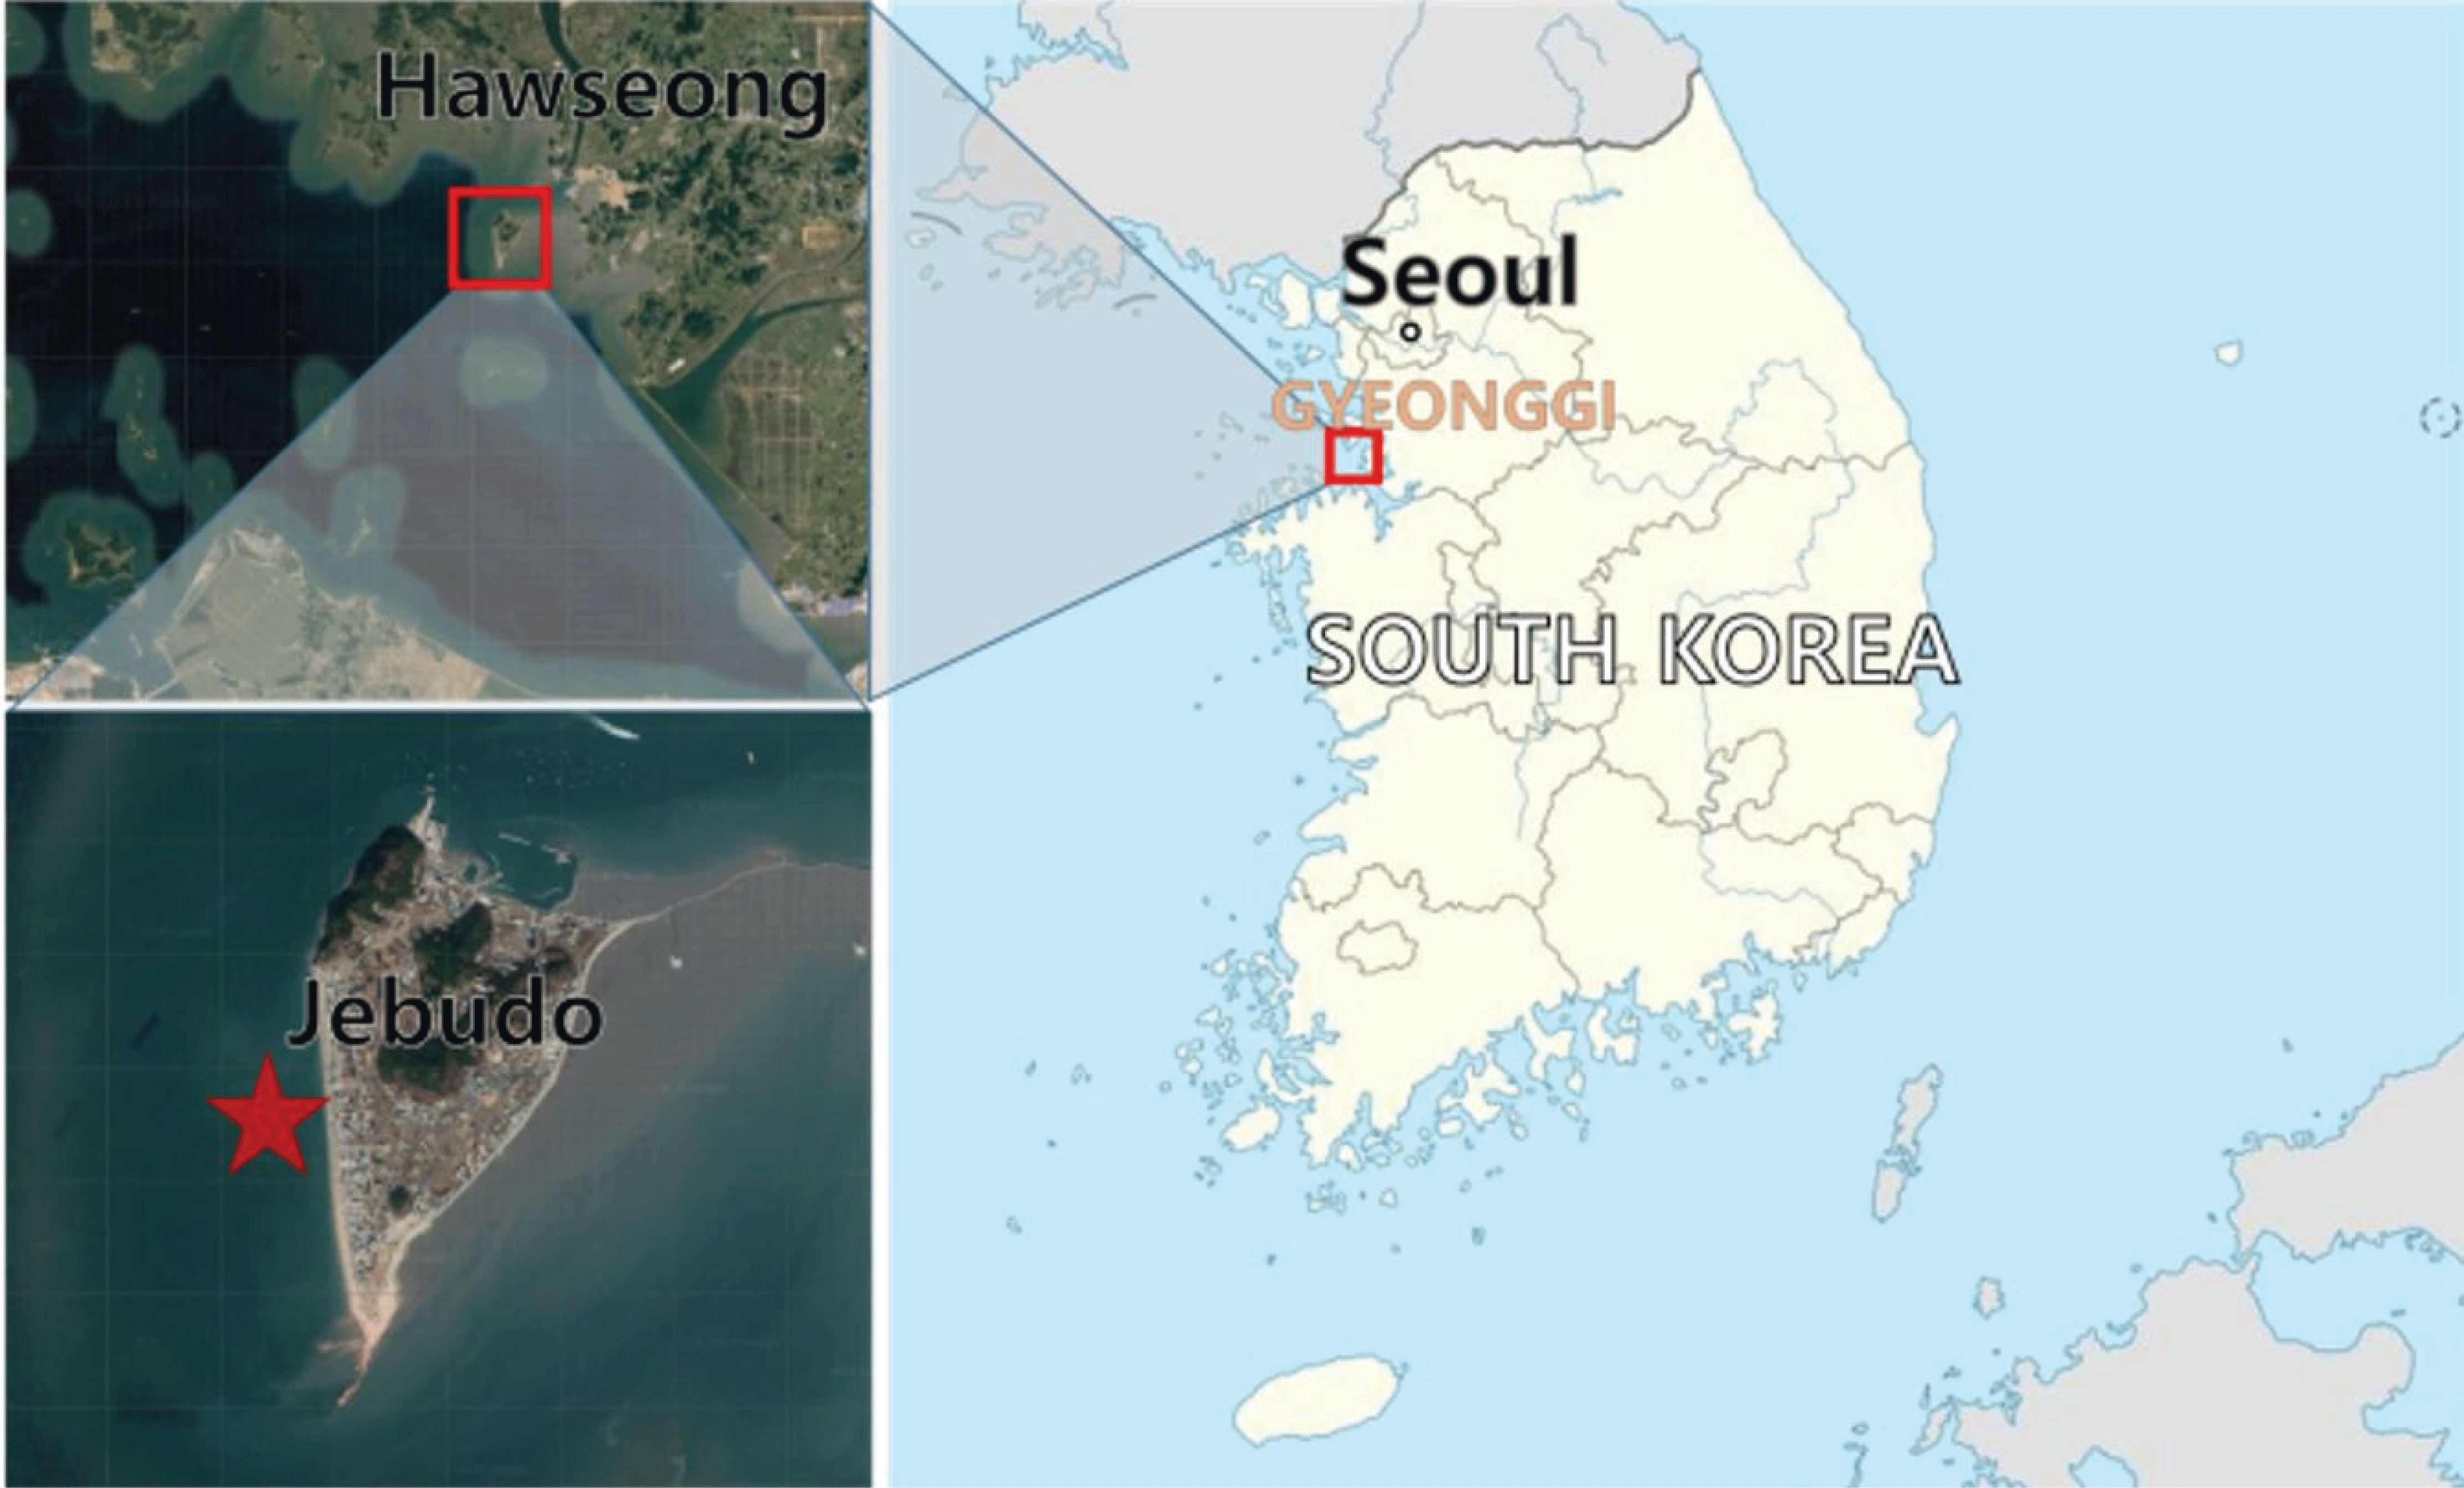
Field test was conducted for artificial deterioration experiment. 24 samples of each wood species were buried at a depth of 30 cm in the intertidal zone of Hwaseong City in Gyeonggi–do, South Korea (Fig. 1). 12 samples were collected at intervals of 3 months until 6 months to monitor the change in the chemical properties of the wood during experiment period. Mud was immediately removed from surface of the samples upon collection, and the samples were subsequently washed, air dried, and prepared for the analyses of physical, and chemical properties.
Each sample was cut into 5 mm and the maximum moisture content was determined by following the Korean standard KSF 2199 (2016). The maximum moisture content (MCmax) was calculated according to the following equation (1), which expresses the percentage ratio of the difference between the mass at maximum moisture content (Ww) and the anhydrous mass (Wd) over the anhydrous mass as follows:
The color change is measured in an artificial deterioration experiment because the color change of wood is one of the characteristics of waterlogged wood during deterioration (Monachon et al., 2020). The color change of the surface each sample after each burial period in the intertidal zone was observed using colorimeter (TES-135A, TES, Taiwan) in the CIE Lab L*a*b* system. In order to analyze, the values ΔE* and ΔL* were calculated for each sample, where Δ E* represents the total color difference, and L* is the difference in lightness and darkness (+ indicates lighter, - indicates darker). Parameter a* indicates red (+) and green (-) color, while b* indicates yellow (+) and blue (-) color. These values were calculated using the following equations (2) (Hwang et al., 2018; Hadi et al., 2020):
A thin section of each sample was prepared to 15-30 μm using a microtome (Leica microsystems, Germany), and was then treated with 1% safranin for the selective staining of wood tissue. A micro-morphological investigation was carried out using light microscopy (Olympus bx50, Japan).
The samples were dried and milled to a 20-80 mesh size to analyze the chemical composition. The chemical composition (cellulose, hemicellulose, and lignin) of the control and buried samples following the NREL Laboratory Analytical Procedure (Selig et al., 2008). The ash content of each sample was measured using a modification of the TAPPI Standard Method (T211-om-02). The sample was heated to 775°C±25°C in a muffle furnace for 6 h.
Inorganic elemental compounds in the samples were measured using ICP-OES (PerkinElmer, USA). To analyze the inorganic elemental compounds in the mud of the experimental site, the carbonate was removed from the mud and micro-hydrolysis was carried out prior to analysis using ICP-OES. Seawater was analyzed using an automated seawater analysis system (seaFAST SP3, Elemental Scientific, USA).
The FT-IR analysis was performed using a Nicolet 6700 spectrometer (Thermo Scientific, USA) to confirm any structural changes in the samples after burial. Each sample was ground and pelletized with potassium bromide (KBr). The operating condition was wavelength ranged from 4,000 cm-1 to 650 cm-1.
The samples were milled to pass through 100 mesh for crystallinity analysis. The crystallinity was determined by using a multi-purpose X-ray diffractometer (X’pert Pro, Panalitical, the Netherlands) with a 2θ range of 5-50° at 40 kV and 30 mA. The crystallinity intensity (CrI) of each sample was calculated using the Segal method (Segal et al., 1959).
A one-way analysis of variance (ANOVA) was performed to determine the significant differences between mean values using the statistical package for the social sciences (SPSS) software version 23 (SPSS Inc., Chicago, IL, USA). Duncan’s test was conducted to determine the correlation between the variables used, and the differences were considered significant at a p-value of <0.05.
3. RESULTS and DISCUSSION
Fig. 2 shows the maximum moisture content of the wood samples after 3 months and 6 months of burial in the intertidal zone. The maximum moisture content decreased from 199% to 136% in the Korean red pine samples after 6 months. Whereas the maximum moisture content of the sawtooth oak samples did not change significantly under the same conditions of deterioration. This can be explained by the fact that softwoods such as Korean red pine are composed primarily of tracheid (90-95%). Tracheid provide mechanical strength and allow for water transport; hence, softwoods have a higher maximum moisture contentin comparison to hardwoods (Grattan, 1987). In general, the maximum moisture content increases with progressive deterioration due to the degradation of the cell walls. The decreased maximum moisture content of the Korean red pine over the burial period can be explained by the mud in the wood surface during burial period. This assertion was confirmed by the analyses of the microstructure and inorganic compound analysis (Section 3.2 and Table 2).
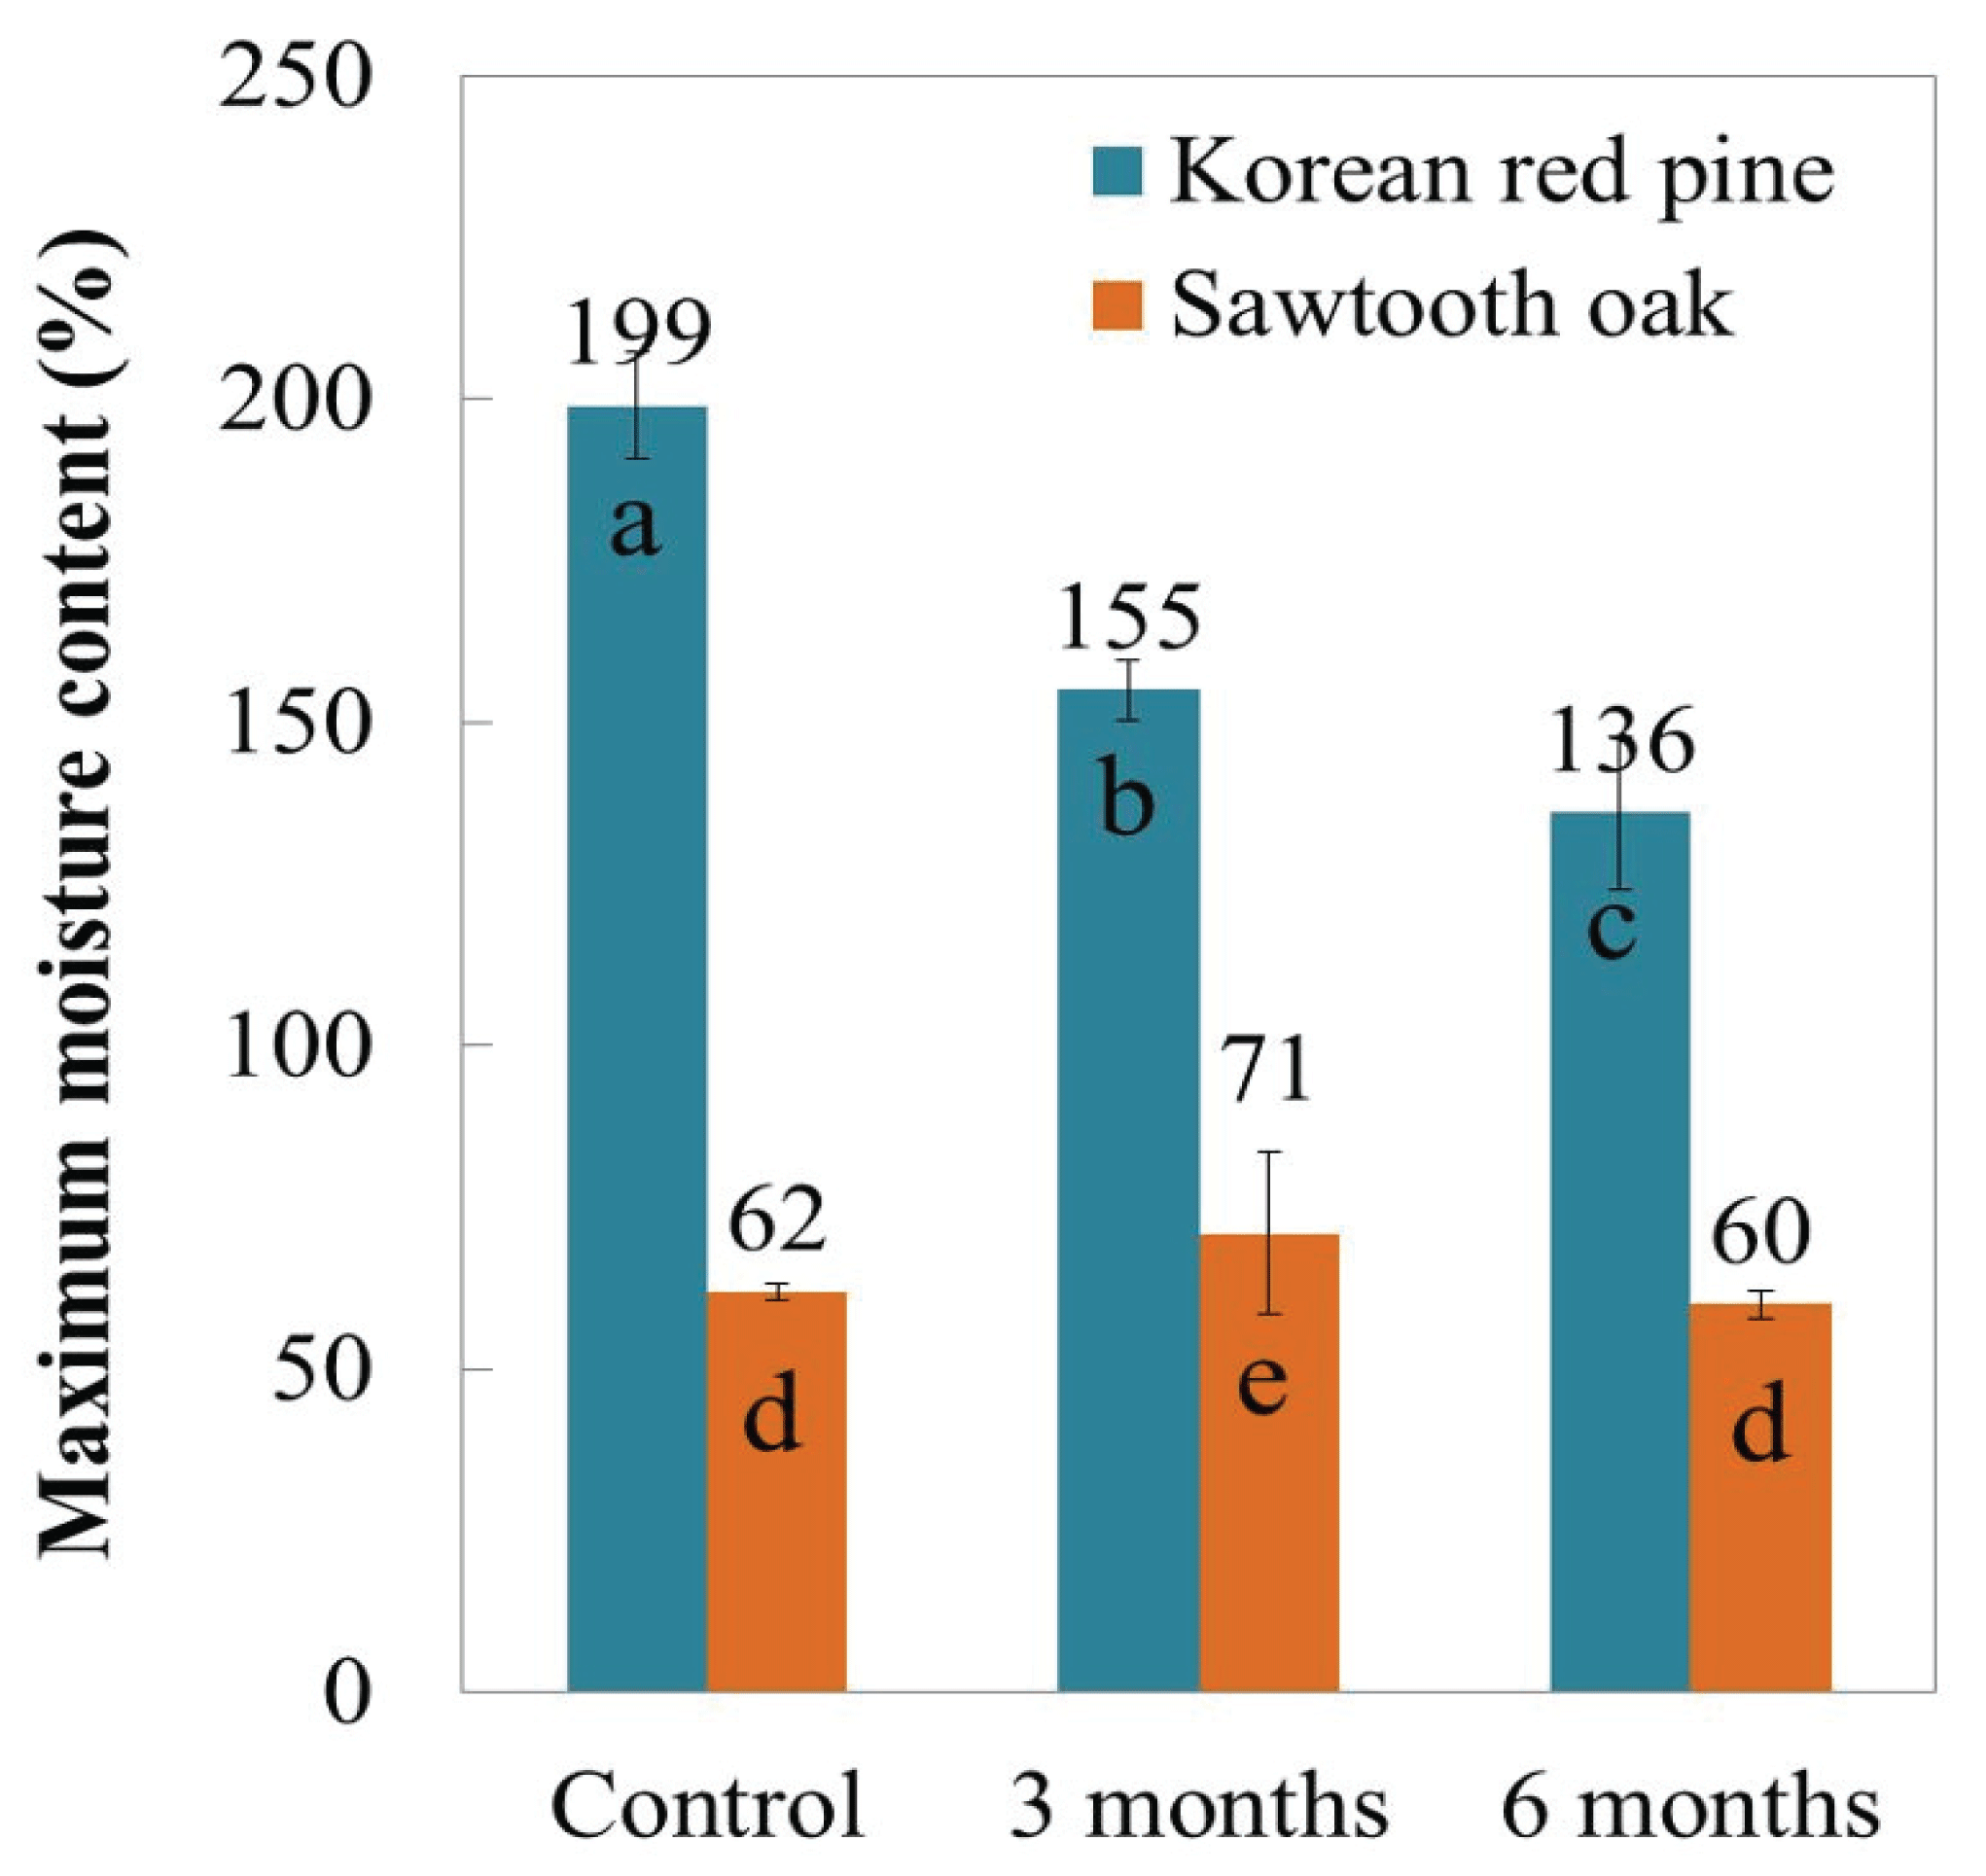
Table 1 presents the changes in the chemical composition of the two wood species over the burial period. Galactoglucomannan is the major component of hemicellulose in softwoods, and consists of β-D -glucopyranose and β-D-mannopyranose units (Sjöström, 1981). The mannan concentration of pine was higher in comparison to oak (Mcgee and April, 1982). On the other hand, the hemicellulose of hardwood has been found to consists mainly of glucuronoyxylan (15-30%) with β-D-xylopyranose units (Sjöström, 1981). Therefore, xylan was detected as the major component of hemicellulose in the sawtooth oak samples. After 6 months, the major chemical components had not changed significantly in the Korean red pine or sawtooth oak samples. This implies that no significant degradation occurred during this period, which was due to anaerobic conditions and relatively short burial period. In addition, compared with weathering of wood in the field, the change of the composition was not changed significantly. The reason is that it was not exposed to ultraviolet rays (Kim, 2017).
The ash content increased over the burial period due to the accumulation of inorganic compounds (Macchioni et al., 2012). The major inorganic compounds in both wood species increased over the burial period (Table 2), which was due to the absorption of inorganic compounds generated from seawater and sea organisms inhabiting the wood (Rémazeilles et al., 2019). In comparison to the control, sodium and sulfur increased significantly after burial. Komorowicz reported that English oak exposed to the Baltic Sea for five years contained higher sodium and sulfur contents compared to that of the control (Komorowicz et al., 2018). The accumulation of inorganic compounds in the wood over the burial period affected the maximum moisture content of the biomass (Fig. 2); thus, the change in the maximum moisture content could also be explained by this.
| Na | Fe | S | |
|---|---|---|---|
| PC | - | 0.016 | 0.013 |
| P3 | 1.467 | 0.011 | 0.293 |
| P6 | 1.819 | 0.021 | 0.282 |
| OC | 0.014 | 0.018 | 0.012 |
| O3 | 0.834 | 0.068 | 0.127 |
| O6 | 03.889 | 0.013 | 0.169 |
| Seawater | 0.951 | - | 0.007 |
| Mud in the study | 0.515 | 2.007 | - |
The change of the crystallinity of the wood samples was investigated. The crystallinity value of Korean red pine and sawtooth oak are 45.55% and 48.06%, which decreased to 41.9% and 45.19%, respectively, after 6 months of burial due to the accumulation of inorganic compounds in the lumen. The variation of the crystallinity value of the two wood species over the burial period was consistent with the inorganic compounds analysis (Table 2), which agree with the typical characteristics of waterlogged wood (Rémazeilles et al., 2019).
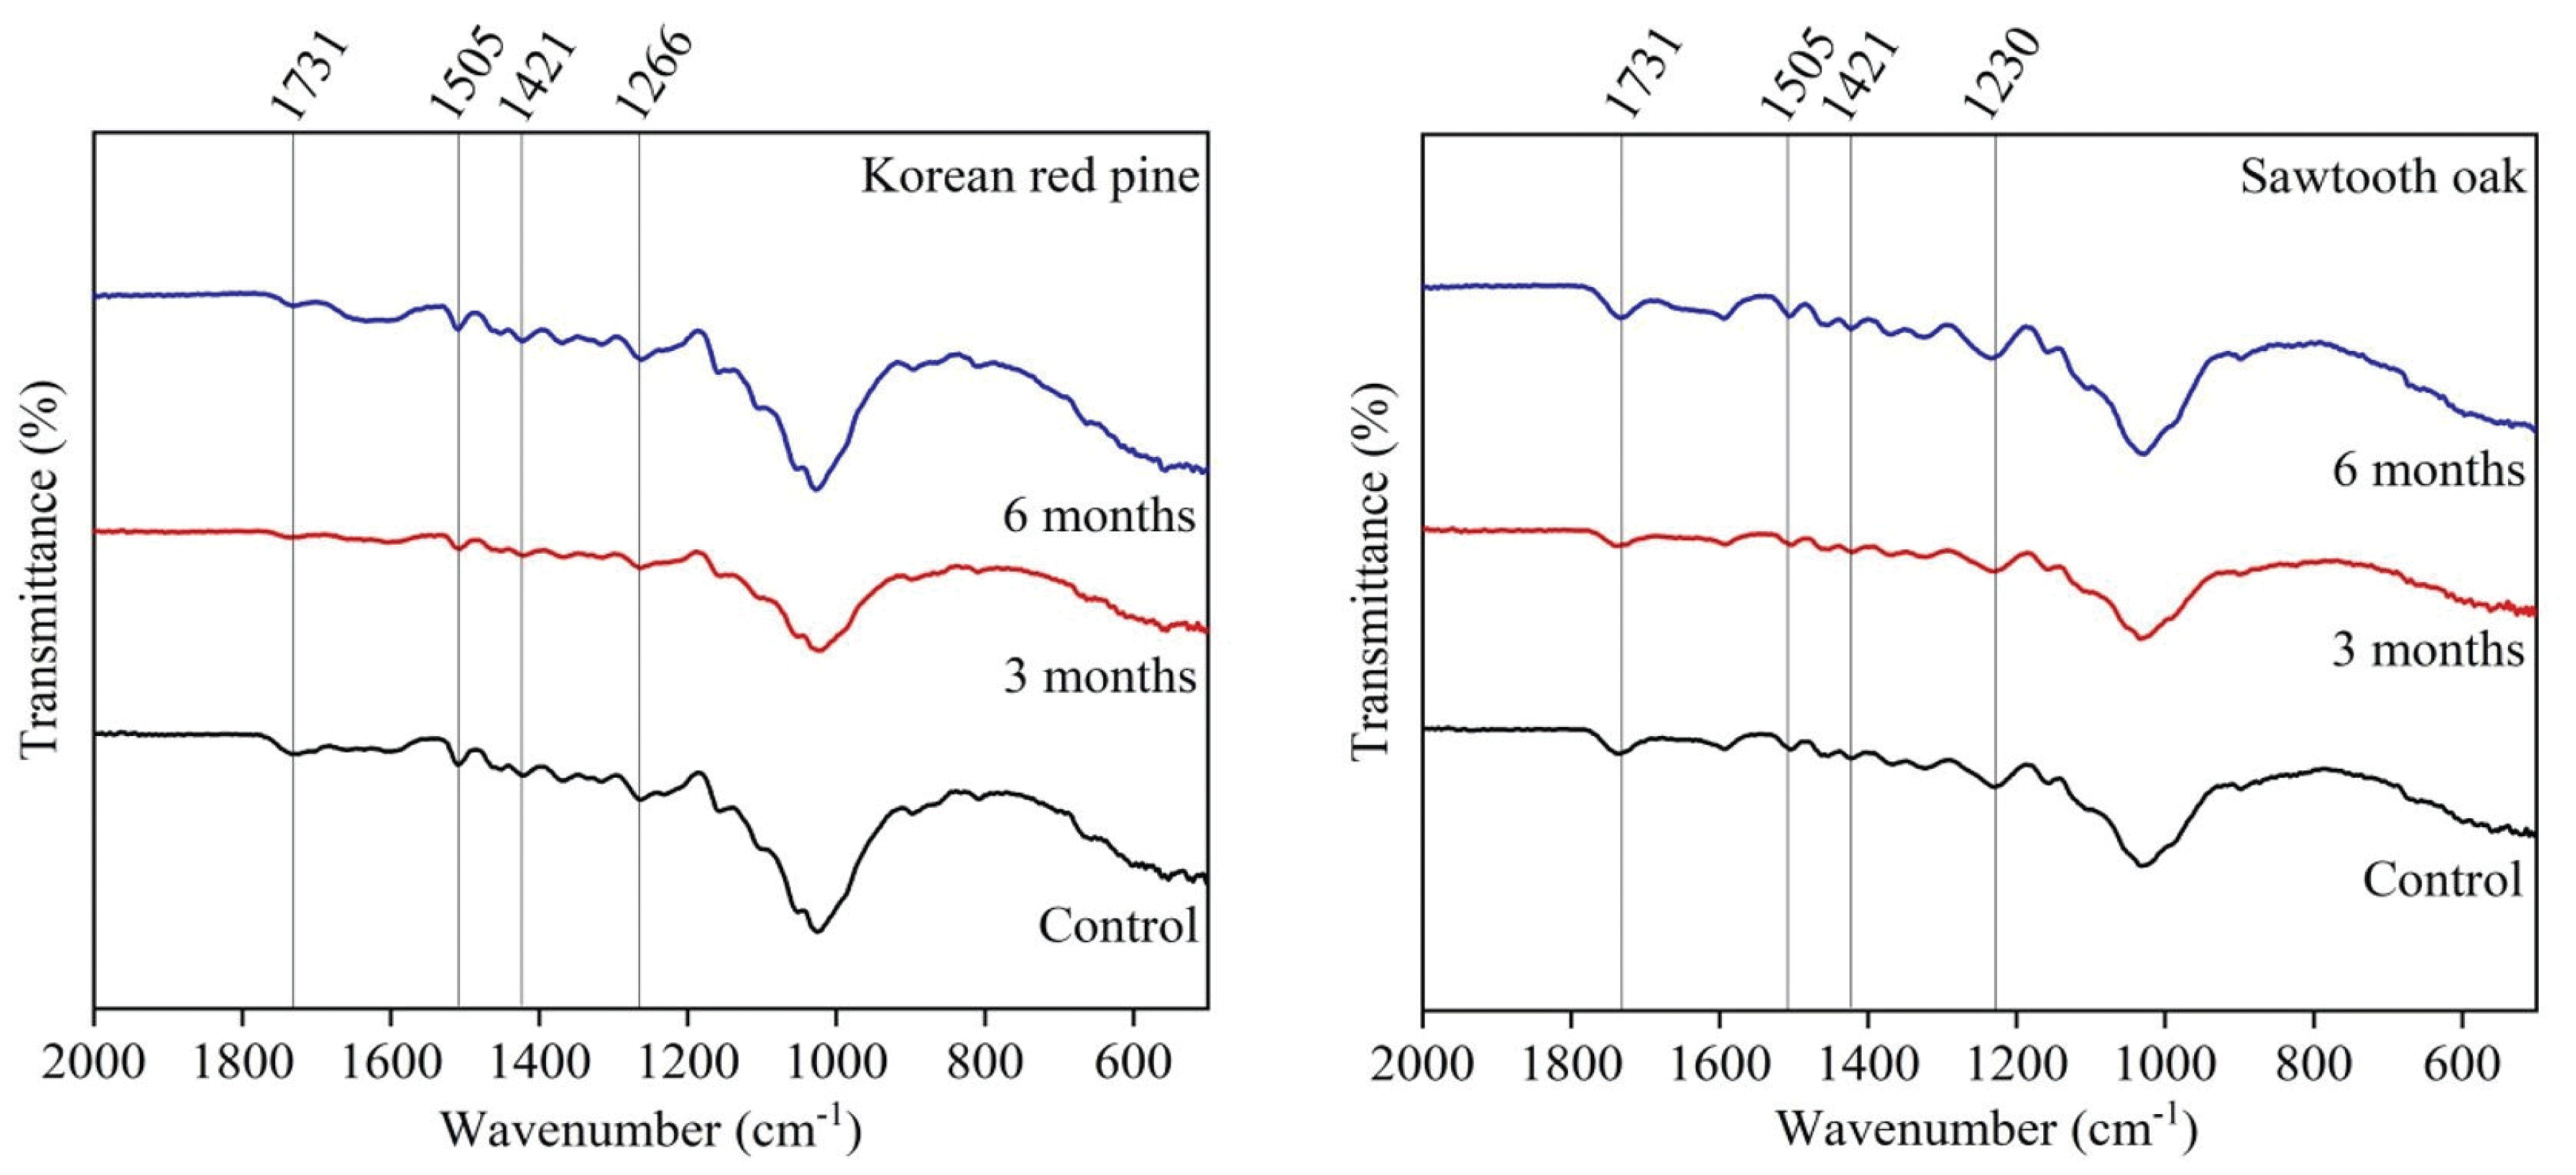
The results of the FT-IR spectra were compared in the range of 900-2000 cm-1 to estimate the changes of the chemical composition of the wood samples (Fig. 3). A change in the peaks was observed at 1731 cm-1 for the both wood species, and was assigned to C=O stretching in unconjugated ketones, carboxyl, and ester groups (mainly in hemicellulose) (Cogulet et al., 2016; Ozgenc et al., 2018). The band at 1230 cm-1 was changed slightly and corresponded to C-O stretching in hemicellulose (Tamburini et al., 2017). Monachon et al. reported that hemicellulose-related functional groups were decreased in artificially deteriorated wood (2020). In this study, although the peaks relating to hemicellulose were changed slightly, this did not correspond to a significantly effect in deterioration. There was no significant difference in bands relating to lignin (1505 cm-1, 1421 cm-1, and 1266 cm-1) for either wood species, which implies that lignin was not degraded during burial period (Gelbrich et al., 2008; Kundu and Lee, 2015; Traoré et al., 2016).
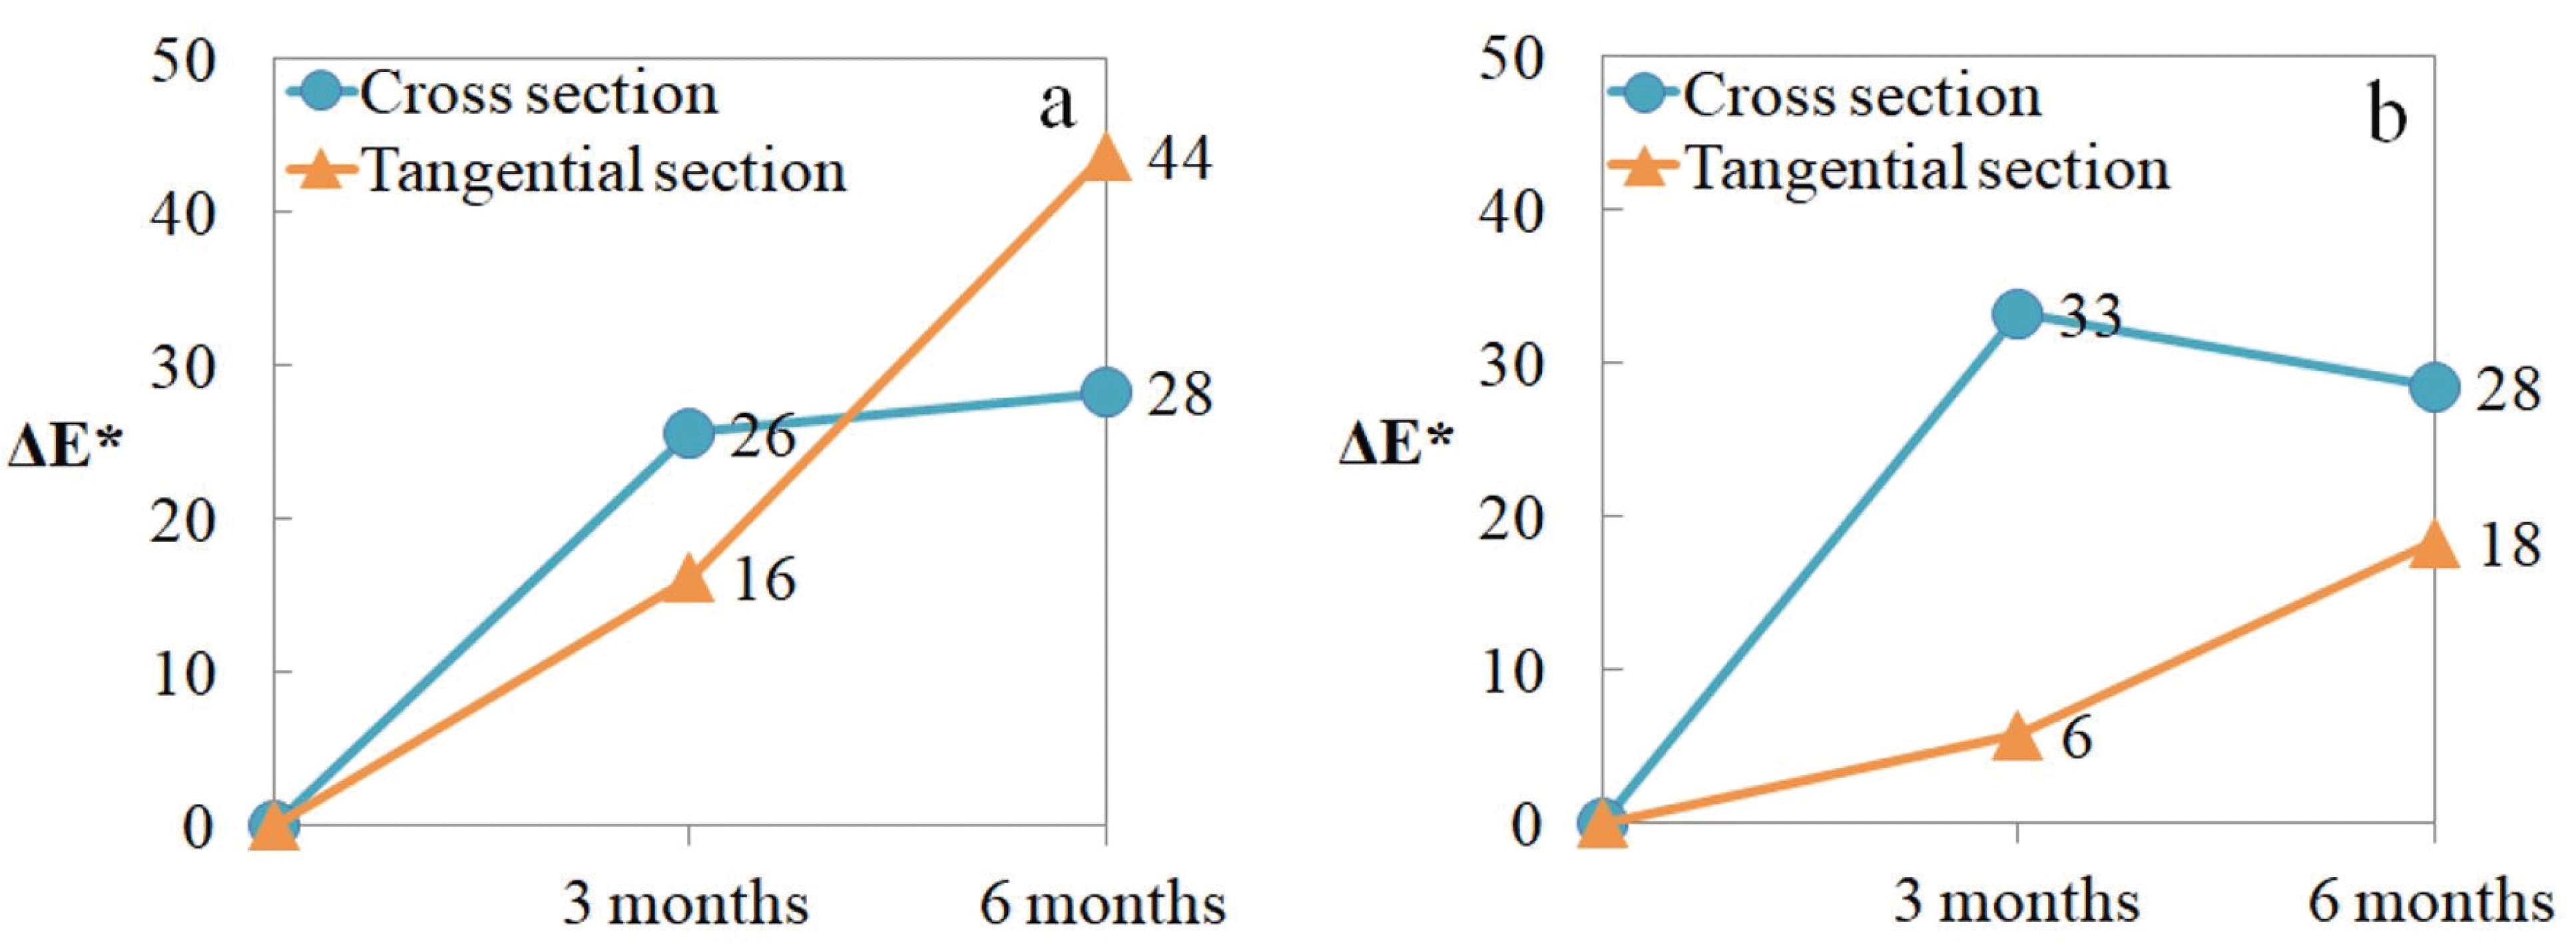
The color change of wood is one of the deterioration phenomena, and is occurs with short external exposure time (Kim, 2018). In this study, the colorimetric analysis of the wood surfaces (cross and tangential section) was performed using a colorimeter, and the results are shown in Table 3. The value of L* indicates lightness, which decreased with increased burial in both types of wood. The color change of thewood in the field is caused by oxidation, decomposition, and condensation of lignin or extract by ultraviolet rays (Kim, 2017). In this study, the deterioration process of wood was carried out in the intertidal zone, thus the color change was caused by inorganic compounds rather than the effect of ultraviolet rays. The darkening of wood in a wet environment is due to the reaction between the iron compounds present in the water and the tannins in oak (Komorowicz et al., 2018). The a* and b* values decreased slightly with increased burial. In this study, the color change of the wood surface can be explained by chemical reactions and the accumulation of inorganic compound in the wood surface during burial (Sandak et al., 2014). The difference in color change (ΔE*) between the cross section and the tangential section are shown in Fig. 4. In both wood species, the change in the cross section was faster than that of tangential section after 3 months. On the other hand, the color change in the tangential section increased with increased burial.
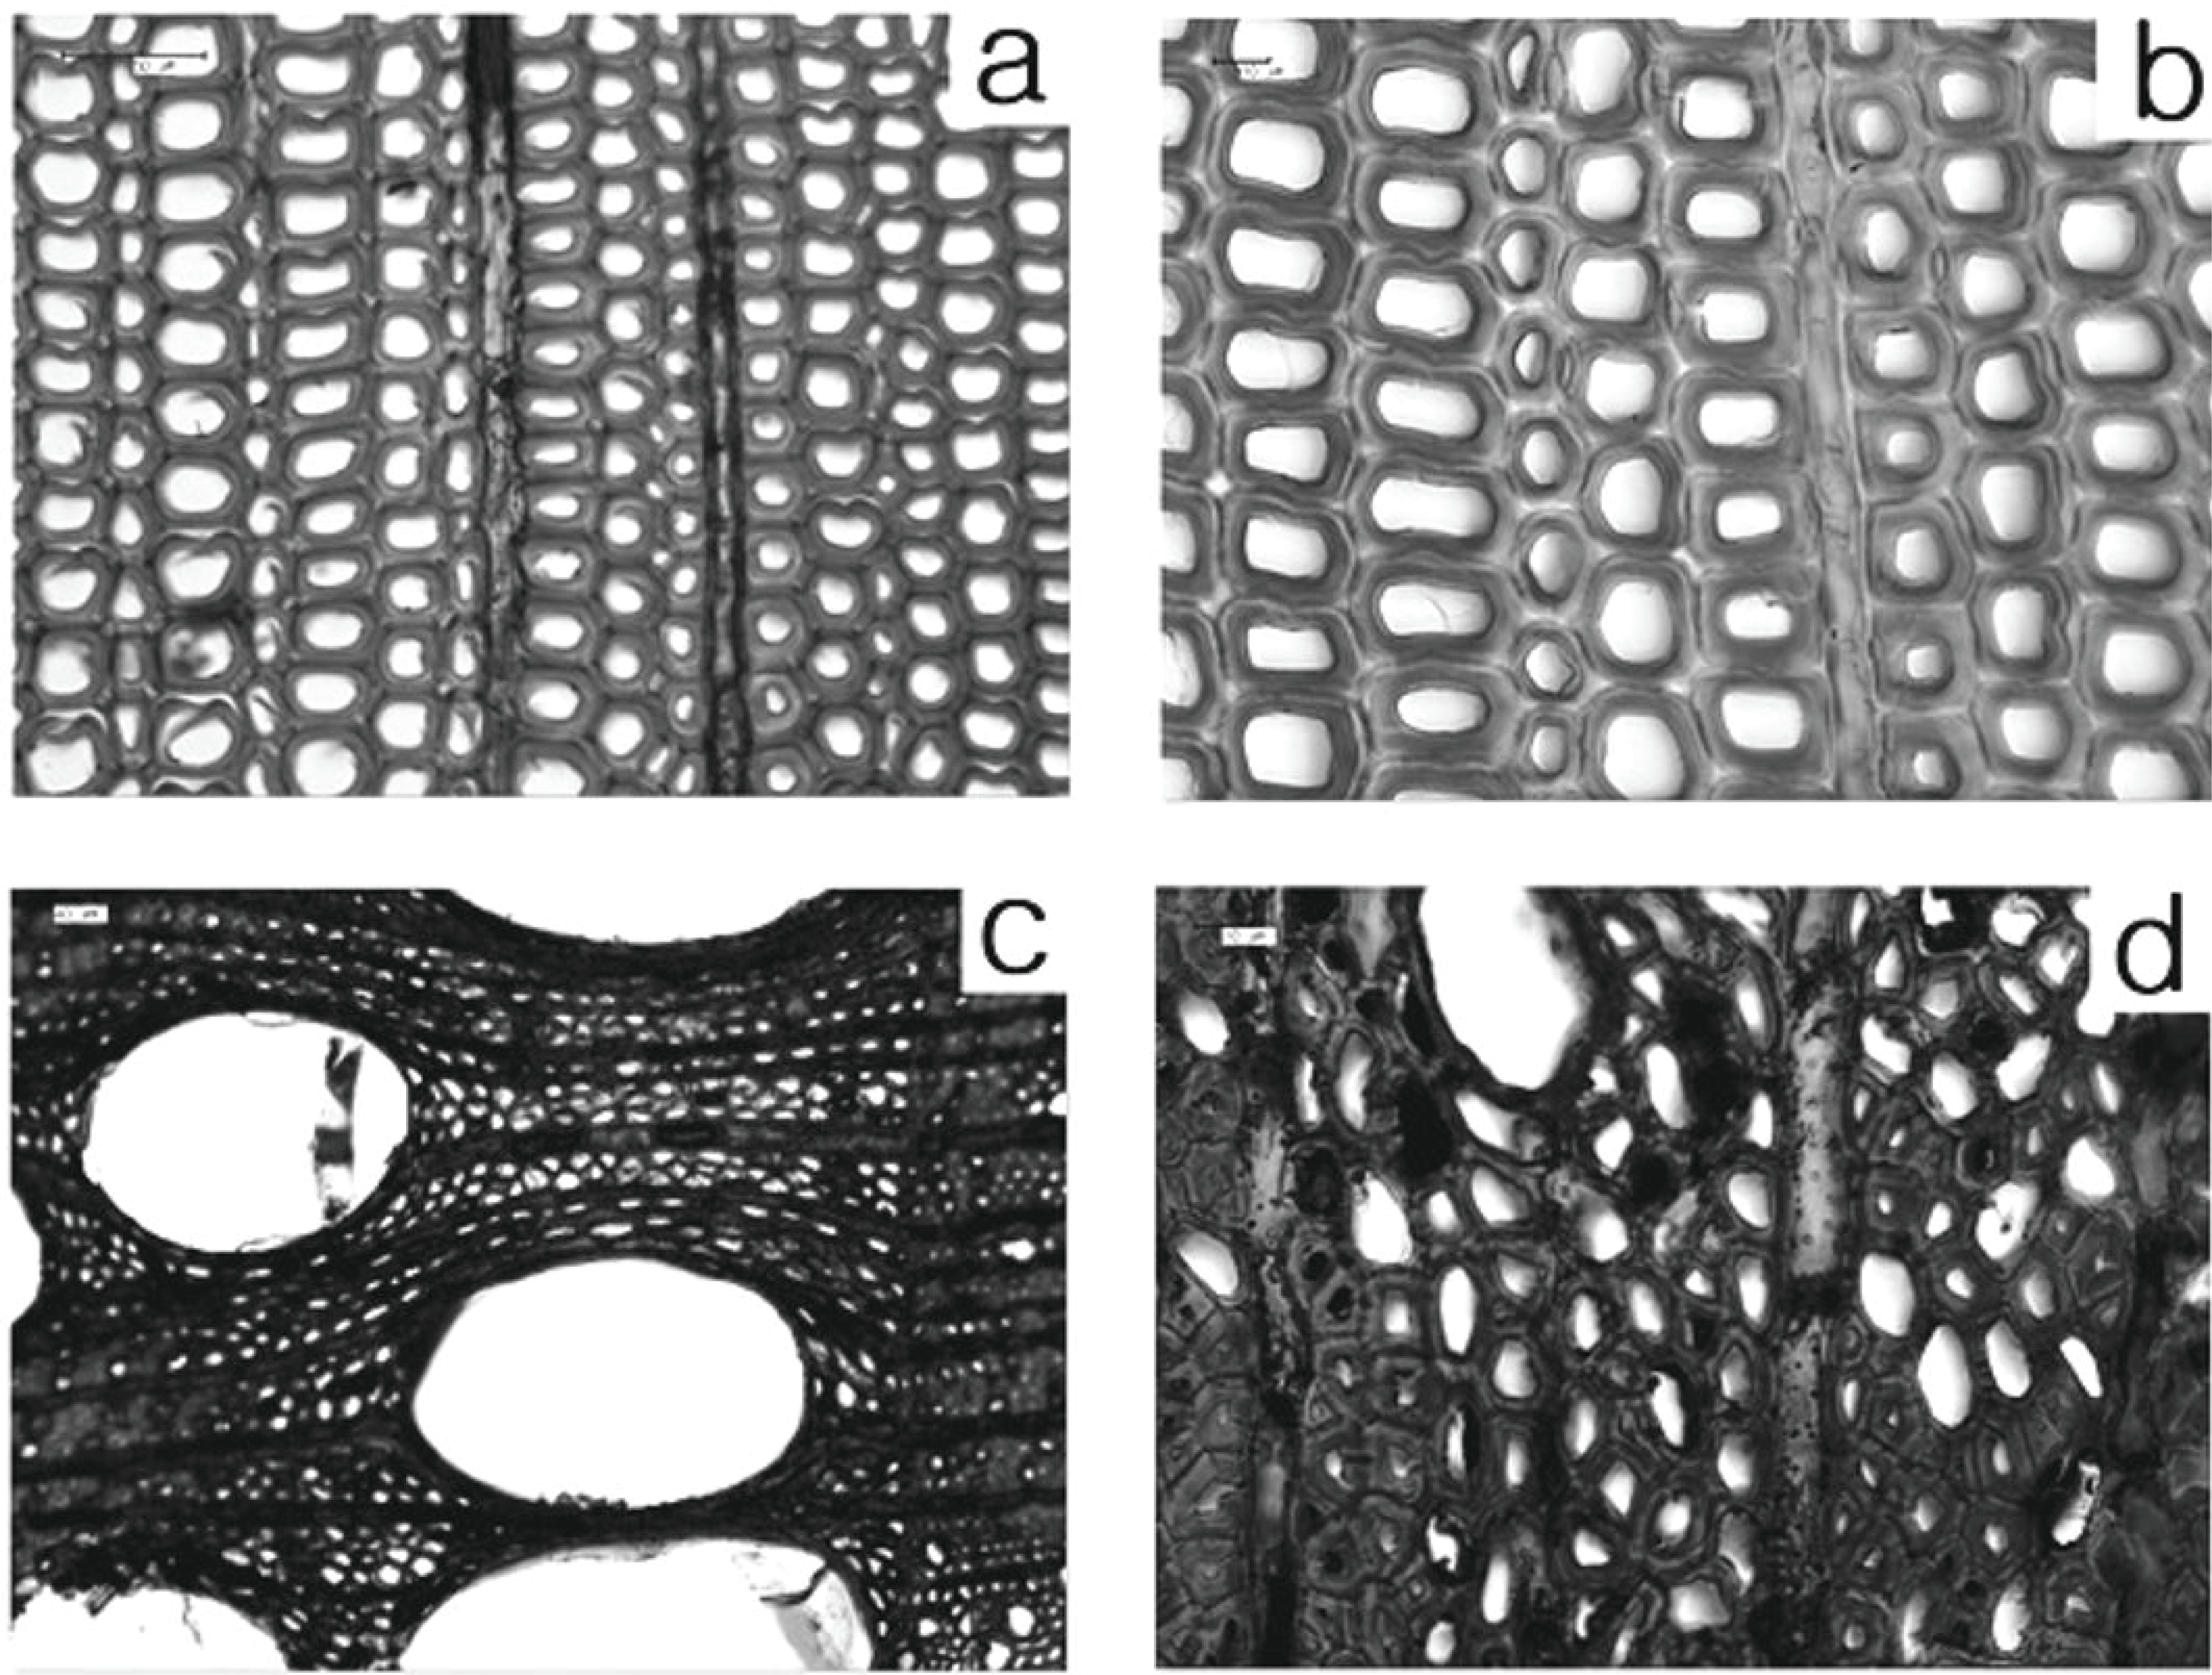
The light microscopy observations for cross sections of the wood samples are shown in Fig. 5. The typical characteristics of waterlogged wood include the degradation of secondary walls or the formation of cavities by microbial attack (Björdal, 2012). However, no significant change was found after 6 months in this study, and most of the cell walls were well-preserved. In the Korean red pine sample after 3 months, the secondary wall of late wood was maintained with a high density (Fig. 5a). After 6 months, ray cells, cell lumen, and middle lamella were well-preserved. In the sawtooth oak samples, no evidence of deterioration was observed in the vessel and axial parenchyma cells which was a similar finding to that of the Korean red pine samples.
4. CONCLUSION
In order to investigate the degree of deterioration of the excavated waterlogged wood, studies generally only use small samples for analysis. It is necessary to use various analytical methods (e.g., FT-IR, XRD, SEM, and ICP) to determine the degree of deterioration; however, it is difficult to perform various analyses with limited samples. In this study, the deterioration process of Korean red pine and sawtooth oak samples buried for 6 months in an intertidal zone was investigated using various analytical methods. The results of light microscopy, XRD, FT-IR, and chemical composition analysis revealed that there was no significant deterioration of the two wood species during 6 months. Inorganic components were accumulated in the lumen of the samples, which decreased their maximum moisture content; however, this decrease differed between the Korean red pine and sawtooth oak samples due to the different cell types. Although, the deterioration behavior was not revealed during relatively short period (6 months) of this study, data regarding the chemical changes during the deterioration process are still useful for suggesting appropriate preservation methods for valuable archaeological waterlogged wood.

