1. INTRODUCTION
Lignin has been produced through various processes using lignocelluosic biomass, which are readily available in large amounts. Lignin has aromatic ring structures chemically, and thus it has been considered potentially as promising raw materials. In general, the method of isolating lignin from lignocellulosic biomass can be a acrucial factor in consideration of its end-uses (Ragauskas et al., 2014; Strassberger et al., 2014). Most of lignin are produced in paper and pulp industries, and further processes for making the lignin as value-products have been attempted to improve economic value (Doherty et al., 2011; Kim et al., 2017; Lee et al., 2019; Leskinen et al., 2015).
Among commercial lignins, kraft lignin in black liquor is a commonly used as energy sources in kraft puling process. Despite the variety of availability, the utilization of kraft lignin is restricted by condensed inter- unit linkages due to a complex degradation and condensation during the pulping process. In addition, use of the lignin is limited by its structural diversity in terms of high polydispersity and non-uniform reactivity. Besides, different functional groups in kraft lignin make its utilization quite challenging (Jiang et al., 2016; Vishtal and Kraslawski, 2011).
Several techniques have been introduced to obtain and separate the lignin with uniform properties. For example, selective precipitation based on pH has been conducted by adding acidic agents such as sulfuric and hydrochloric acids (Helander et al., 2013; Lourencon et al., 2015; Sun et al., 1999; Zhu et al., 2015). Ultrafiltration is one technique for separating lignin compounds based on molecular cut-off. It has sparked great interests in several fields such as chemical, biological, and pharmaceutical industries (Humpert et al., 2016; Toledano et al., 2010). However, each method has its own disadvantages, such as low purity, and high cost associated with filtration.
Organic solvent extraction or fractionation has been considered a promising method and efficient and economical process for lignin fractionation; it has powerful advantages for separating lignin compounds according to definite molecular weight and functionality. Based on these advantages, many studies have already been conducted using this technique over the last few decades (Helander et al., 2013; Jiang et al., 2016; Kim et al., 2017; Li et al., 2012; Park et al., 2018; Thring et al., 1996; Wang et al, 2010). Lignin fractionation with organic solvents is typically performed by liquid- liquid phase separation using a solid lignin sample as a starting material. Although the technique has gained much attention, it has limited applicability in bulk processing.
In this study, open-column fractionation was used to improve existing techniques, and fractionate lignin compounds according to their molecular weight and functionality. Open-column chromatography is a simple method that is widely used to isolate certain chemicals as value-added products. This technique has some advantages; it can easily eliminate contaminants from the sample, and low-cost silica-gel is used as a typical stationary. Thus, it can improve process efficiency in terms of price competitiveness. Before the column-fractionation, lignin solubilization using peracetic acid (PAA) was first conducted. PAA is a promising oxidant for dissolving lignin and deconstructing its structures, which has widely applied to bio-refinery fields. In our previous papers, it demonstrated the effect on lignin degradation and changing solubility, and proposed the total utilization processes of lignocellulosic biomass using the PAA (Choi et al., 2019; Park et al., 2019; Park et al., 2020). Based on the results from previous studies, we attempted a study to facilitate the selective use of lignin.
2. MATERIALS and METHODS
Kraft lignin (KL, hardwood) was provided by Moorim P&P Co. and it was used as a starting materials. Chemical composition of the KL is described in Table 1.
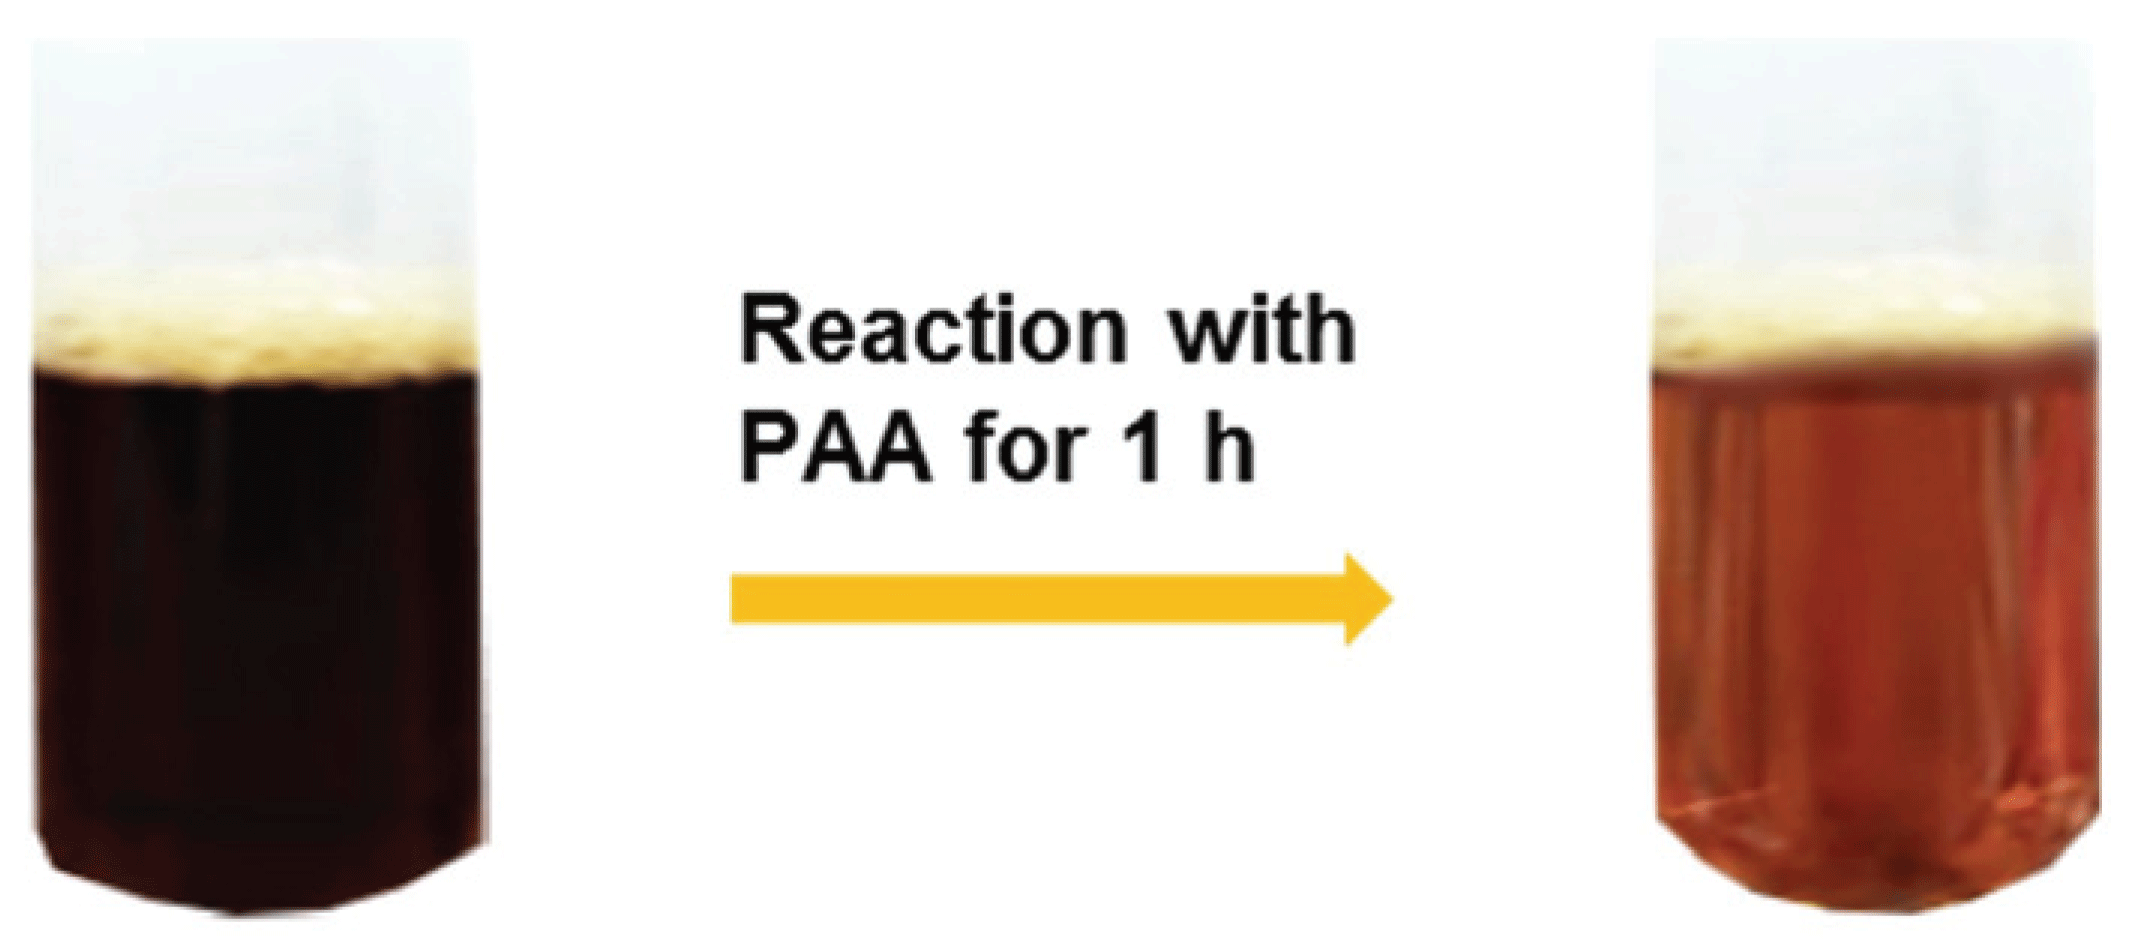
KL (approximately 1 g) was put into a glass bomb and dissolved in 30 mL of a solution of acetic acid (AA, 98%) and hydrogen peroxide (HP, 30%) at 4:1 (v/v) for the reaction. The solution was titrated using the procedure referred by our previous paper (Park et al., 2020). It contained 1.5% of PAA and 5.8% of HP, respectively. The PAA treatment was conducted at 80°C for 1 h using a dry block (MG-2200, EYELA, Japan). After the reaction, the completely liquefied sample (Fig. 1) was obtained and diluted with 10-fold with distilled water to adjust the pH to 2. The diluted liquid was extracted twice with 300 mL of ethyl acetate (EA). For further fractionation processes, solvent was removed using a rotary evaporator at 40°C, and the remaining solute was freeze-dried. The residual aqueous fraction, which was not extracted by EA, was also freeze-dried.
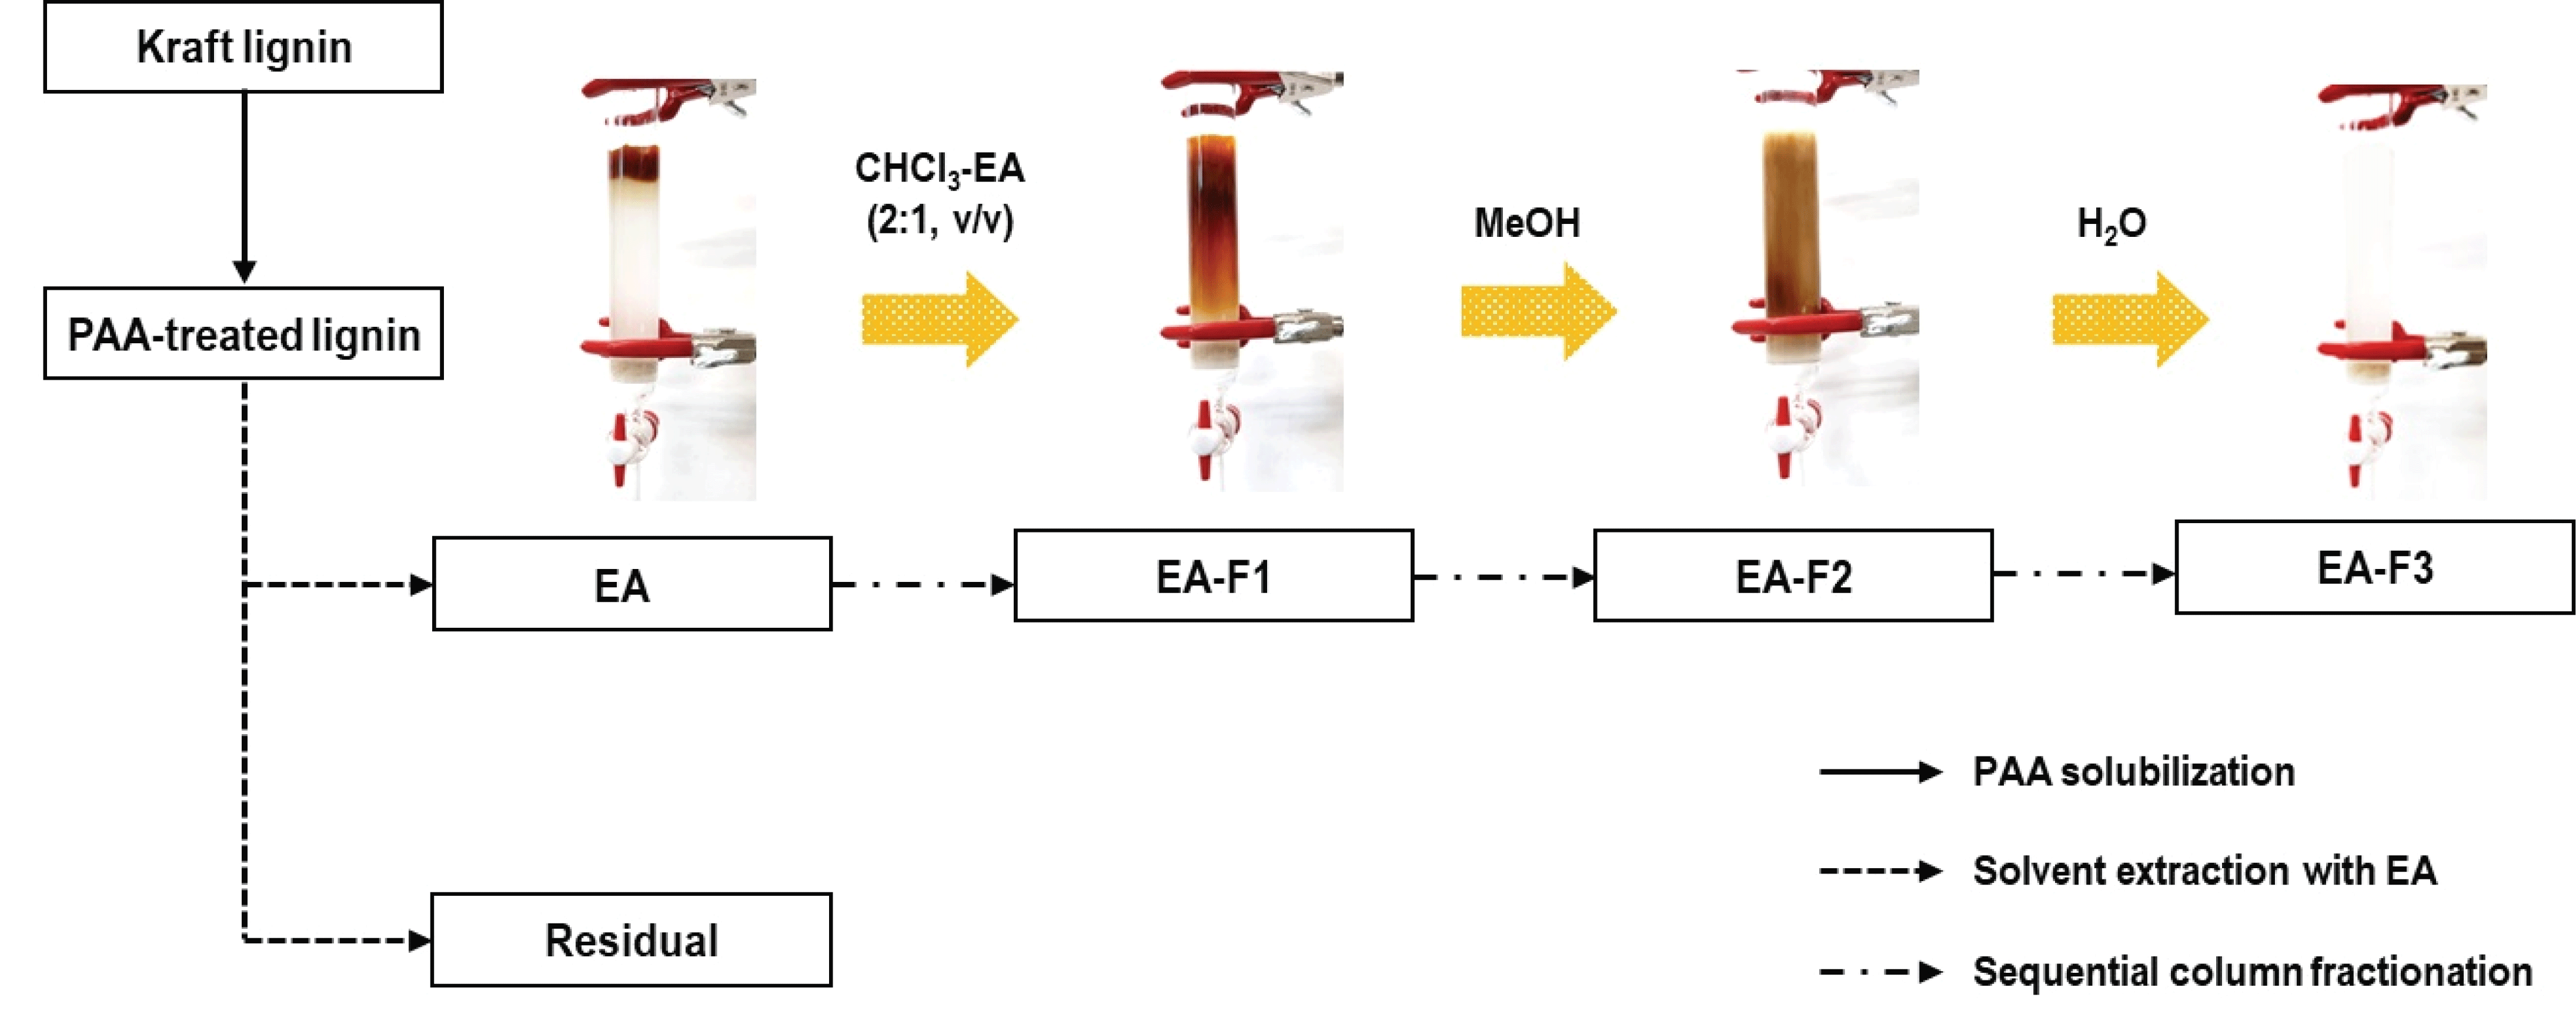
The EA-soluble products in KL were fractionated using open-column chromatography system to separate the lignin fractions; 20 g of silica gel was used as a stationary phase and chloroform (CHCl3) was poured into a glass tube (2.8-cm inner-diameter). Then, the EA-soluble products (dissolved in 4 mL of EA) were added to the column. The solvent fractionation was conducted using 200 mL of CHCl3-EA (2:1, v/v), methanol (MeOH), and distilled water (H2O), successively. After fractionation, each fraction was evaporated to remove the solvent and freeze-dried for further analysis. The overall process and nomenclature for each fraction is as shown in Fig. 2.
EA: Ethyl acetate fraction
EA-F1: EA fractionated with chloroform:ethyl acetate (2:1, v/v)
EA-F2: EA fractionated with methanol
EA-F3: EA fractionated with water
Residual: Residual aqueous fraction
GPC was performed to analyze the molecular weight of the lignin. Acetylation was conducted before GPC analysis to improve the solubility of the solid samples. The solid samples were acetylated with pyridine and acetic anhydride (1:1, v/v) at 105°C for 2 h. After acetylation, the reacted solid was obtained by dropping the water and centrifuged. The molecularweight distribution and polydispersity index (PDI) of the acetylated samples from each fraction was determined by GPC using a 1260 Infinity II refracting index detector (Agilent Technologies, Santa Clara, CA, USA) equipped with a PLgel5 μm MIXED-C column (300 × 7.5 mm2, VARIAN). The rate of mobile phase (THF) flow was set at 1 mL/min. and the sample injection volume was 20 μL. Molecular weight calibration was carried out using several polystyrene standards. The range was from 266 to 60,000 Daltons.
The types of carbon linkages of each lignin fraction were investigated by conducting 13C-NMR analysis. About 60-80 mg of each solid sample were dissolved in 0.6 mL of dimethyl sulfoxide-d6 (DMSO-d6, Sigma Aldrich Co.). Deuterium oxide (D2O) was used as a solvent samples, which did not dissolve in DMSO-d6. NMR data was recorded at 60°C for 8 h using a spectrometer set to 600 MHz (ADVANCE 600, Bruker, Germany).
The structural differences between fractions were compared by performing FT-IR analysis. FT-IR spectra were obtained using a Nicolet 6700 spectrometer (Thermo Scientific, USA). For each sample, 32 scans were recorded in 4,000-650 cm-1 spectral range at a 8 cm-1 resolution. Spectral data were collected with OMNIC 9.2 (Thermo Fisher Scientific Inc. USA) software.
3. RESULTS and DISCUSSION
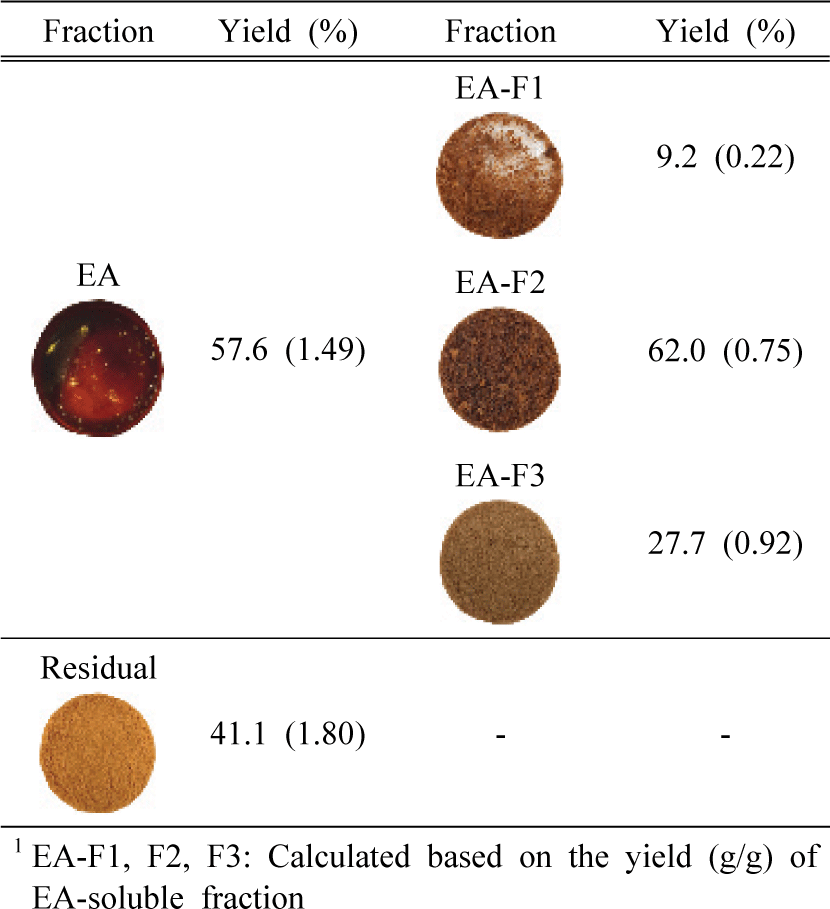
Totally liquefied KL after PAA treatment was extracted by EA to divide into organic and water-soluble fractions. As shown in Table 2, the yield of the EA fraction was 57.9%, and this fraction was sequentially fractionated followed by CHCl3-EA (EA-F1), MeOH (EA-F2), and H2O (EA-F3). Meanwhile, significant amounts, 41.1% yield, of residual aqueous fraction (Residual) were obtained after PAA treatment.
|
The yields of the three fractions obtained from EA-soluble compounds were shown in Table 2, and EA-F2 showed the highest yields (62.0%) among them. Interestingly, EA-F2 and EA-F3 obtained from EA-soluble fractions were not dissolved in EA after column fractionation due to structural changes in the two fractions after PAA treatment.
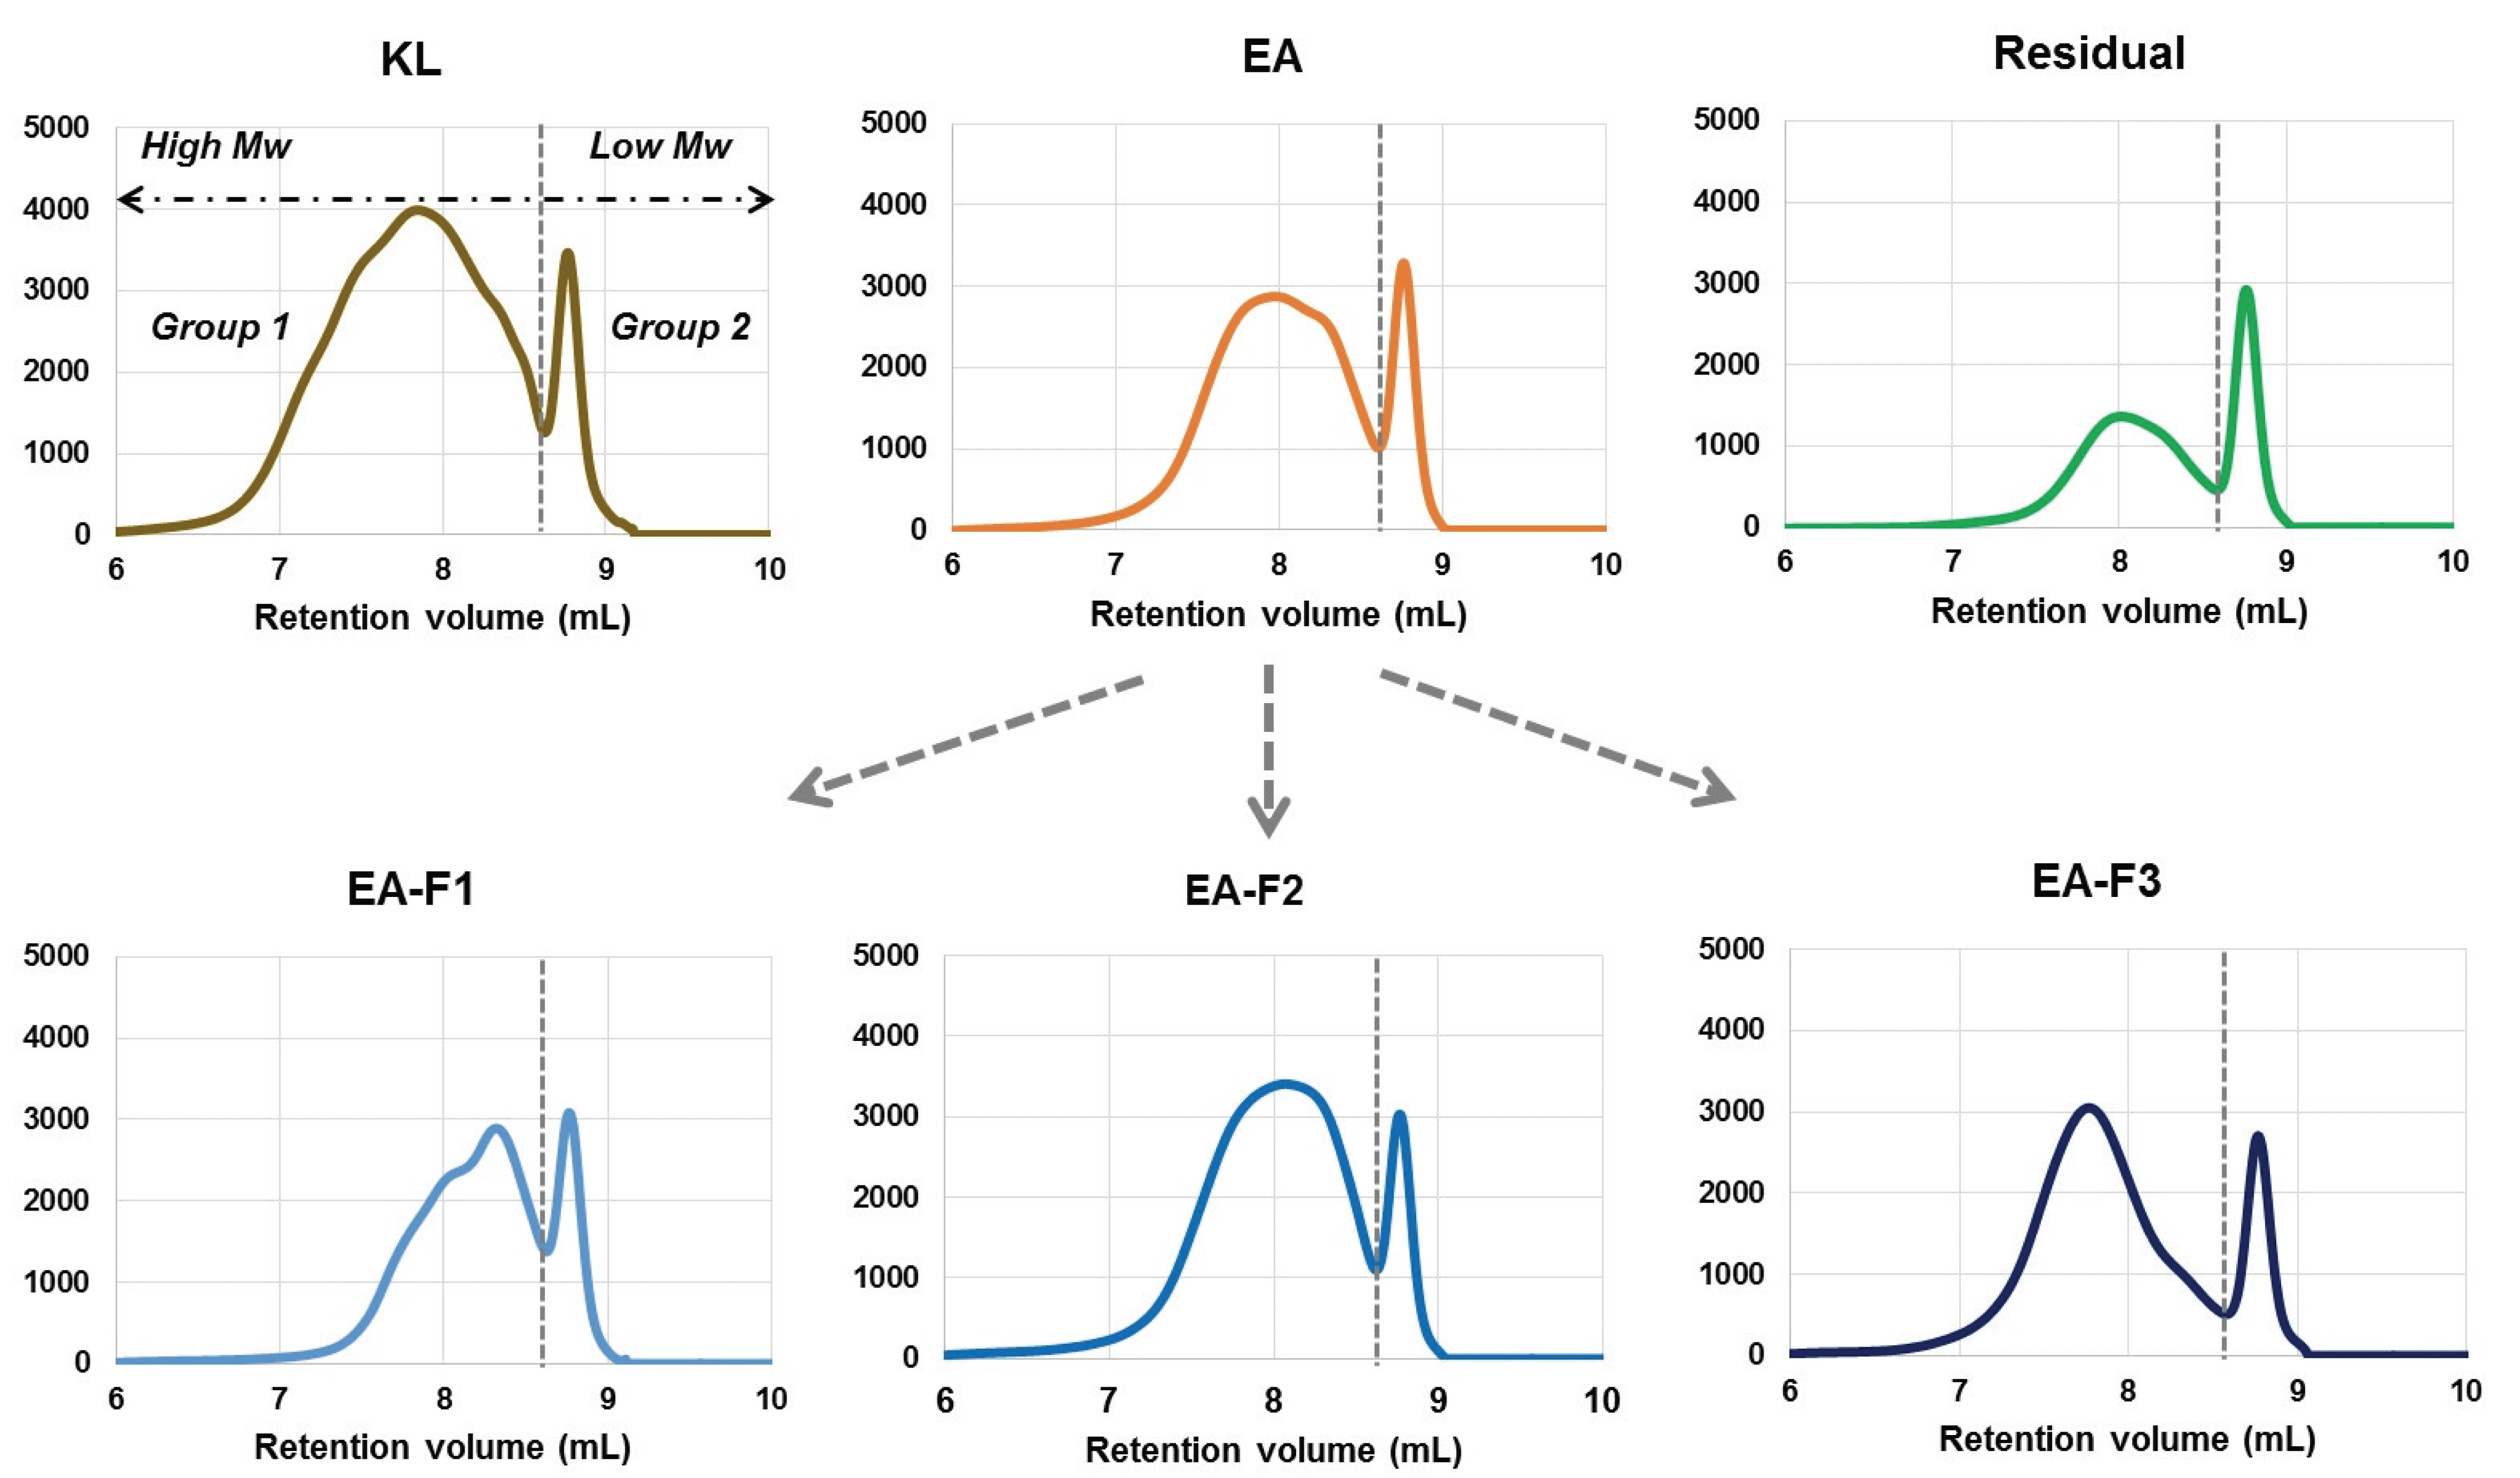
Solvent extraction and column fractionation were performed in this study to fractionate the PAA-treated lignin with different molecular weight and characteristics. All fractions exhibit bimodal molecular weight curves as shownin Fig. 3, which meant that lignin-derived molecules were present with specific molecular weight ranges, collectively.
Table 3 shows the molecular weight values of all fractions. The Mw of all fractions (acetylated) was significantly decreased compare tothat of untreated KL (4,068 Da). The Mw of EA and Residual fractions were 2,075 and 1,221 Da, respectively. Meanwhile, chloroform, ethyl acetate and methanol were used to sequentially fractionate EA soluble products. The Mw and polydispersity index (PDI) of the three fractions increased in proportion to the solvent polarity increase as shown in Table 3. These tendencies were similar to those of previous studies, and it has been reported that when polar solvents, such as methanol, and acetone, were used for fractionation, the molecular weight and PDI increased (2013; Kim et al., 2017; Li et al., 2012; Park et al., 2018; Thring et al., 1996; Wang et al, 2010). Solubility and hydrogen bonding parameters of the solvents used in study are presented in Table 4 (Sameni et al., 2017).
| No. | Solvent | δ (cal/cm3) | δh(cal/cm3)1/2 |
|---|---|---|---|
| 1 | Chloroform | 9.2 | 2.8 |
| 2 | Ethyl acetate | 9.1 | 3.5 |
| 3 | Methanol | 14.3 | 10.9 |
| 4 | Water | 23.5 | 20.6 |
As described in above, molecular weight and PDI of all fractions were divided into Group 1 and 2 based on the median value of 8.6 mL (Fig. 3). In addition, the relative quantitative percentages were calculated by dividing the entire area by the median value. As can be seen from the results at the bottom of Table 3, it was expected that Group 2 in the diagram would consist of low-molecular weight compounds in the range of 261~275 Da. However, Group 1 was observed as relatively high-molecular weight lignins, while PDI was significantly decreased compared to untreated KL. In particular, Group 1 of the EA-F2 fraction was mainly comprised of high weight molecules, which accounted for 87% of the entire area.
It is important to have a uniform structure for lignin application, and thus PDI is considered an important criterion. Among the fractions, the Residual fraction showed the lowest PDI in Group 1. However, since the portion of Group 1 was the lowest at 66%, the separation of the each group according to molecular weight may be necessary to use those that have narrow molecular weight distribution.
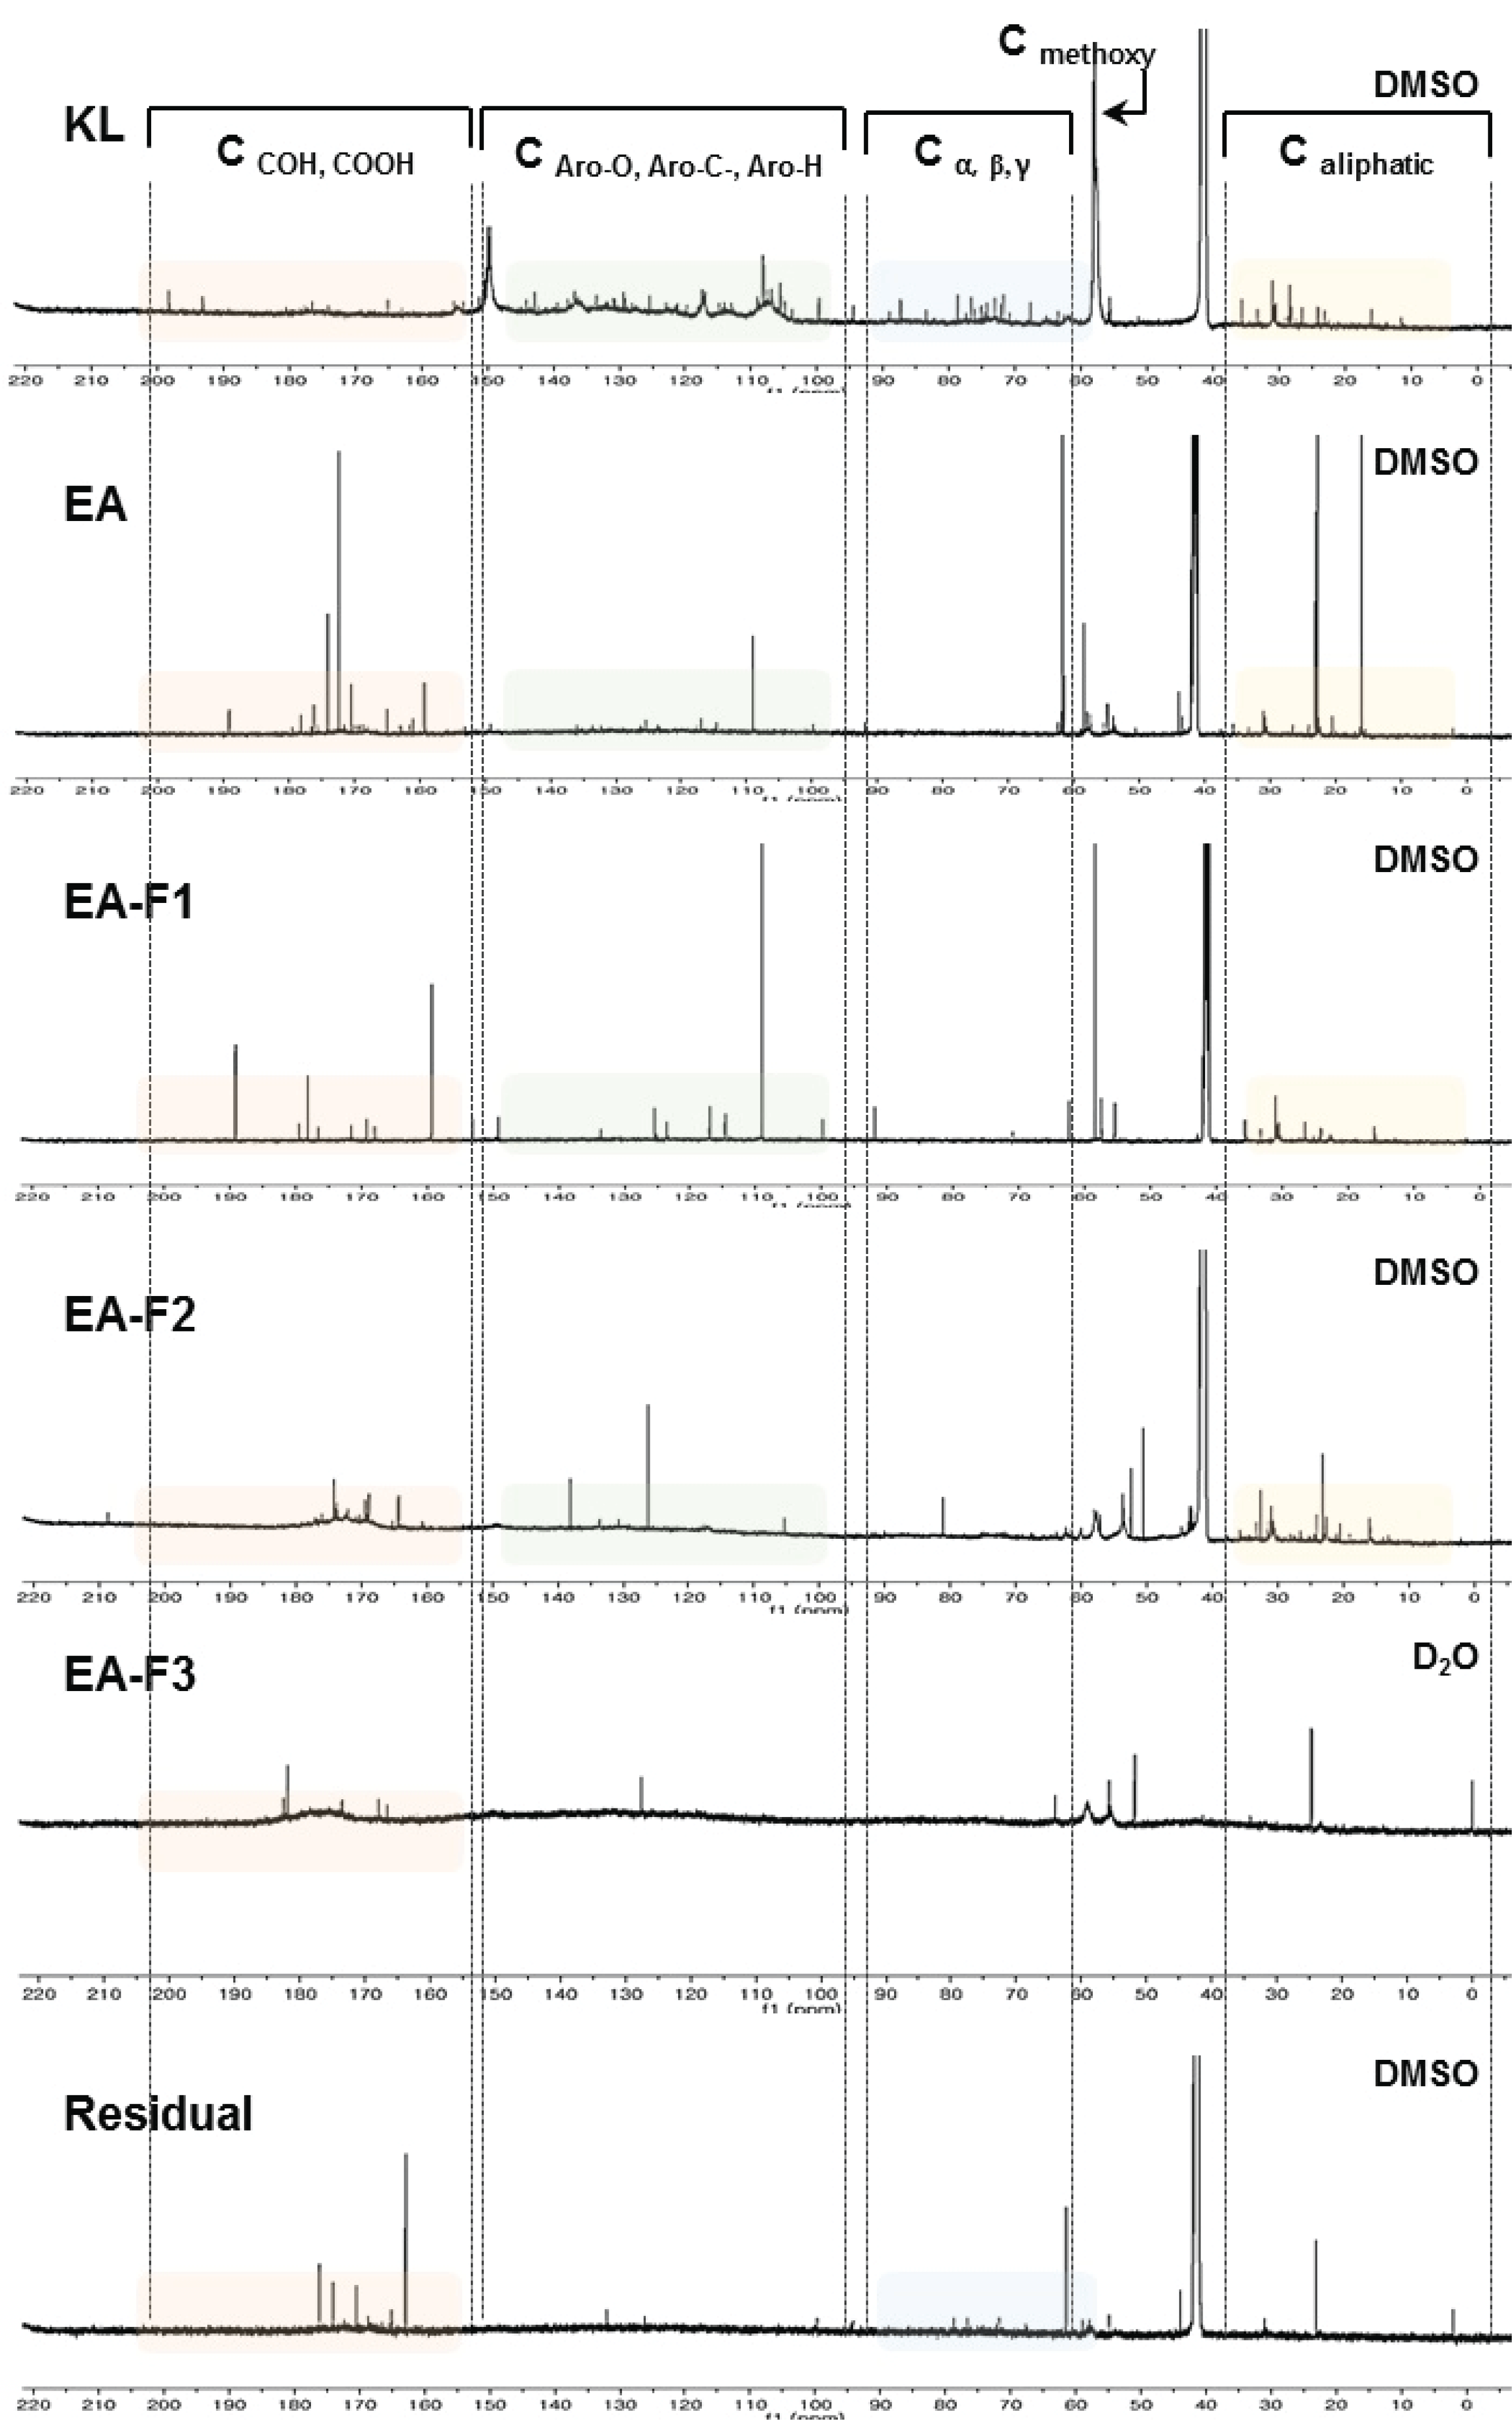
The carbon bond types ofKL and their fractions, obtained by solvent extraction and column fractionation, were investigated by performing 13C-NMR analysis. At 100-150 ppm as shown in Fig. 4, carbon signals originating from aromatic structure; which included symmetric carbons in syringyl units, etherified carbons in guaiacyl units and non-etherified carbons; were typically observed. Meanwhile, C-α, C-β, C-γ carbons in β-O-4 were observed around at around 58-100 ppm. In addition, a strong peak at 55 ppm indicated a typical carbon signal from the methoxy group (-OCH3) in the lignin structure. At 151-200 ppm, the C=O signals of carboxylic and carbonyl groups in aromatic and aliphatic structures structures were also observed (Capanema et al., 2004; Chen and Robert, 1988; Mörck et al., 1986; Terashima et al., 2002; Wen et al., 2013). Based on these results, the carbon signal patterns of each fraction were compared.
Untreated KL showed diverse carbon signals in all spectral regions. In particular, carbons were clearly observed in aromatic structures of lignin. In addition, aryl-ether-linked carbon signals at 55-100 ppm and aliphatic carbons were also commonly observed. KL was generated bythe kraft pulping process, which made lignin structures more condensed compared to natural lignin in wood because the process needs a comparatively high temperature. However, aryl-etherlinked carbons were maintained at 55-100 ppm. Meanwhile, EA and Residual fractions were obtained after PAA solubilization, and these fractions showed simple peaks compared to KL. In particular, the number of carbons related to the aromatic structure and those of aryl-ether-linked carbons were clearly decreased; these can explain how PAA cleaved the linkage of lignin structures and produced less-complex lignin-derived compounds.
Meanwhile, three fractions obtained by open-column fractionation using EA-soluble compounds showed significant differences between each fraction. In particular, the EA-F3 fraction did not show carbon signals originating from aromatic structures in lignin. Only few signals were observed at 151-200 ppm, which means that compounds in the EA-F3 fraction may not have contained aromatic compounds.
Intensive signals of C=O from carboxylic or carbonyl group were observed in all fractions; these functional groups can be involved in solubility. As the lignin moieties containing methoxyl group conjugate bonds decreased, the compounds became hydrophilic substances. According to previous research, PAA solution can result in demethoxylation of the lignin structure. Therefore, some fractions did not dissolve in organic solvents due to changes in the functional groups.
Fig. 5 shows the FT-IR spectra of each fraction obtained by solvent extraction and fractionation. At the top of the spectra, KL indicates typical untreated lignin assignment and its spectrum was used as a reference for comparison with other fractions. The bands for aromatic skeleton vibrations were at 1598, 1513, 1455 cm-1, included C=C. In addition, C-O bands related to ether bonds in syringyl and guaiacyl groups were also observed at 1400-1000 cm-1. The band assignments were similar to typical peaks related to lignin structure that are mentioned in previous studies. At around 1660-1800 nm, the strong bands indicated that C=O peaks originated from the carboxylic acid carbonyl groups that were present in organic polymers (Lisperguer et al., 2009; Sills and Gossett, 2012; Zhou et al., 2011). EA-soluble compounds obtained by solvent extraction after PAA treatment were sequentially fractionated by the column. Interestingly, there was no peak related to the aromatic skeleton from lignin in the EA-F3 fraction. Furthermore, the intensity of the C=O bands was also decreased in the EA-F3 fraction; these corresponded to the 13C-NMR results that also showed that no carbon signal was involved the aromatic structures.
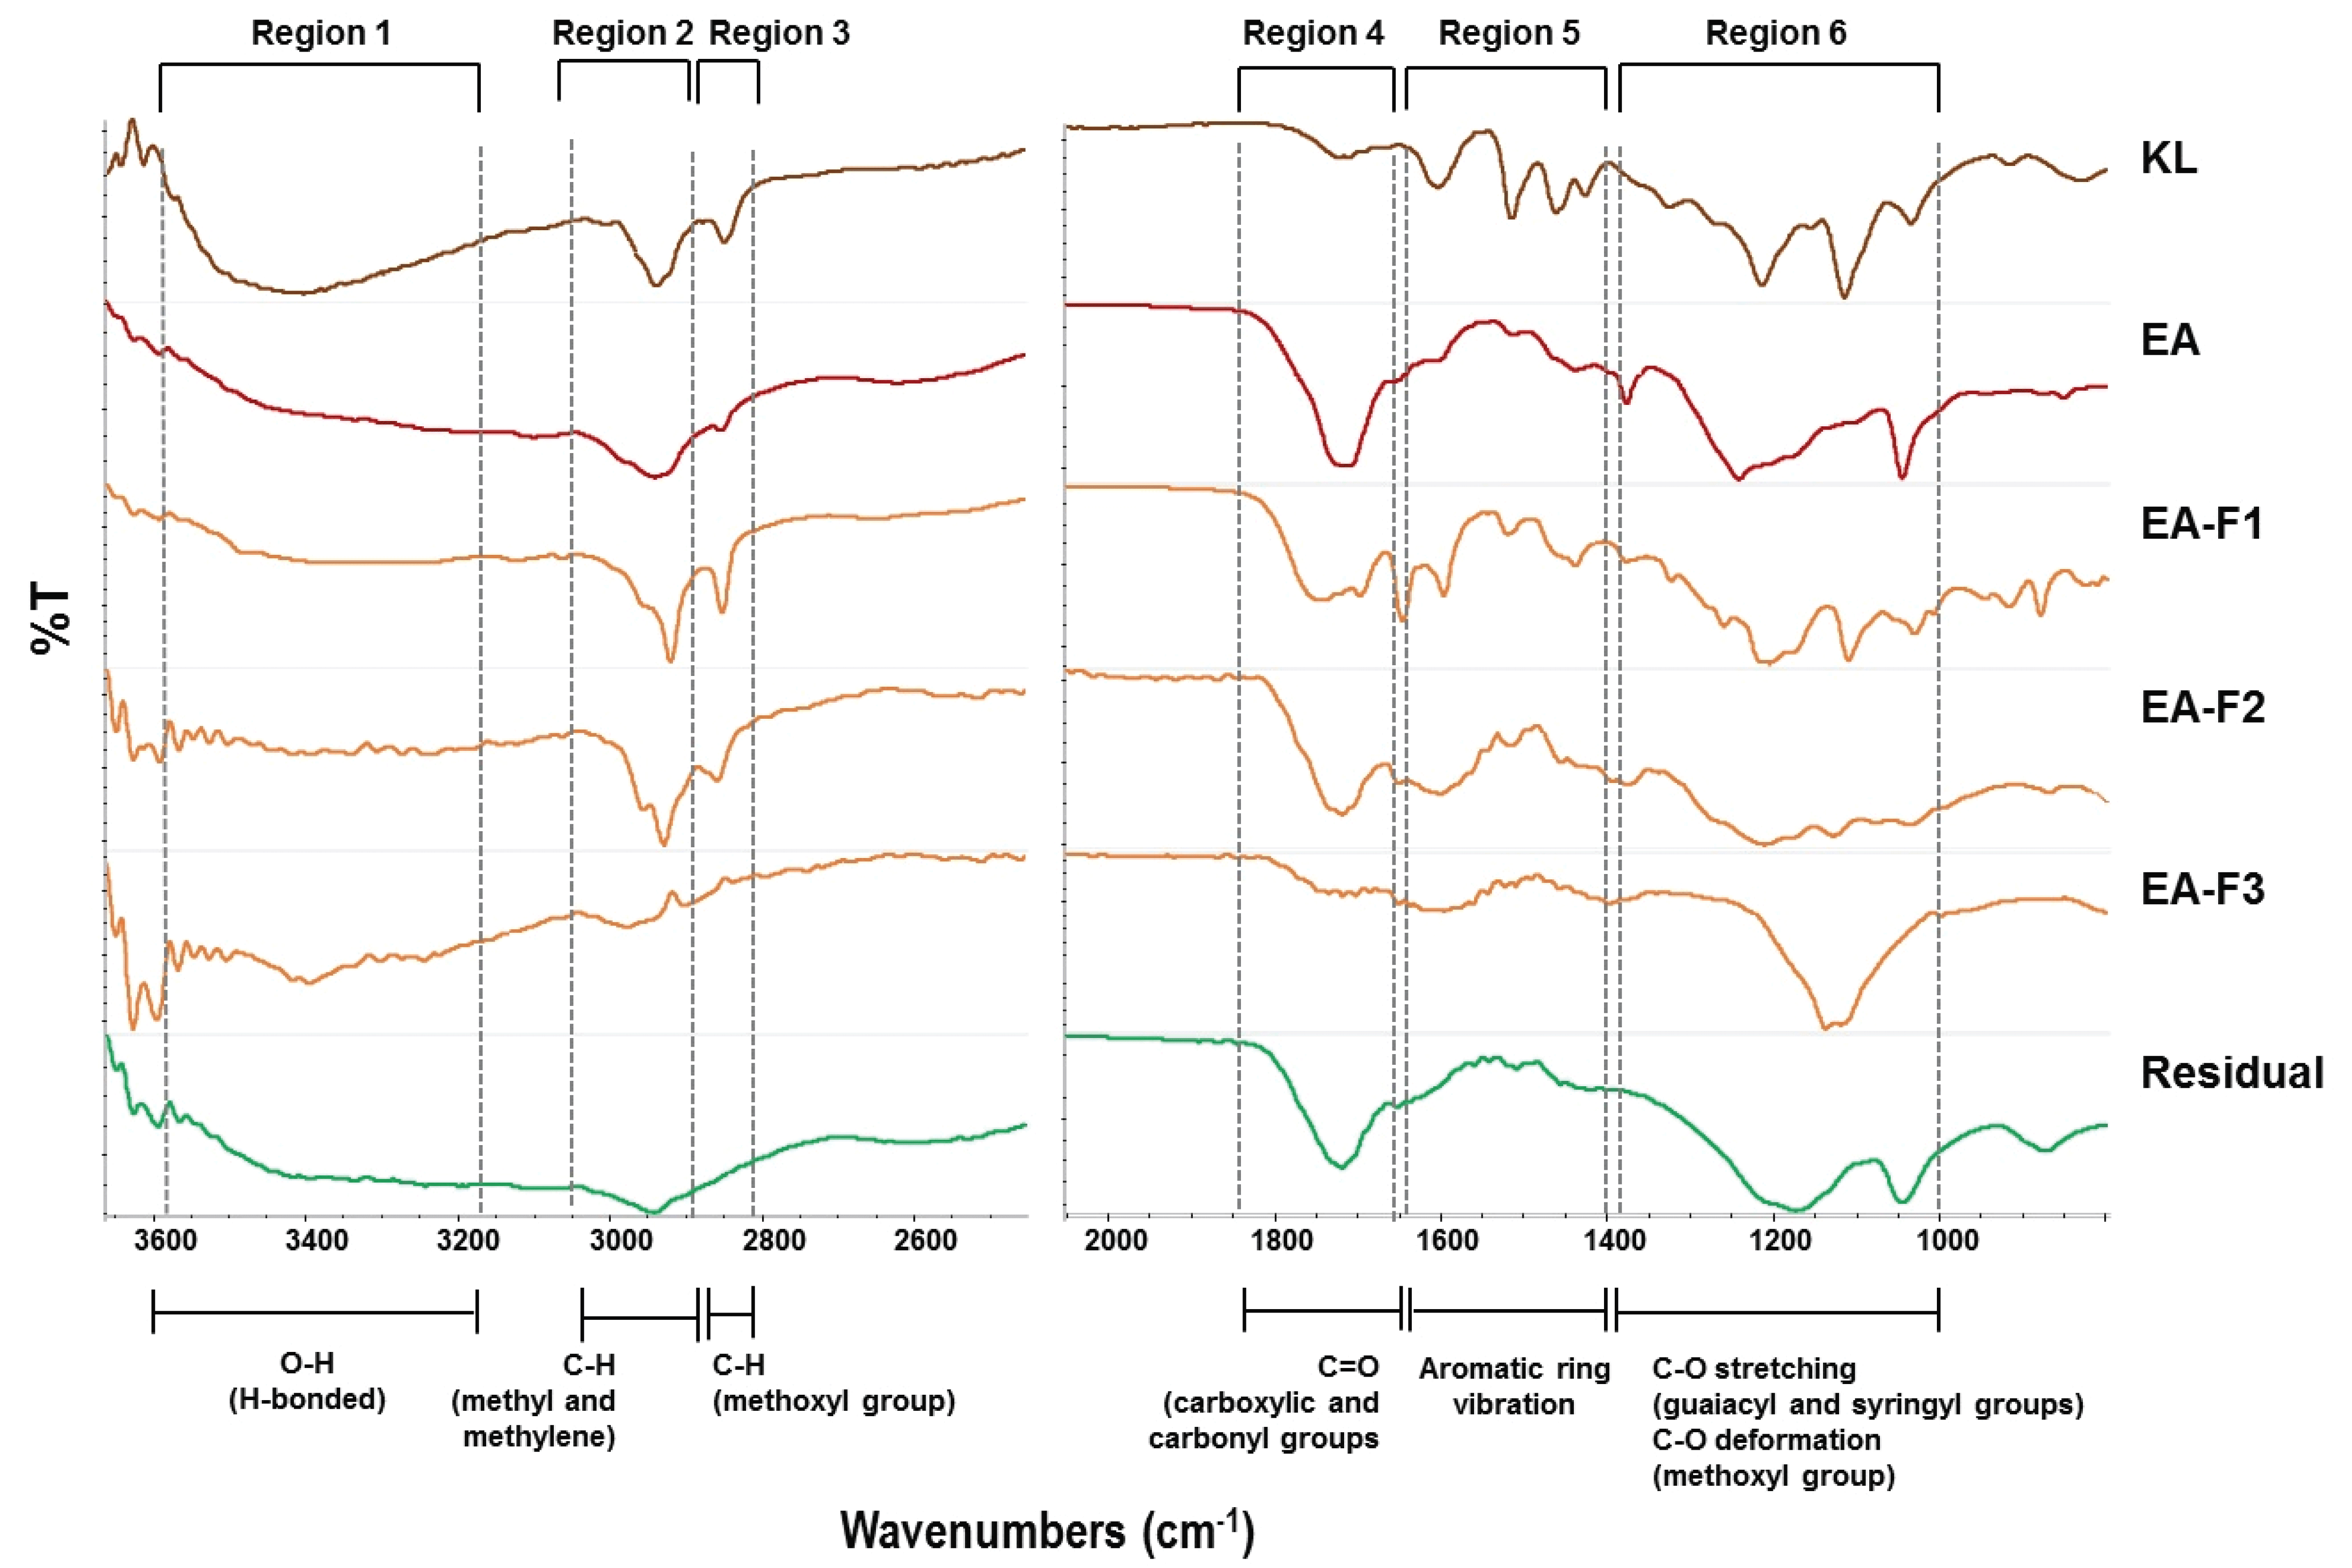
Meanwhile, the Residual fraction showed a simple spectrum pattern compared to other fractions, and this was similar to the patterns of poly-carboxylate polymers. The signal at near 1700 cm-1 proves the existence of ester bonds; the peaks at around 1400 cm-1 represent for –CH2-, and the signal at 1100 cm-1, proved that it was similar to the poly-carboxylate-type molecular structure (Mohamed et al., 2016; Zhang et al., 2014). Recently, our research reported that water- soluble lignin obtained by PAA treatment shows better performance on cement fluidity compared to commercial plasticizers (lignosulfonate and polycarboxylate ether) (Kim et al., 2020). As such, the Residual fraction has similar structural characteristics to polycarboxylate, which was probably due to PAA oxidation accompanied by carbonyl, hydroxyl, and methoxyl groups changes.
Among the fractions, EA-F3 and the Residual fractions were well-dissolved in water as mentioned in previous results. In particular, the peaks originating from CH2 and CH3 at 3000-2800 cm-1 were not observed in those fractions, which was evidence of demethoxylation by PAA. In other words, it is expected that the lignin-derived products in the two fractions were dissolved in water due to the change of the functional group.
4. CONCLUSION
Open-column fractionation was performed using several solvents to fractionate kraft lignin-derived compounds according to their molecular weight and chemical properties. Before column fractionation, PAA treatment was first carried out to dissolve and depolymerize the lignin, showing more uniform structures and changes of its functionality. After open-column fractionation, lignin in each fraction showed different molecular ranges and structures. In particular, lignin in some fractions (EA-F3 and Residual) that were dissolved in water did not show the original aromatic skeleton of lignin structure. It seemed that PAA-induced lignin dissolution, degradation and also structural changes with a large amount of carboxylic acid groups. In summary, combination of PAA solubilization and open-column fractionation could have a simultaneous effect on the deconstruction, low-molecularization of lignin and also separation of lignin-derived compounds according to their molecular weight range and structures. Based on these results, it was concluded that many problems related to complexity and heterogeneity of lignin could be improved through these techniques.

