1. INTRODUCTION
Indonesia is a tropical country and is well known as the third largest mega biodiversitycountry in the world. At least, there are approximately 4,000 tree species exist in the tropical rain forests of this country (Martawijaya et al., 2005). One of the most popular wood species in Indonesia is teak (Tectona grandis L. f.). The wood, especially from old trees, is considered to be one of the most valuable timbers and widely used as raw material for the best quality wooden furniture because it has decorative figures, strong, naturally durable, and stable (Lukmandaru, 2010). However, the availability of high-quality wood from old stands on the market is limited and more expensive in the last 10 to 15 years. Therefore, the industries are forced to utilize teakwood from young trees including trees that are less than 10 years old (Wahyudi et al., 2014; Hidayati et al., 2017; Park et al., 2018). Wood products made by these teak are often unstable and easily attacked by wood destroying organisms, especially termites.
The teakwood from Muna Island has been popular for wooden furniture industries since the Dutch colonial era (Fendi et al., 2017). Alongside its function as raw material for furniture manufacturing, the wood is also used for building components and others (Lempang and Asdar, 2007). For decades, teak trees planted on Muna Island were harvested when the stem diameter reached 40 cm or when the tree was 50-yearold. To shorten the time to harvesting, the fast-growing Muna teak seedlings, especially the Malabar clone, have been developed and propagated using in vitro sub-culture techniques in the last 10 years. The seedlings were exposed to 5–30 Gy gamma rays. Experimental results in the field showed that these seedlings grew rapidly with the average height 7 times taller than those of control or irradiated seedlings, while its width increment was 3–5 times larger. Considering the reasons, therefore, the harvesting time of less than 10 years has been determined.
Characteristics of this superior Muna teakwood have not been yet investigated. Therefore, the main objective of this study was to examine the anatomical characteristics and several physical-mechanical properties of the 8-year-old superior Muna teakwood to ensure their utilization as raw material especially for wooden furniture manufacture.
2. MATERIALS and METHODS
The main material used was a 6 cm thick wood disc and a 100 cm long log of 8-year-old superior Muna teakwood from a plantation forest area located at 4°51'38.8"S 122°37'00.2"E on Muna Island, Southeast Sulawesi Province, Indonesia. The disc was extracted from the tree’s height 1.30 m above the ground, while the log was obtained from a height of 20 m above the ground. Three different healthy trees classified by diameter, large (d≥ 30 cm), medium (21 cm ≤d< 30 cm), and small (d< 21 cm) were selected as the sample source. Diameter at breast high of each tree was 30.5 cm (the 1st tree), 24.0 cm (the 2nd tree), and 17.5 cm (the 3rd tree).
The disc surface was planned until the distinction of the sapwood and heartwood portions were seen, and then segmented with the dimensions of 2 cm × 2 cm × 6 cm from pith to bark to measure radial variation in fiber dimensions. Meanwhile, other samples with the same dimension representing heartwood zone were used for the macro- and microscopic anatomical characteristics observations. Samples of 1 cm × 2 cm × 6 cm representing sapwood, transition, and heartwood zone were used to measure wood moisture, density, specific gravity, and dimensional stability.
Wood samples for mechanical properties were prepared from the logs. The log was converted into 3 cm thick boards and then air-dried for 2 months until wood moisture ± 14%, then reconverted to wood samples. The sample size of static bending test was 2 cm × 2 cm × 30 cm, while for the compression stress parallel to grain test was 2 cm × 2 cm × 6 cm. To measure wood hardness, the remaining sample of static bending test free of visible defects is used as the sample. All measurements represented sapwood, transition, and heartwood with 3 replications of each portion.
Macroscopic characteristics namely the presence of growth rings, wood color, pattern, texture, wood grain, odor, luster, and the sapwood-heartwood portion were directly observed and measured by using handy and micro loupe of 15-20X magnifications.
Microscopic characteristics namely vessel elements, fibers, axial parenchyma, ray parenchyma, and intercellular canals were observed through microtome specimens of cross-, radial-, and tangential sections following the International Association of Wood Anatomist (Wheeler et al., 1989).
Fiber dimension was measured using maceration specimens prepared by modification of Schulze’s method. A total of 50 individual fibers from each segment were used for fiber length, fiber diameter, and lumen diameter measurements. Cell wall thickness was determined as half of the differences between fiber diameter and lumen diameter.
All measurements were conducted by gravimetric methods following BS 373-1957. Sample volume was measured by water displacement method. Moisture content (MC, %) as well as green density (ρ) and specific gravity (SG) of wood were calculated according to Equation 1, 2, and 3:
Where:
Wg = Sample weight in green condition (g)
Wod = Sample weight in oven-dried condition (g)
V = Sample volume in green condition (cm3)
ρwater = Density of water at 4°C (= 1 g/cm3)
Dimensional stability is approached by T/R-ratio, i.e. ratio between tangential and radial shrinkage from green to air-dried condition. The wood is stable if T/R-ratio ≈1, and unstable if T/R-ratio > 2.00 (Bowyer et al., 2003). Measurement was carried out following modification of BS 373-1957 (BSI, 1957). Each sample dimension (longitudinal/L, tangential/T, and radial/R) in green (initial), air-dried, and oven-dried condition was measured by digital caliper. The air-dried condition was obtained after exposing the sample to room temperature for 2 weeks, while the oven-dried condition was obtained after drying wood sample within a laboratory oven of (103±2 °C) until constant. Values of dimensional and volumetric shrinkages from green to airdried condition as well as from green to oven-dried condition, and T/R-ratio from green to air- dried condition were calculated according to Equation 4 and 5:
Where:
Sg.i. = Dimensional shrinkage from green to i condition (%)
Dg = Dimension in each direction (L, T, and R) in green condition (cm)
Di = Dimension in each direction (L, T, and R) in i-condition (cm)
i = Sample condition (air- and oven-dried conditions)
T/R-ratio = Shrinkage ratio of tangential and radial dimension
αT = Tangential shrinkage from green to air-dried condition (%)
αR = Radial shrinkage from green to air-dried condition (%)
Mechanical properties tests were carried out by means of the Chun Yen Universal Testing Machine (UTM) following BS 373-1957 (BSI, 1957). The static bending test, to obtain modulus of elasticity (MOE) and modulus of rupture (MOR), was conducted by employing a single-point loading at the center of the wood. The span and loading rate applied were 28 cm and 6.6 mm/minute, respectively. For compressive strength parallel to the grain (σ//), the 0.64 mm/minute of loading rate was applied, while for wood hardness (H) the steel ball was pushed towards radial and tangential surfaces of the wood sample. Values of MOE, MOR, σ//, and H were are calculated according to Equation 6 to 9:
Where:
ΔP = Load changes under proportion limit area (kgf)
Pmax = Maximum load (kgf)
L = Length of span (cm)
Δy = Deflection (cm)
b = Sample width (cm)
h = Sample thickness (cm)
A = Wood surface (cm2)
A’ = Steel ball surface (= 1 cm2)
Quantitative data was evaluated using Microsoft Excel 2016 to obtain the average value and standard deviation, while qualitative data was presented as figure or graph and compared to those of previous study. In the case of wood hardness, averages of its tangential and radial hardness are presented.
3. RESULTS and DISCUSSION
Macroscopic characteristics of the superior Muna teakwood were as follows: heartwood dark to golden brown, while sapwood yellowish-palewhite to reddishyellow white (Fig. 1 and 2); wood texture fine to moderately coarse (in the 1st and 3rd trees), but fine to coarse (the 2nd tree); wood grain straight to shallowly interlocked; without luster, growth ring distinct (Fig. 1, 2, and 3), have decorative figures and machine oil odor.


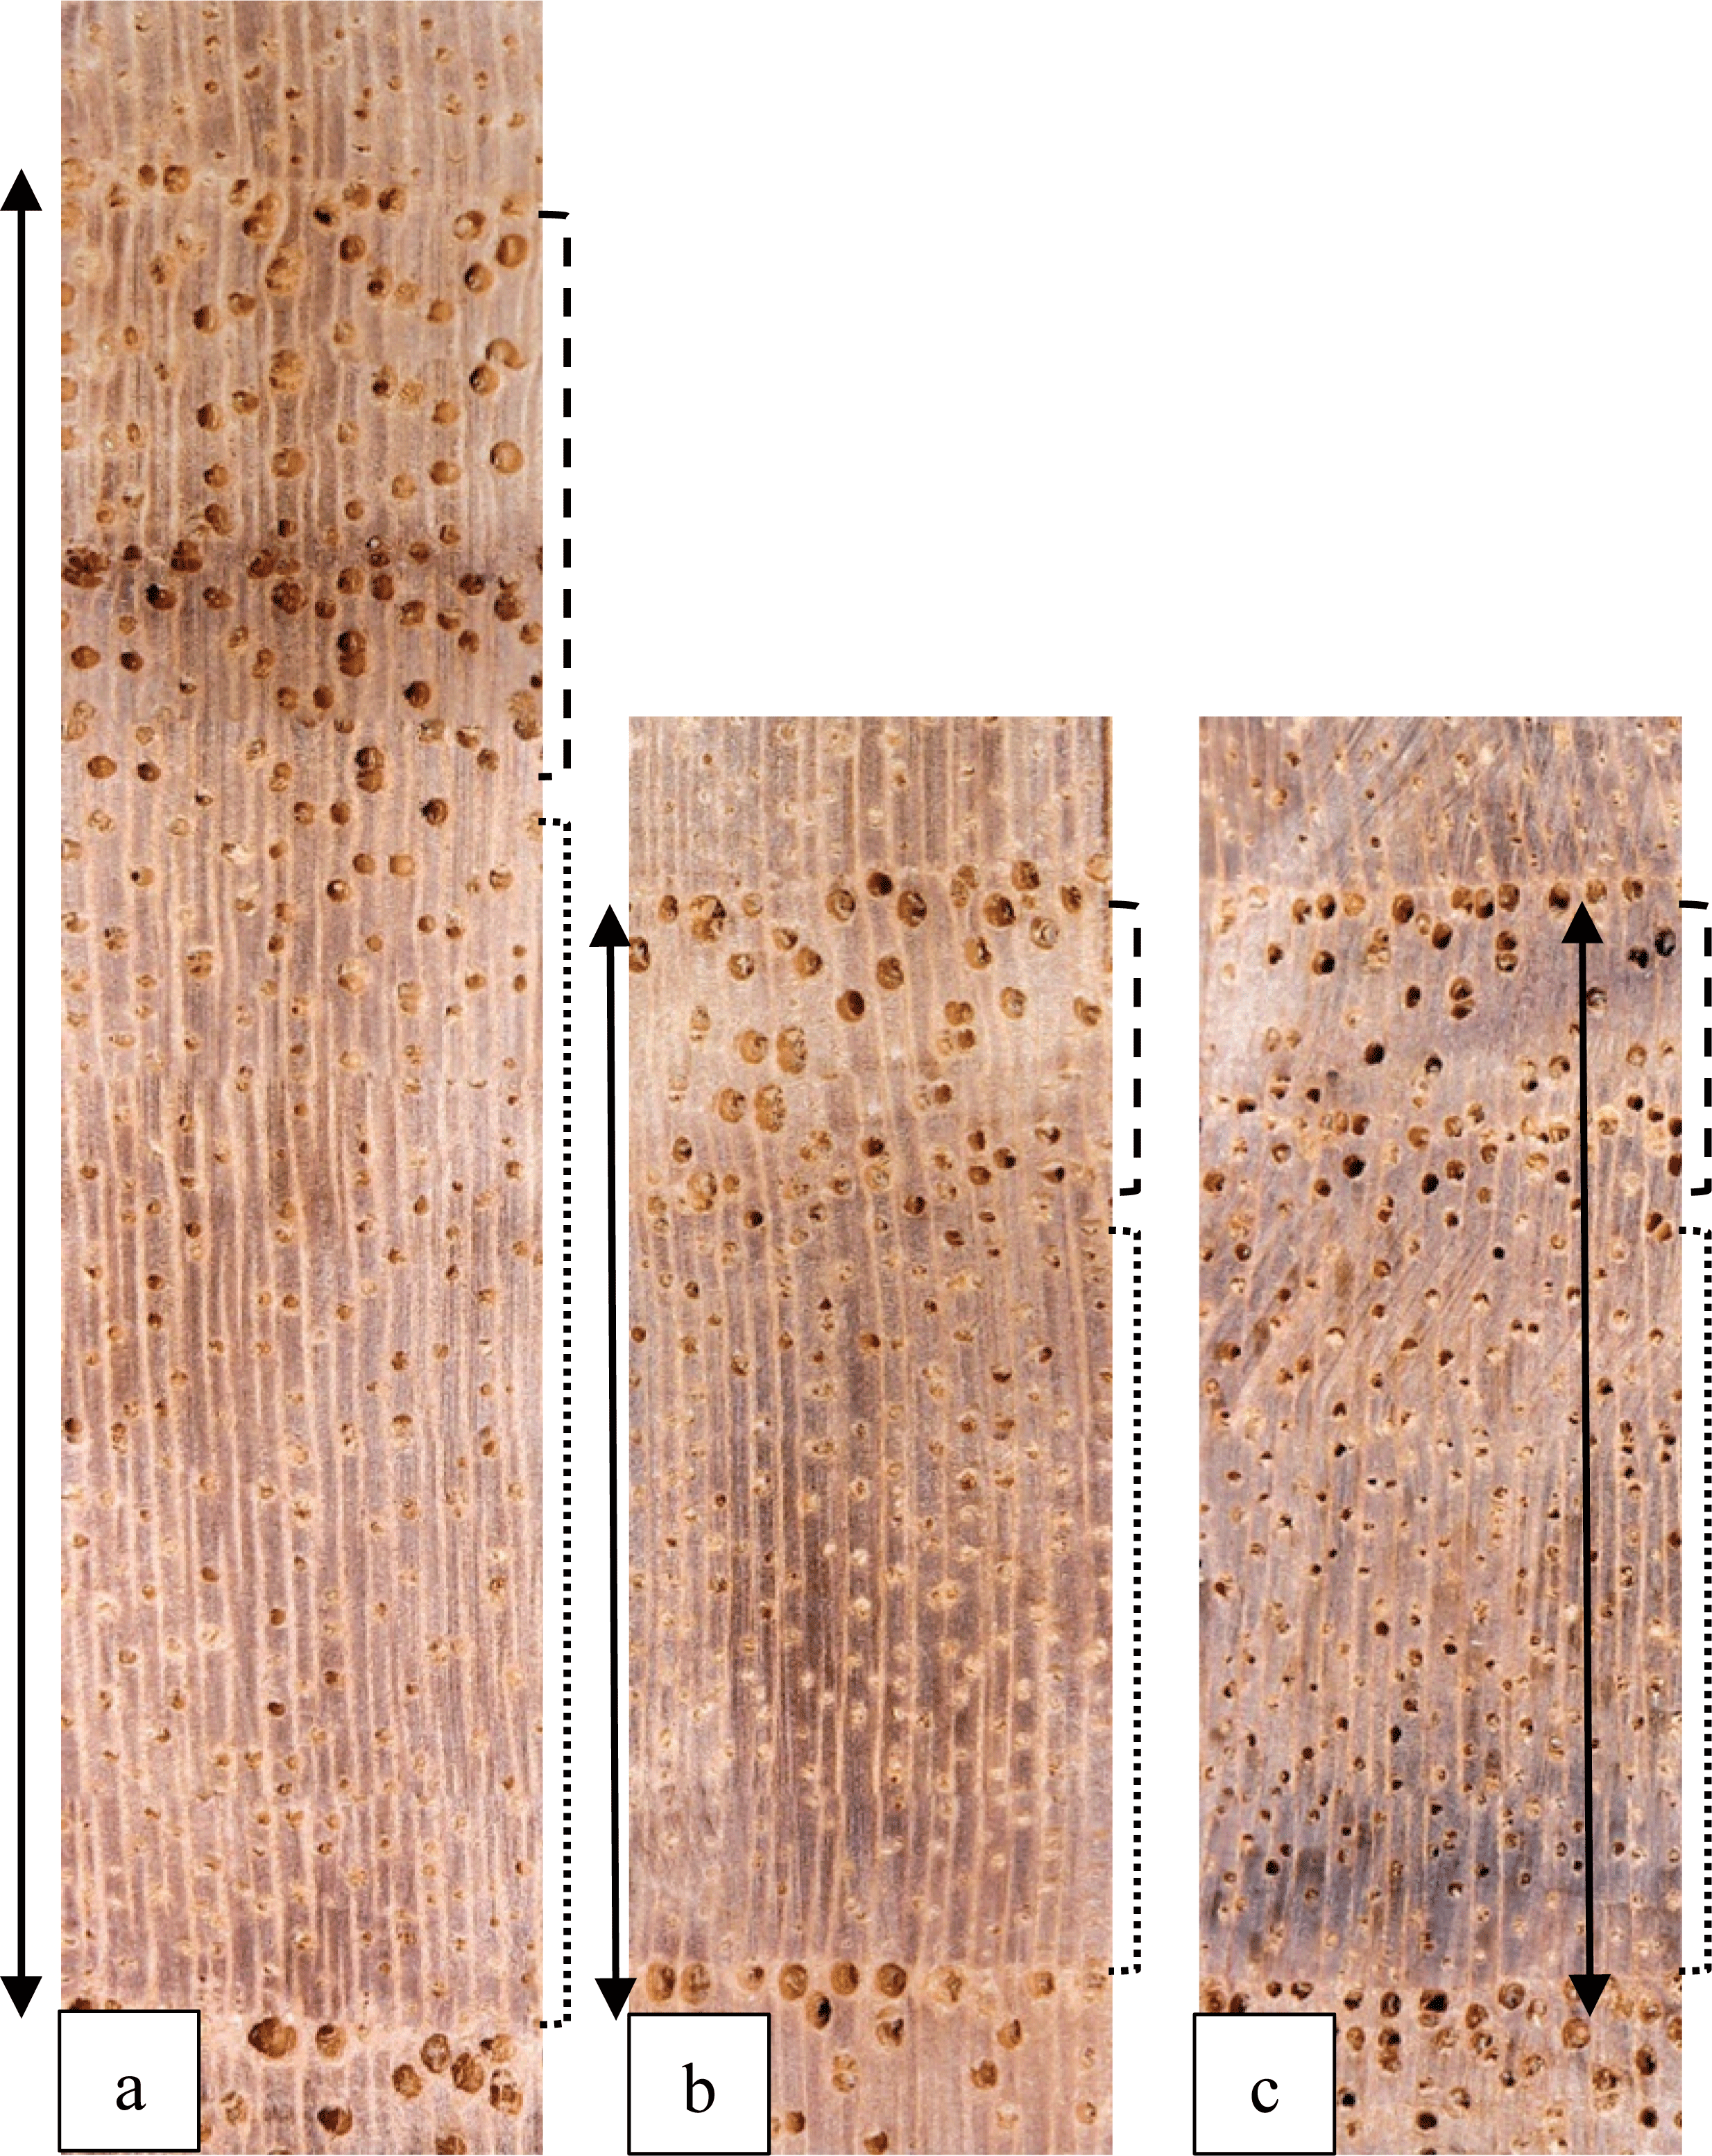
In general, macroscopic characteristics of this superior teakwood are similar to those of regular teakwood (Martawijaya et al., 2005; Ogata et al., 2008; Cardoso et al., 2015; Riantin, 2018), but different from fastergrown teakwood in the case of growth ring existence (Basri and Wahyudi, 2013; Wahyudi et al., 2014; Hidayati et al., 2017). The differences among treeswere found in cases of the width of growth ring and the width of early and latewood (Fig. 3). It can be seen that the growth ring and early-latewood portion of the 1st tree was the widest, while those of the remaining trees were similar.
The result shows that heartwood portion of this wood is high, i.e. 69.64‒75.59%. The value is similar to that of Kokutse et al., (2004) for the 70-year-old Togo teakwood (72%) and Riantin (2018) for the 13- year-old faster-grown solomon-clone teakwood planted in Bogor (74.10%). However, it was higher than that of Wahyudi and Arifien (2005) for the 8‒12-yearold conventional teakwood from Kendal (58.23%), and also Wahyudi et al. (2014) for the 4- and 5-yearold faster-grown teakwood planted in Bogor (18% in average). The higher heartwood portion indicates more durable wood. The more durable the wood, the longer its service life. These phenomena are natural because heartwood portion was dependent on species and tree age. According to Moya et al. (2014), heartwood of planted teak in general was produced when the tree was 4‒6-year-old or when its stem diameter was 6–10 cm. However, in case of teak planted in Cepu, East Java Province, Indonesia, its heartwood was produced when the tree was 12‒15-year-old (Wahyudi, 2000).
Their microscopic characteristics are as follows: wood ring-porous, vessels predominantly solitary but some in short radial multiples of 2–3, 4–9 cells/mm2 (Fig. 4a, 5a, and 6a), tangential diameter 75.06–228 μm, rounded to oval, simple perforations plate, and alternated inter vessel pitting. Ray parenchyma multiseriate (2‒5), homocellular (Fig. 4b, 5b, and 6b), 7‒13 cells/mm, height in average 493.79‒1044 μm (Fig. 4c, 5c, and 6c), and has brown deposits. Axial parenchyma concentric bands at the boundary of growth rings. Wood contains tyloses and yellow-white deposits.


In general, microscopic characteristics of this superior teakwood are also similar to those of teakwood in general, except for its porosity (Martawijaya et al., 2005; Ogata et al., 2008; Basri and Wahyudi, 2013; Wahyudi et al., 2014; Cardoso et al., 2015; Hidayati et al., 2017; Riantin, 2018). In term of porosity, our results slightly different from Wahyudi et al. (2014) and Cardoso et al. (2015). The 4- and 5-year-old superior teakwood planted in Bogor (Wahyudi et al., 2014) and the 70-year-old teakwood grown in East Timor (Cardoso et al., 2015) are semi ring porous wood.
Results showed that fibers of this superior teakwood are exclusively septate, with an average length 1.06 (0.79‒1.54) mm, diameter 22.56 (10.25‒36.89) μm, and cell wall thickness 4.13 (1.68‒7.89) μm. These findings are lower than those of 18 and 28- year-old conventional Muna teakwood (Rulliaty and Lempang, 2004). They stated that conventional Muna teakwood has a fiber length of 1.30 mm, fiber diameter 29.23 μm, and a fiber wall thickness of 8.96 μm. Results of this study were also lower than old teakwood (Martawijaya et al., 2005; Ogata et al., 2008; Cardoso et al., 2015), but were greater than the 5, 7 and 9-year-old superior Perhutani’s teakwood (Basri and Wahyudi, 2013) and the 4-and 5-year-old faster- grown teakwood (Wahyudi et al., 2014). Moreover, fibers of this Muna superior teakwood are longer than those of the 13-year-old solomon-clone teakwood planted in Bogor (Riantin, 2018).
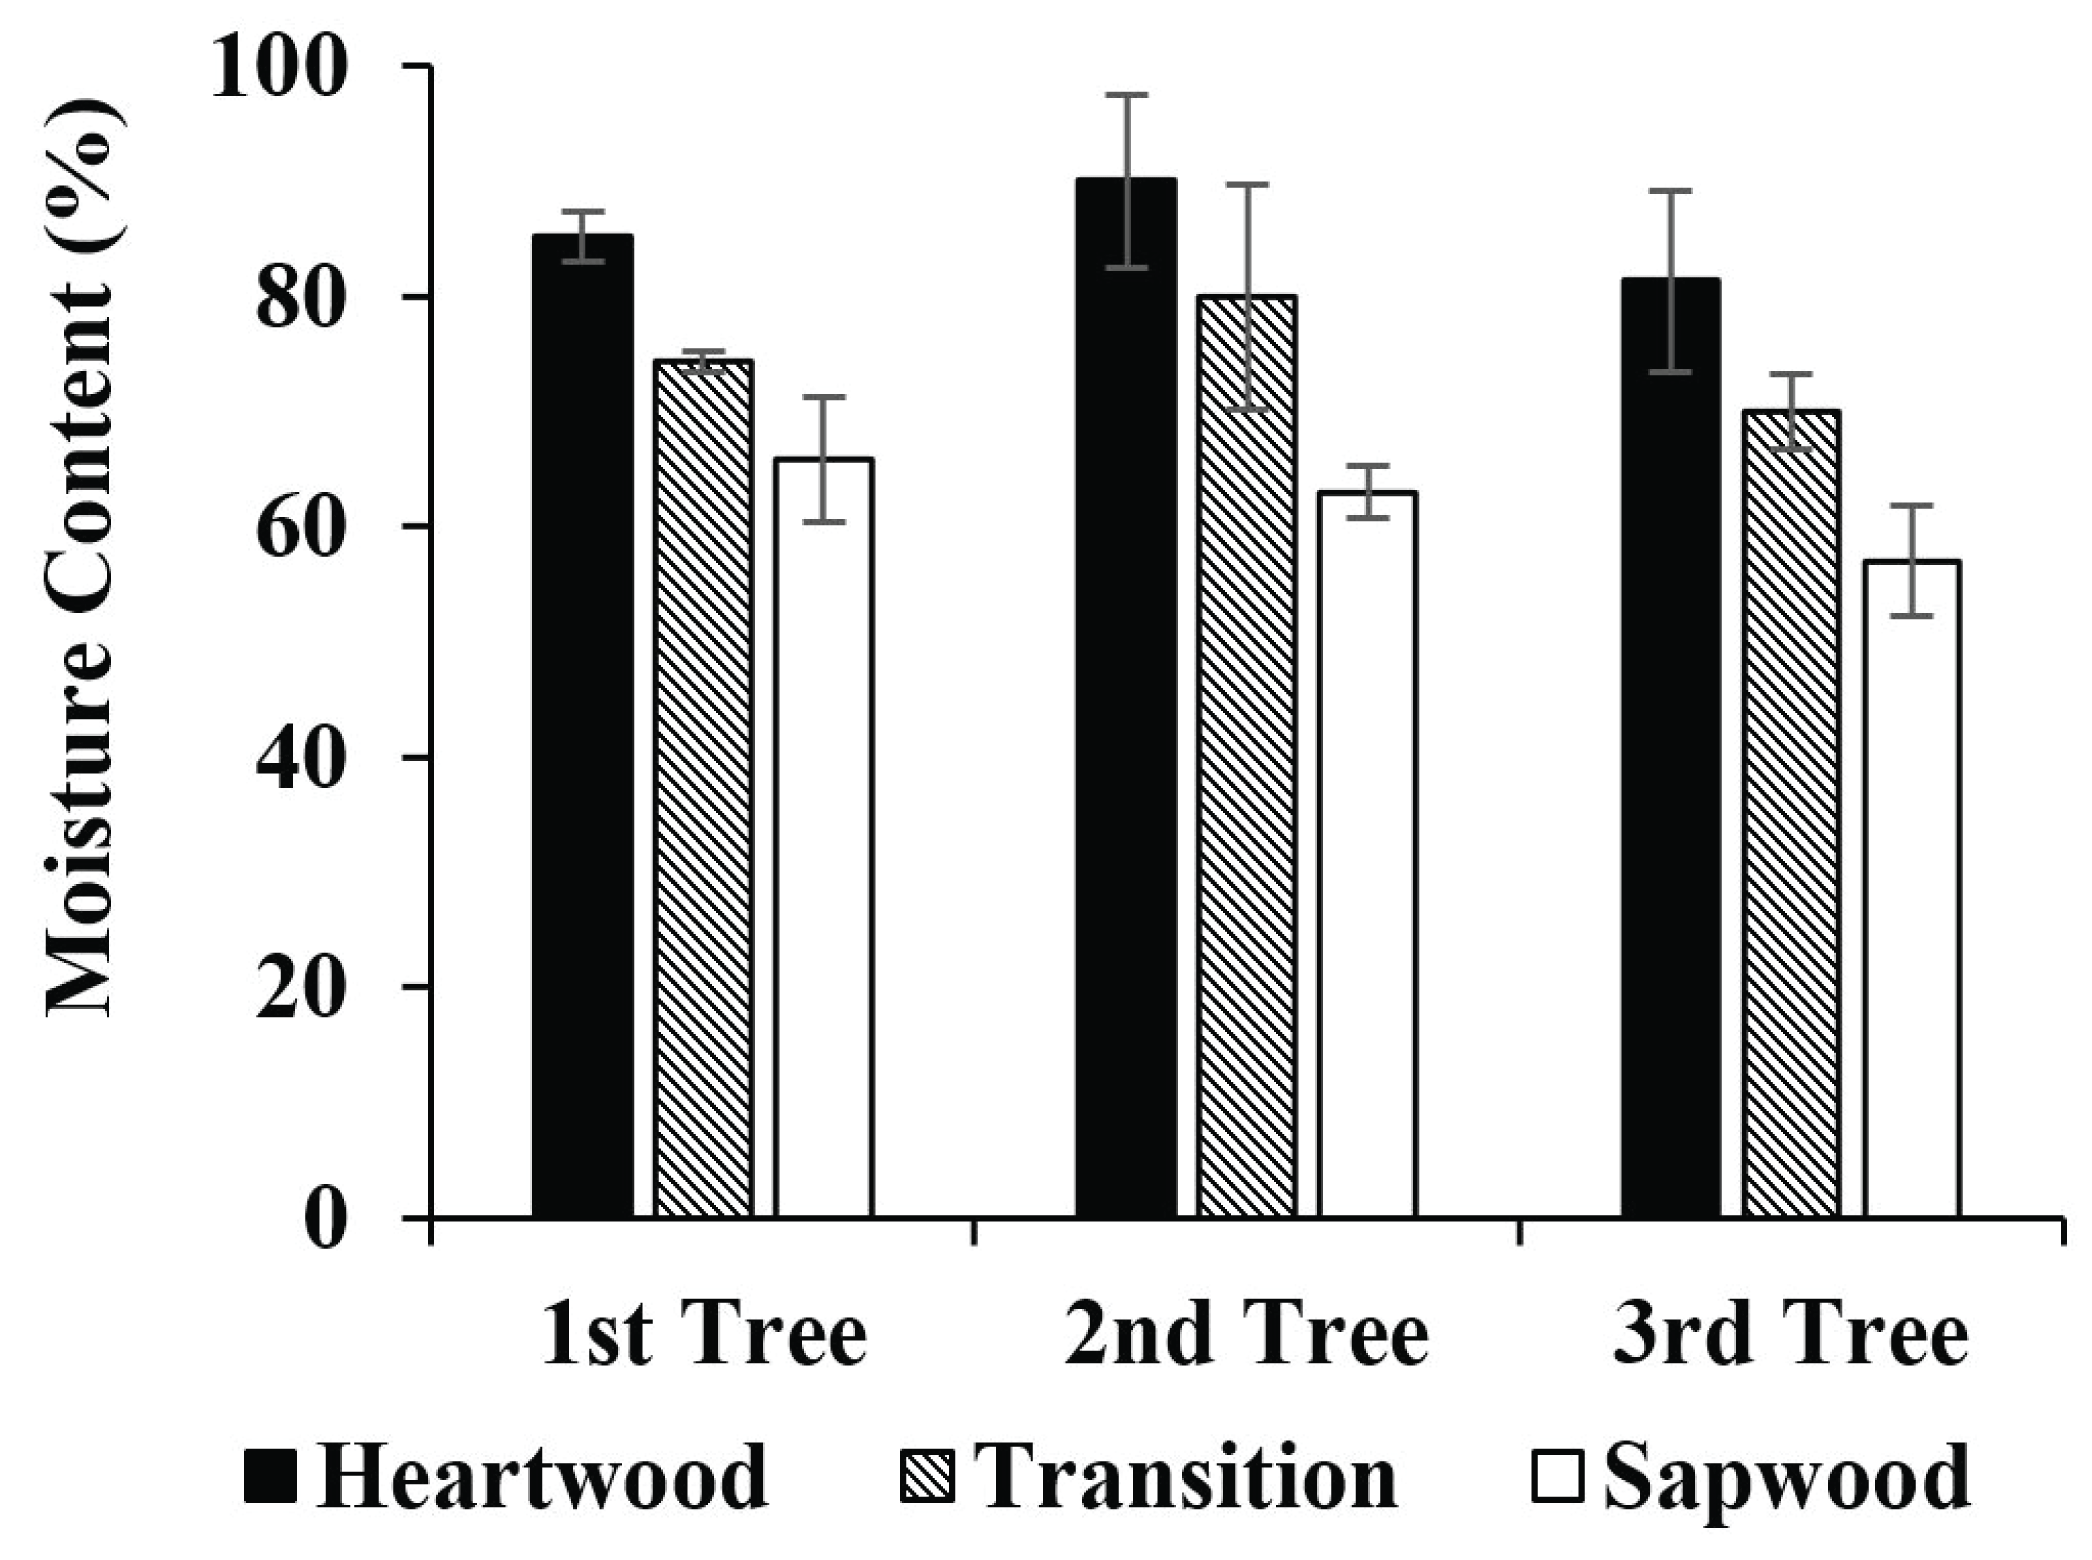
The result shows that green MC of wood varied among trees and among sample locations within the stem (Fig. 7). The averages green MC of the 1st, 2nd, and 3rd tree were 75.08, 77.63 and 69.44%, respectively; while average value of green MC on heartwood, transition, and sapwood zone were 85.49, 74.72, and 61.94%, respectively. These findings were coincided to Shmulsky and Jones (2011), but lower than those of others (Basri and Wahyudi, 2013; Wahyudi et al., 2014; Riantin, 2018).
 = Heartwood,
  = Transition, and
  = Sapwood.
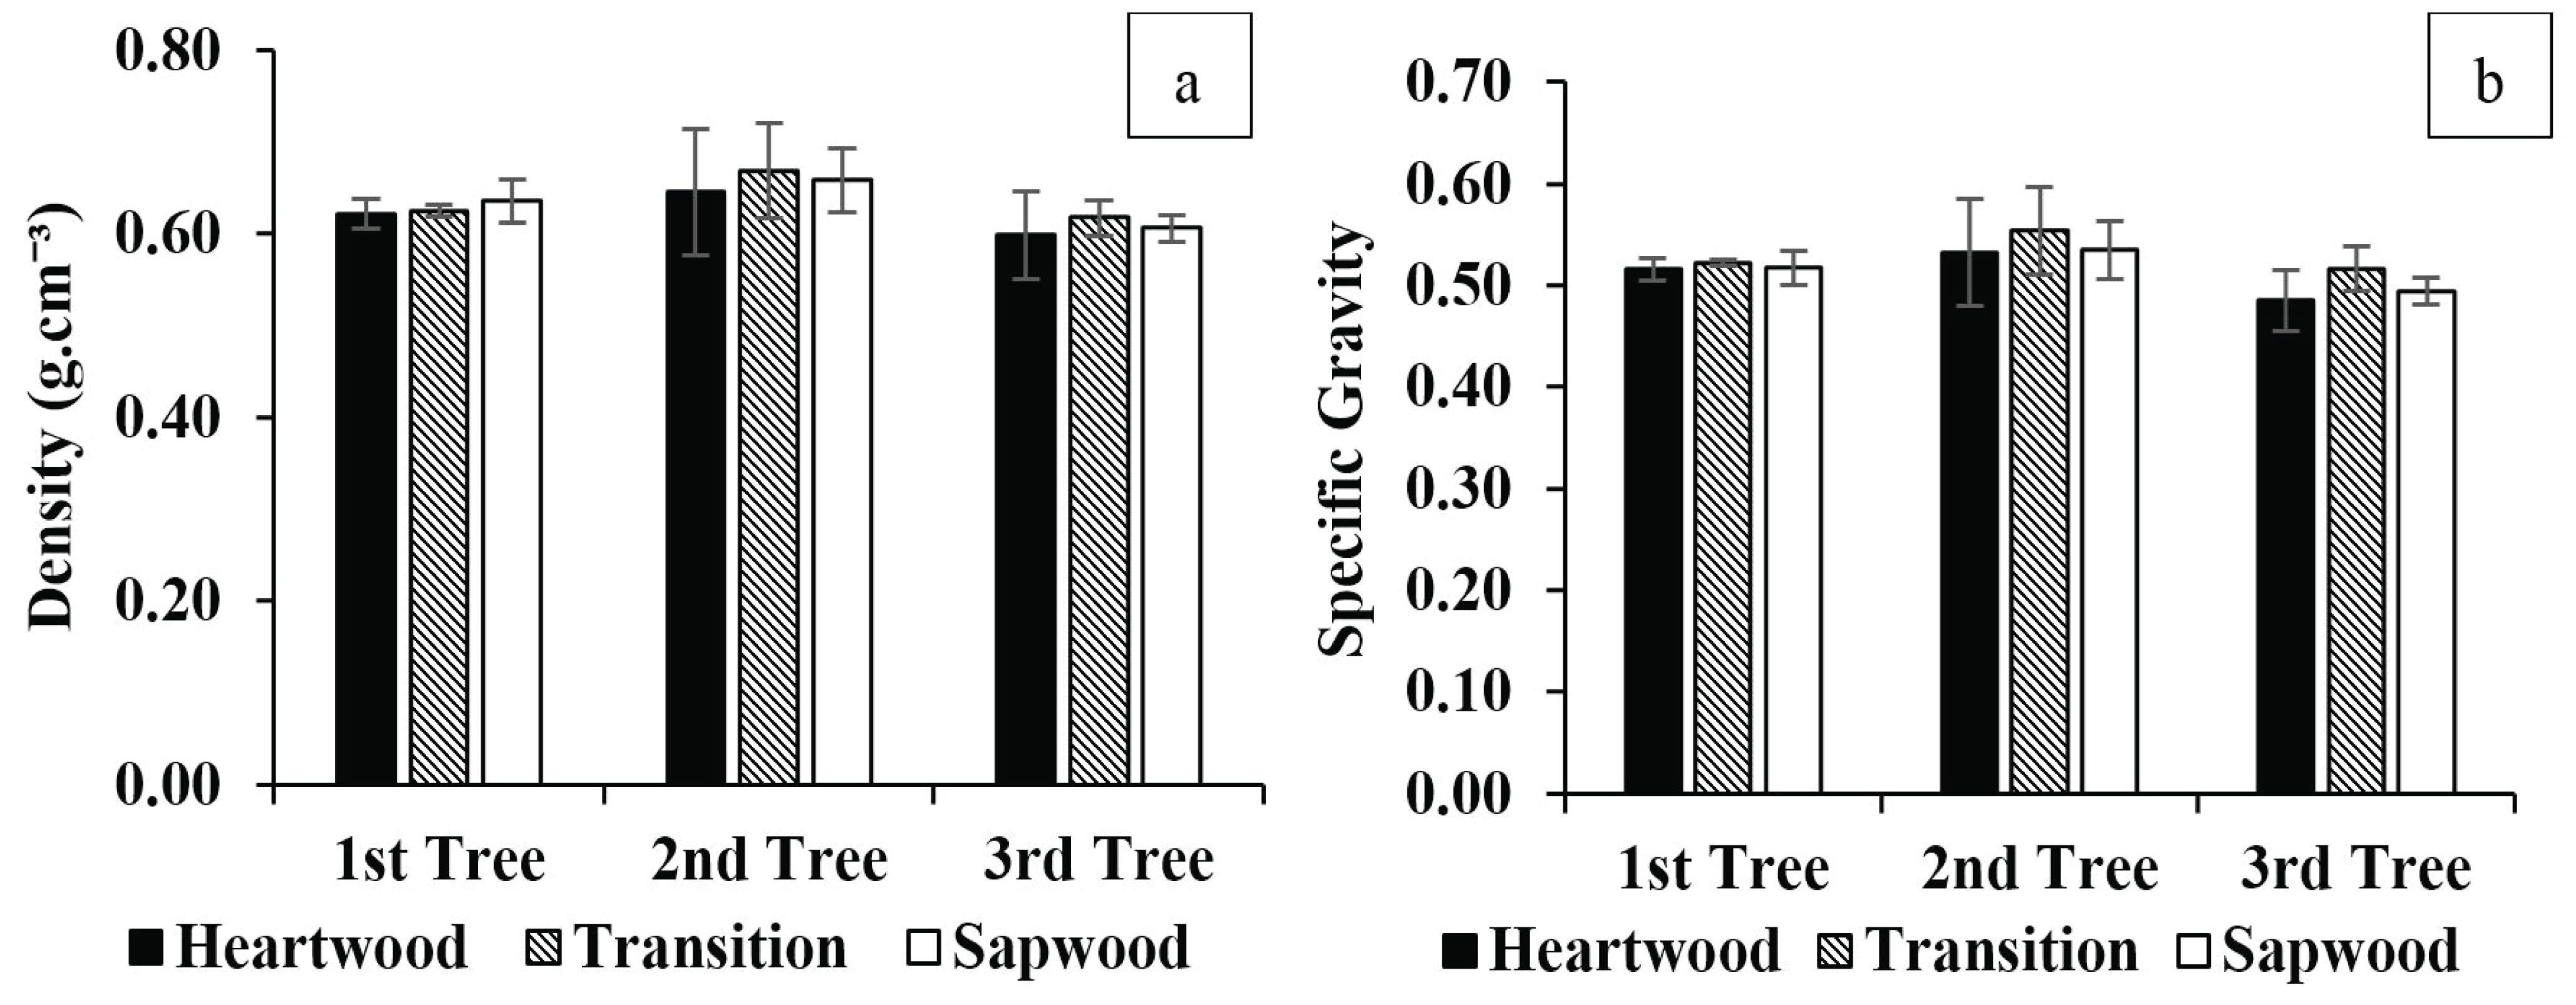
The results show that wood density and specific gravity also varied among the trees, but not among sample location within the stem (Fig. 8). The average value of wood density in each tree was 0.63 g/cm3 (in 15.74% MC), 0.66 g/cm3 (in 15.31% MC), and 0.61 g/cm3 (in 15.48% MC), respectively; while the average value for all trees was 0.63 g/cm3. Our results are lower than Wahyudi et al. (2014) and Riantin (2018), but higher than Basri and Wahyudi (2013), Darmawan et al. (2015), and Hidayati et al. (2017). Density of 10-year-old community teakwood from Java Island, Indonesia was 0.49 g/cm3 (Darmawan et al., 2015), while density of 5-year-old clone teak from Indonesia was 0.55 g/cm3 (Hidayati et al., 2017). These phenomena were influenced by differences in location where the trees grow.
 = Heartwood,
  = Transition, and
  = Sapwood.
In the case of SG, it shows that average SG of the 1st, 2nd, and 3rd tree was 0.52, 0.54, and 0.50, respectively; while the average value for all trees was 0.52. These findings are larger than those of Wahyudi et al. (2014) and Hidayati et al. (2017), similar to that of Riantin (2018), but lower than those of Rulliaty and Lempang (2004); and Martawijaya et al. (2005). Based on the classification of the Department of Public Works of the Republic of Indonesia (1961), this superior Muna teakwood is categorized as the Strength Class of III.
The results show that dimensional and volumetric shrinkages from green to air-dried condition (AD) as well as from green to oven-dried condition (OD) varied among the trees and among sample locations within the stem (Table 1). In all trees and all locations, tangential shrinkage (TS) is the largest, except for the heartwood of the 2nd tree (in cases from green to AD and green to OD condition), transition of the 2nd tree and heartwood of the 3rd tree (in case from green to AD condition). From green to AD condition, longitudinal shrinkage (LS) ranged 0.34‒0.63%, radial shrinkage (RS) 1.54‒3.40%, and tangential shrinkage (TS) 1.66‒3.52%. From green to OD condition, the LS, RS, and TS are 0.76‒1.06, 4.35‒5.97, and 5.08‒ 7.70%, respectively. The highest of TS is a common phenomenon in wood (Tsoumis, 1991).
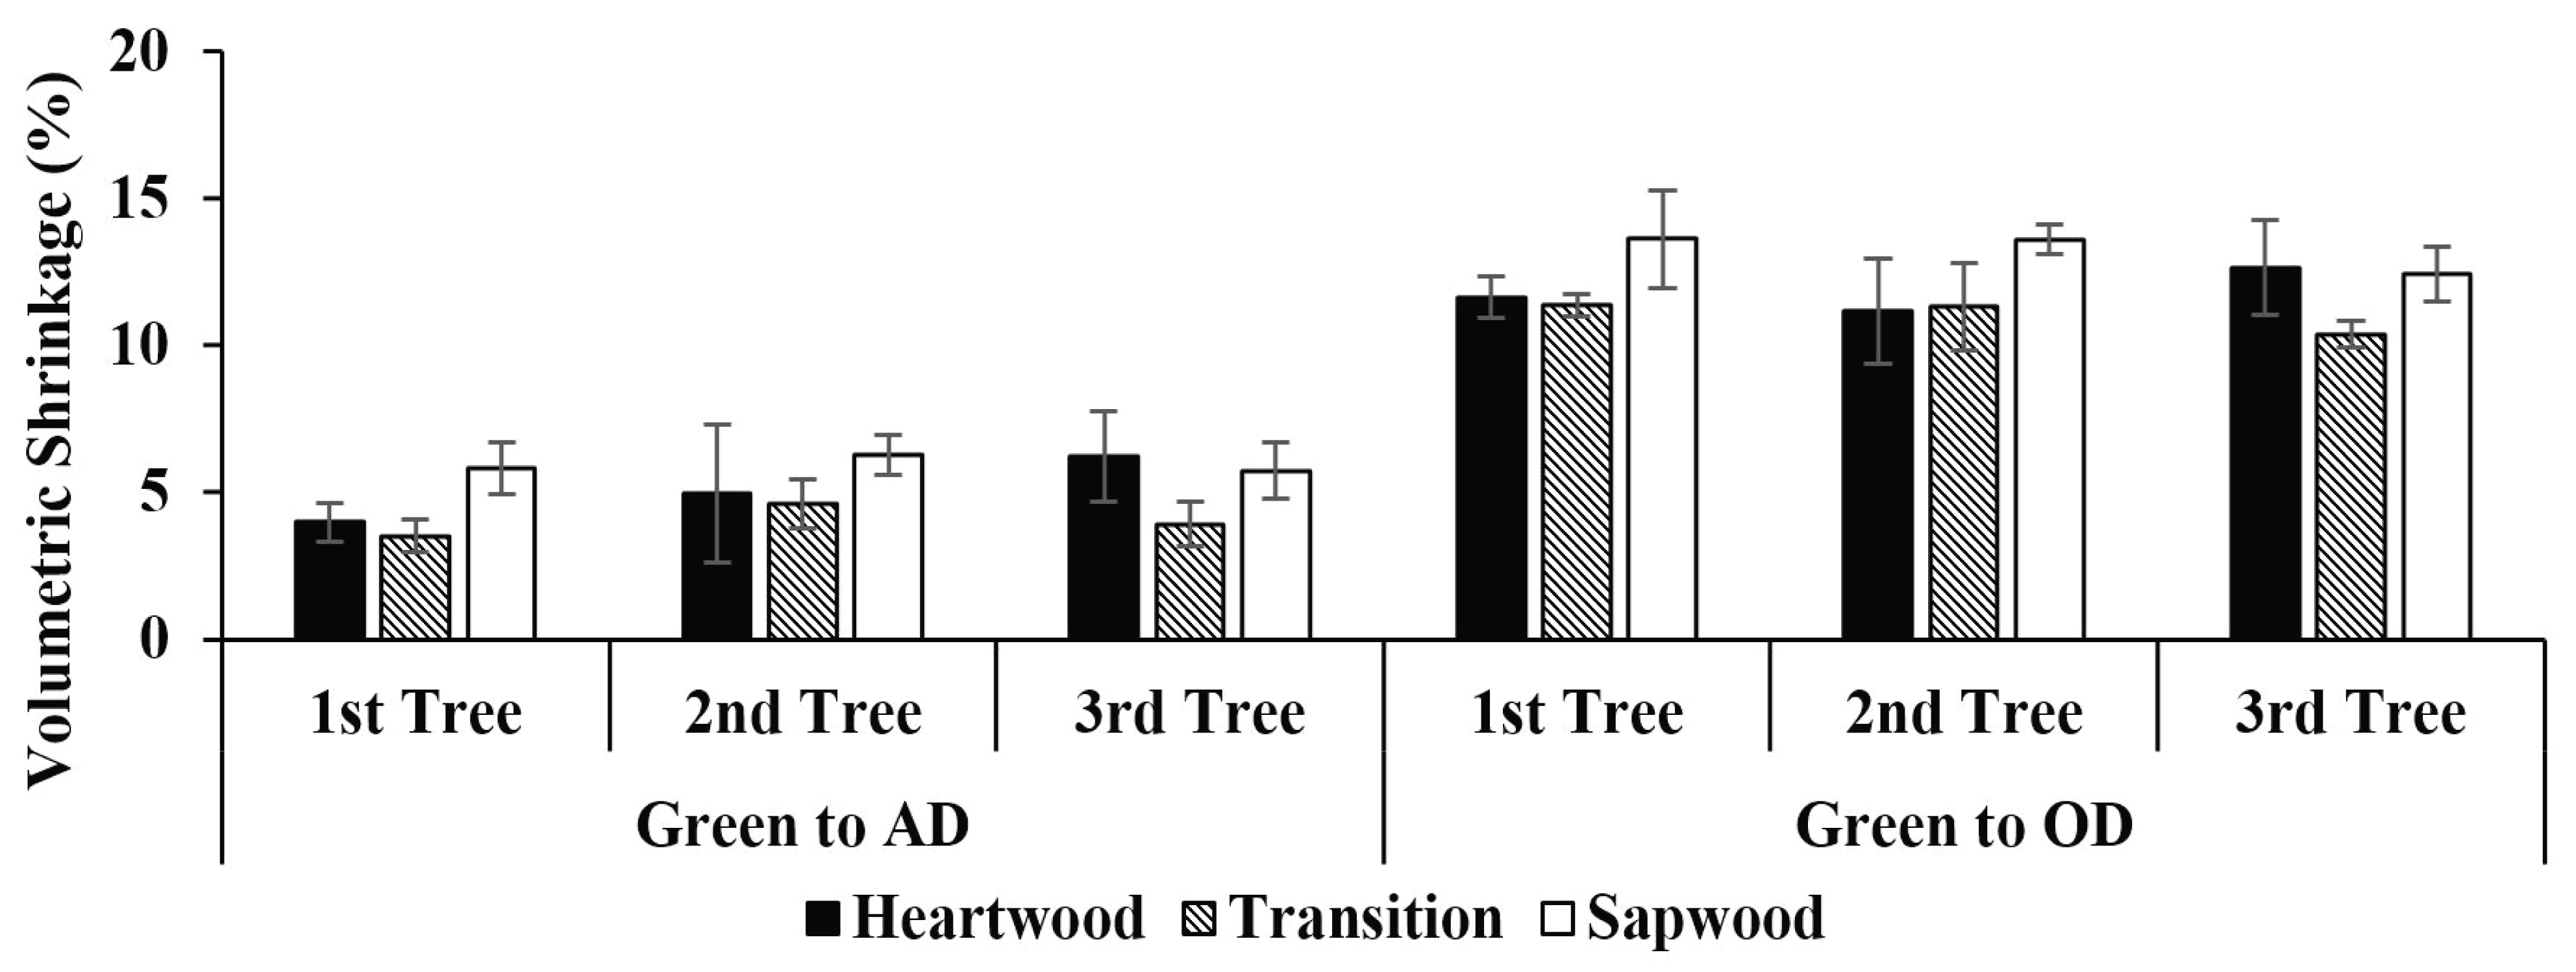
Volumetric shrinkage (VS) from green to AD and OD conditions are presented in Fig. 9. It can be seen that VS varied among sample locations within the stem. Volumetric shrinkage of sapwood is generally higher than others, while VS of transition zone is the lowest. From green to AD condition, average value of VS in sapwood is 5.93%, in transition 4.00%, and in heartwood is 5.05%, while from green to OD condition, the averages VS of sapwood, transition, and heartwood are 13.22, 11.01, and 11.81%, respectively. In general, average VS from green to AD condition is 5.00%, while from green to OD condition is 12.01%.
 = Heartwood,
  = Transition, and
  = Sapwood.
Compared to teakwood from community forest at Gunungkidul, Yogyakarta (Marsoem et al., 2014) and the old East Timor teakwood (Miranda et al., 2011), our results are greater. These differences were related to the number of extractive substances inside the wood sample (Coto, 2004).
The value of T/R-ratio from green to AD condition for all trees and all sample locations within the stem are presented in Fig. 10. It seems that T/R-ratio was more influenced by sample location within the stem. T/R-ratio in sapwood (1.70) is the highest, while in heartwood (0.91) is the lowest. The T/R-ratio of transition zone is 1.08. This indicates that heartwood is the most stable compared to sapwood and transition. With T/R-ratio of 0.91‒1.70, this superior Muna teakwood is relatively stable, which means minimal changes in shape when the wood is dried.
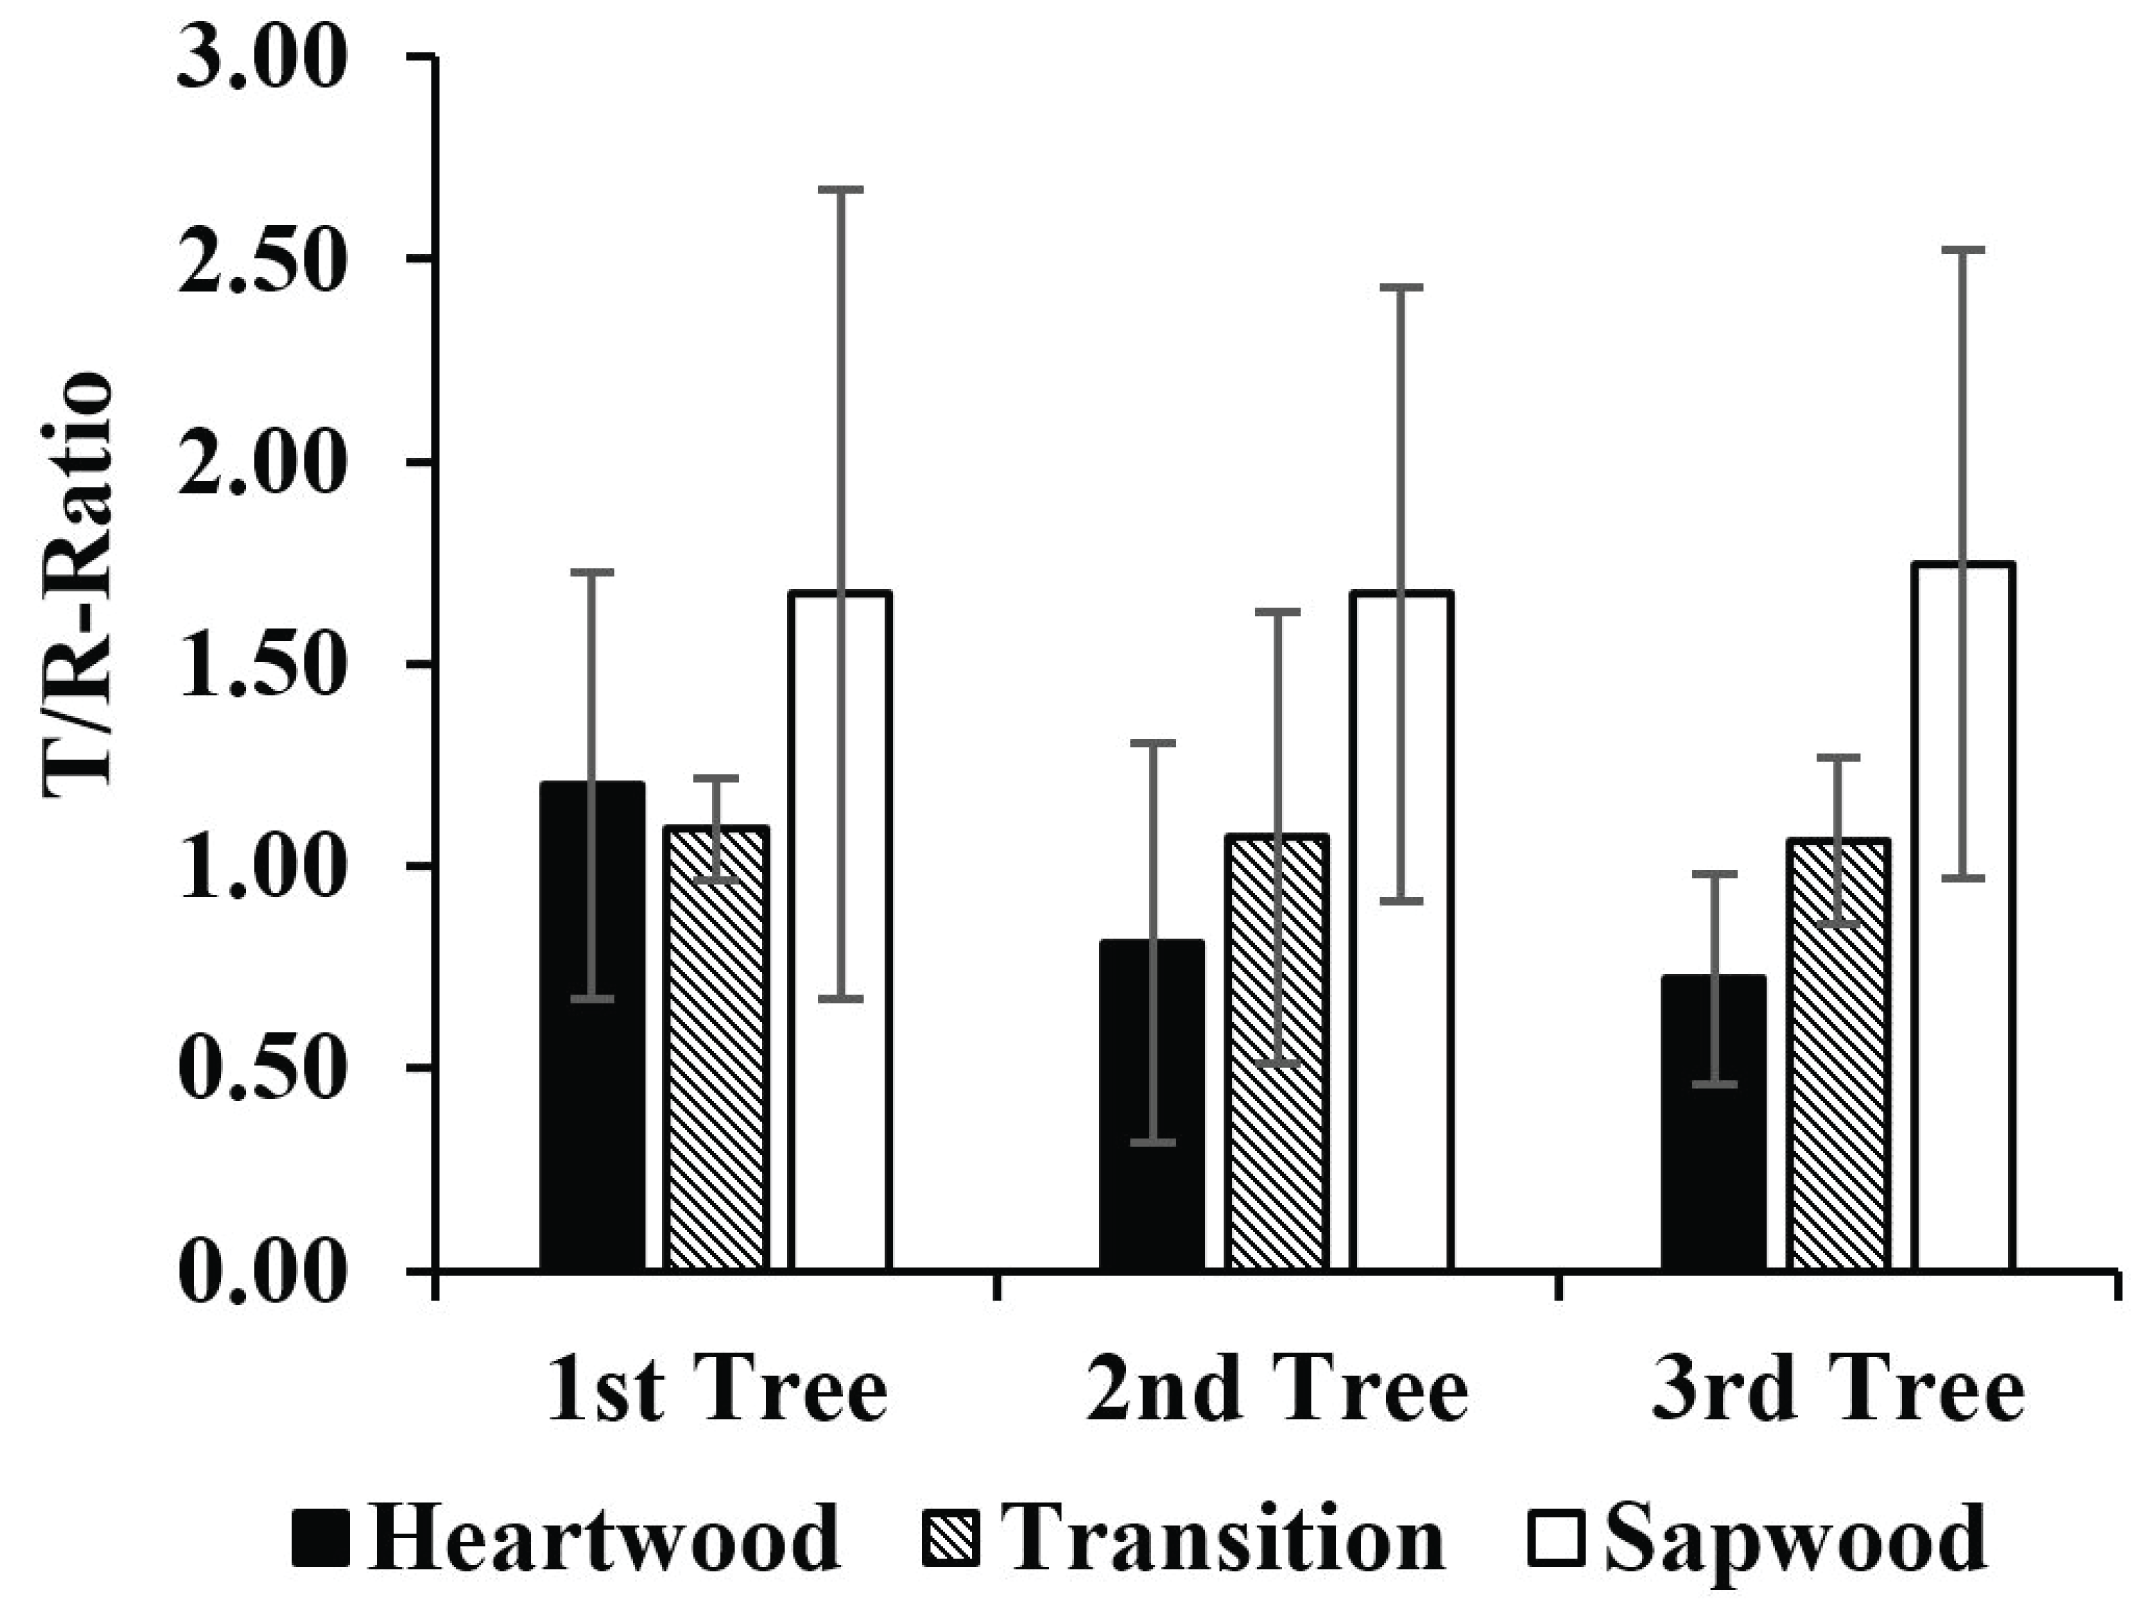
 = Heartwood,
  = Transition, and
  = Sapwood.
Compared to previous studies (Basri and Wahyudi, 2013; Marsoem et al., 2014; Wahyudi et al., 2014), T/R-ratio from this study is lower. T/R-ratios of the 5, 7, and 9-year-old superior Perhutani’s teakwood are 2.45‒2.97 (Basri and Wahyudi, 2013), Gunungkidul teakwood is 1.38‒2.13 (Marsoem et al., 2014), and the 4- and 5-year-old faster grown teakwood planted in Bogor are 2.67‒3.02 (Wahyudi et al., 2014). Compared to other species, our finding is lower than Moluccan ironwood, linggua, red meranti, and gofasa. Their values are 1.79, 1.72, 3.03, and 1.90 respectively (Hidayat et al., 2017).
Results showed that MOE and MOR are not varied among trees and among sample locations within the stem (Fig. 11). The MOE ranged 79439‒93017 kgf /cm2, while the MOR was 789‒862 kgf /cm2. Compared to Wahyudi and Arifien (2005) and Wahyudi et al. (2014), MOE and MOR of this wood were higher; but they are lower than those of Martawijaya et al. (2005), Miranda et al. (2011), and fast-growing juvenile wood (Bhat et al., 2001). These phenomena are related to the differences in tree age. Wahyudi and Arifien, (2005) and Wahyudi et al. (2014) used teakwood from younger stands (8‒12-year-old), while Martawijaya et al. (2005) and Miranda et al. (2011) used teakwood from old stands (≥ 50-year-old). Compared to another fast-growing species especially jabon (Anthocephalus spp.) wood treated by methyl methacrylate (Hadi et al., 2019), our result was higher.
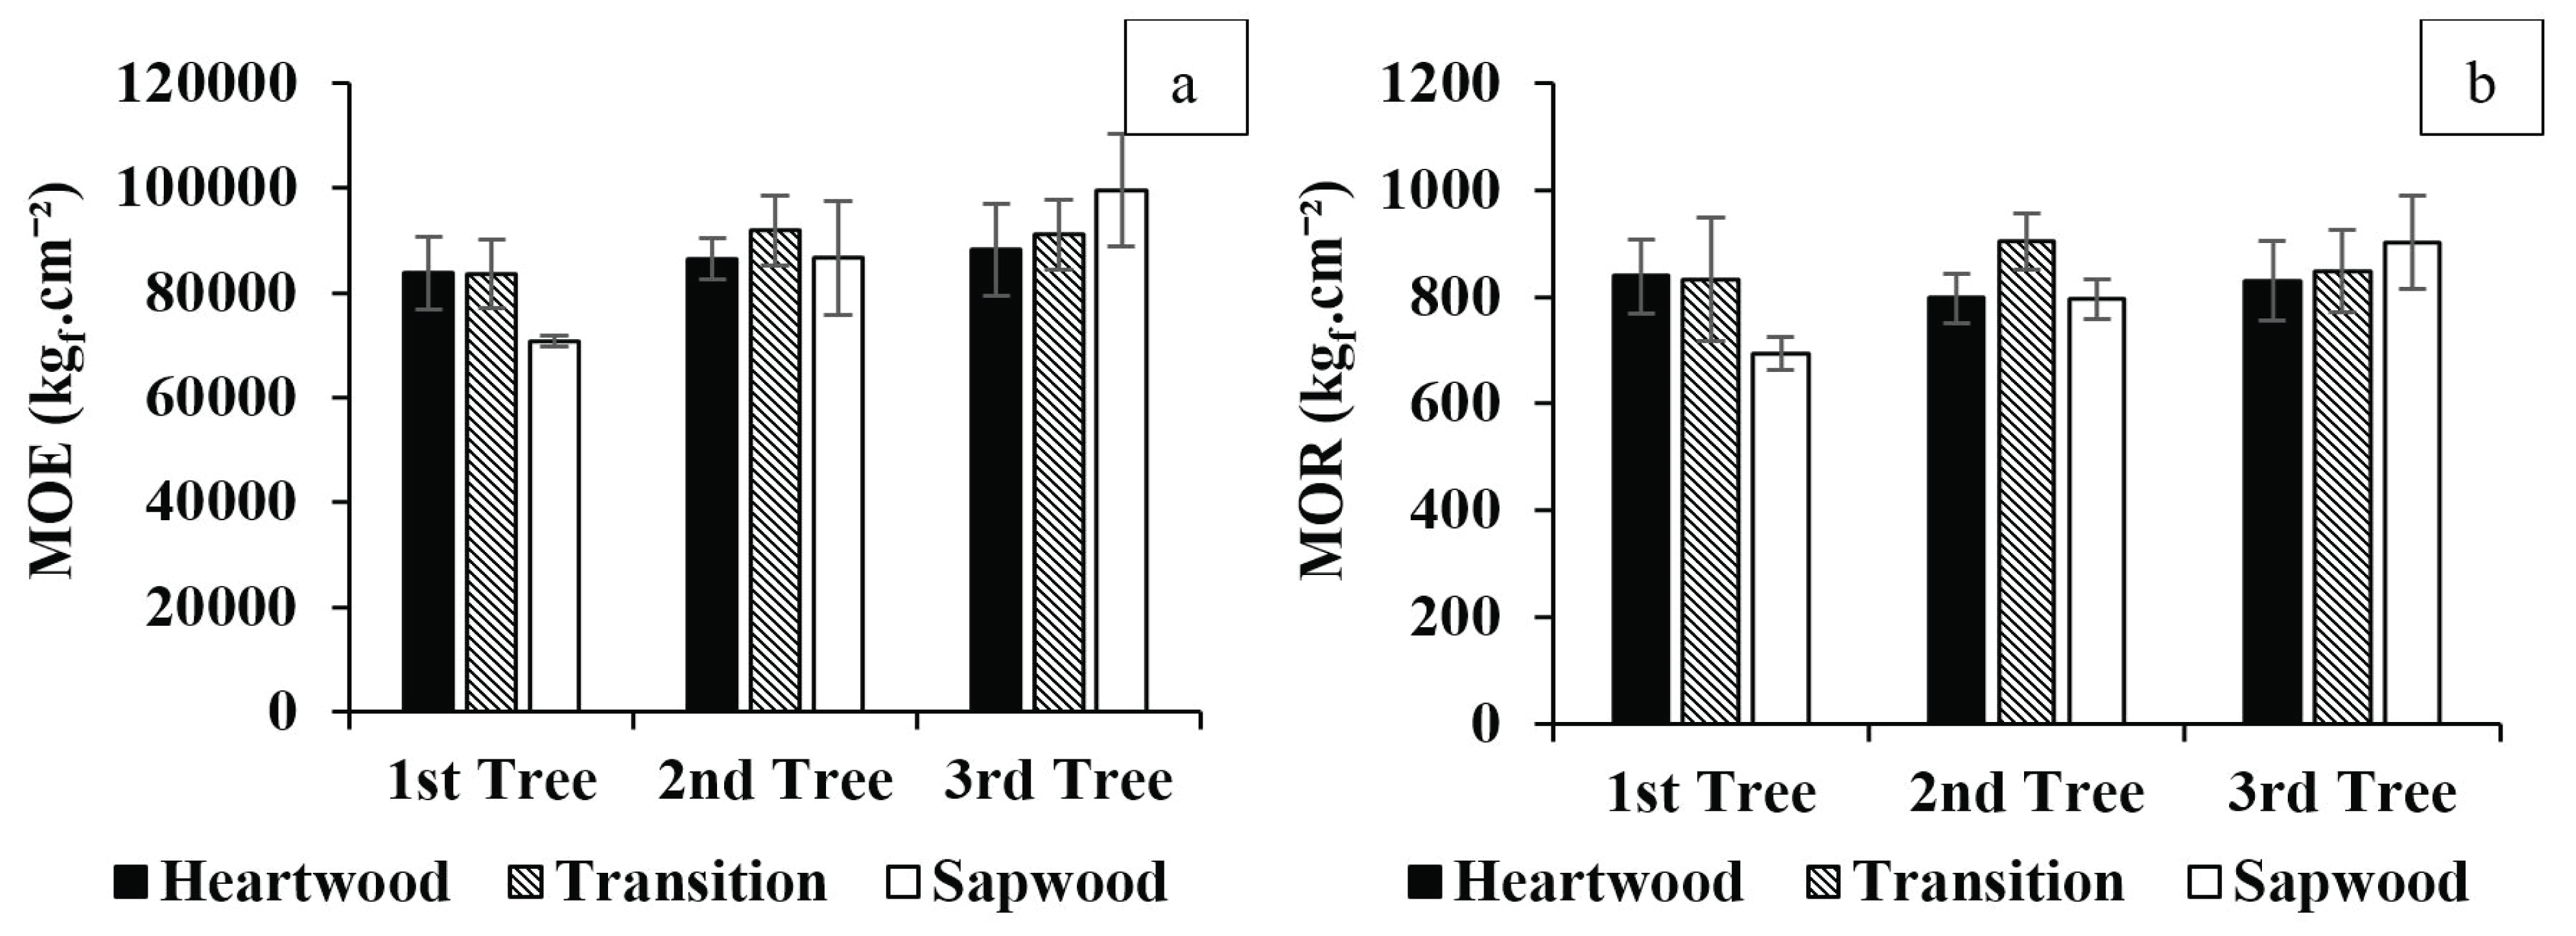
 = Heartwood,
  = Transition, and
  = Sapwood.
Results show that the σ// are not influenced by sample location within the stem nor among the trees (Fig. 12). The average value of σ// was 284 kgf /cm2. Compared to Martawijaya et al. (2005) and Miranda et al. (2011), our result was lower. This indicates that teakwood from old trees isbetter to hold compressive loads parallel to the grain.
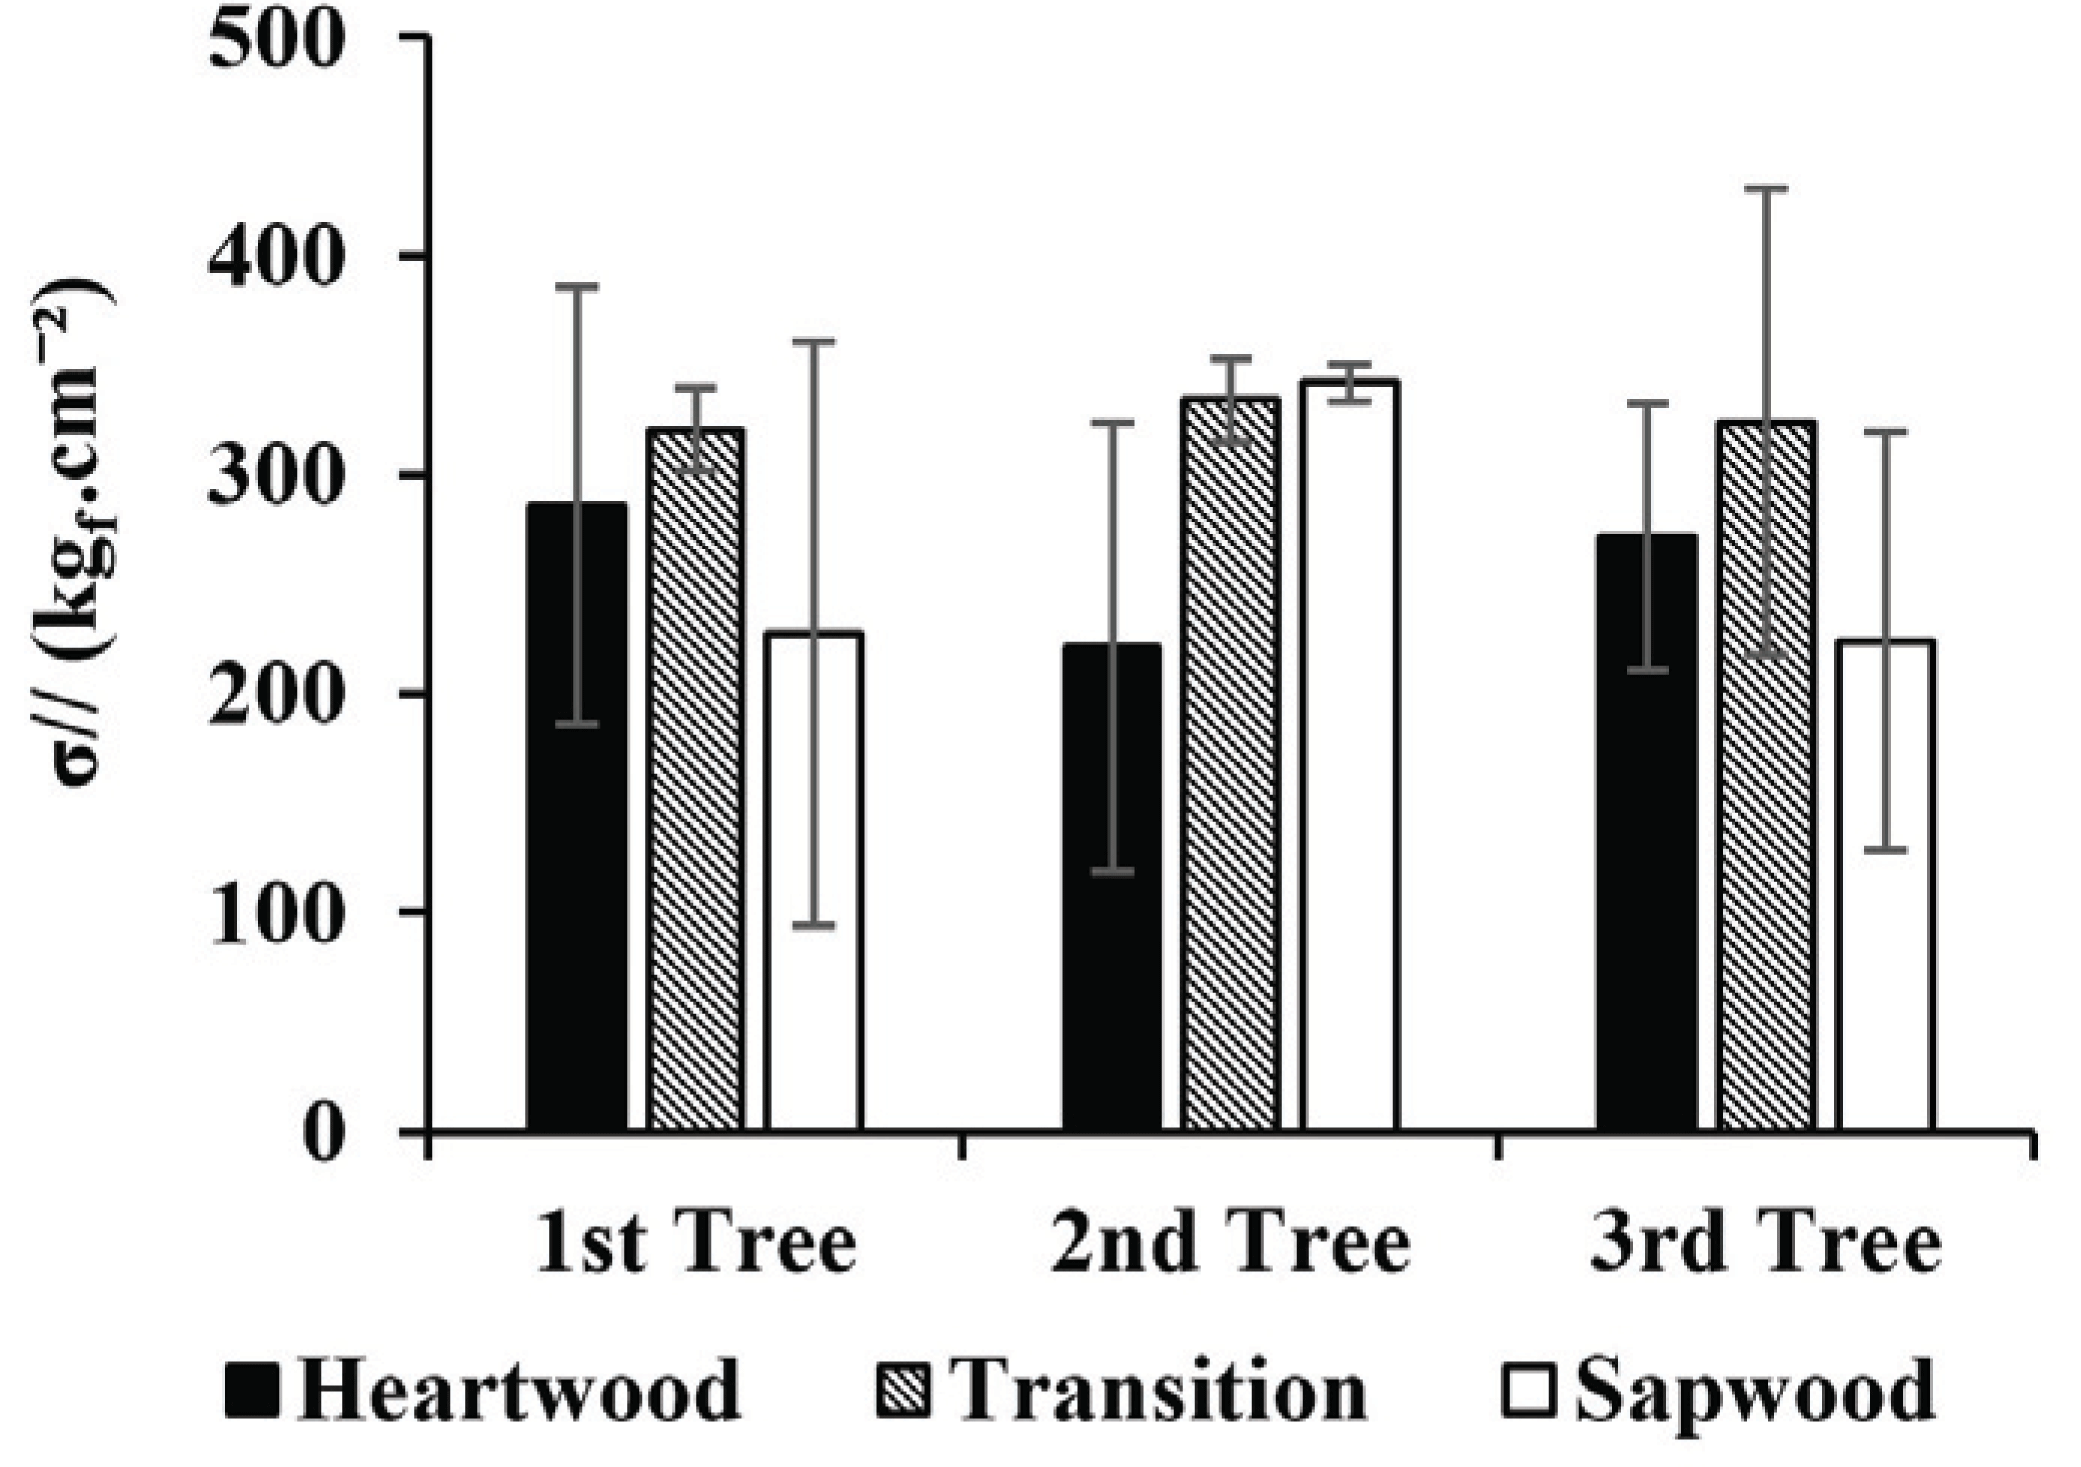
 = Heartwood,
  = Transition, and
  = Sapwood.
Similar to their σ//, the H of this teakwood was not influenced by the sample location within the stem nor among the trees (Fig. 13). The average value of H was 380 kgf /cm2. Compared to Martawijaya et al. (2005), our result is lower but higher than that of Wahyudi et al. (2014). This indicates that teakwood from old trees has better surface hardness.
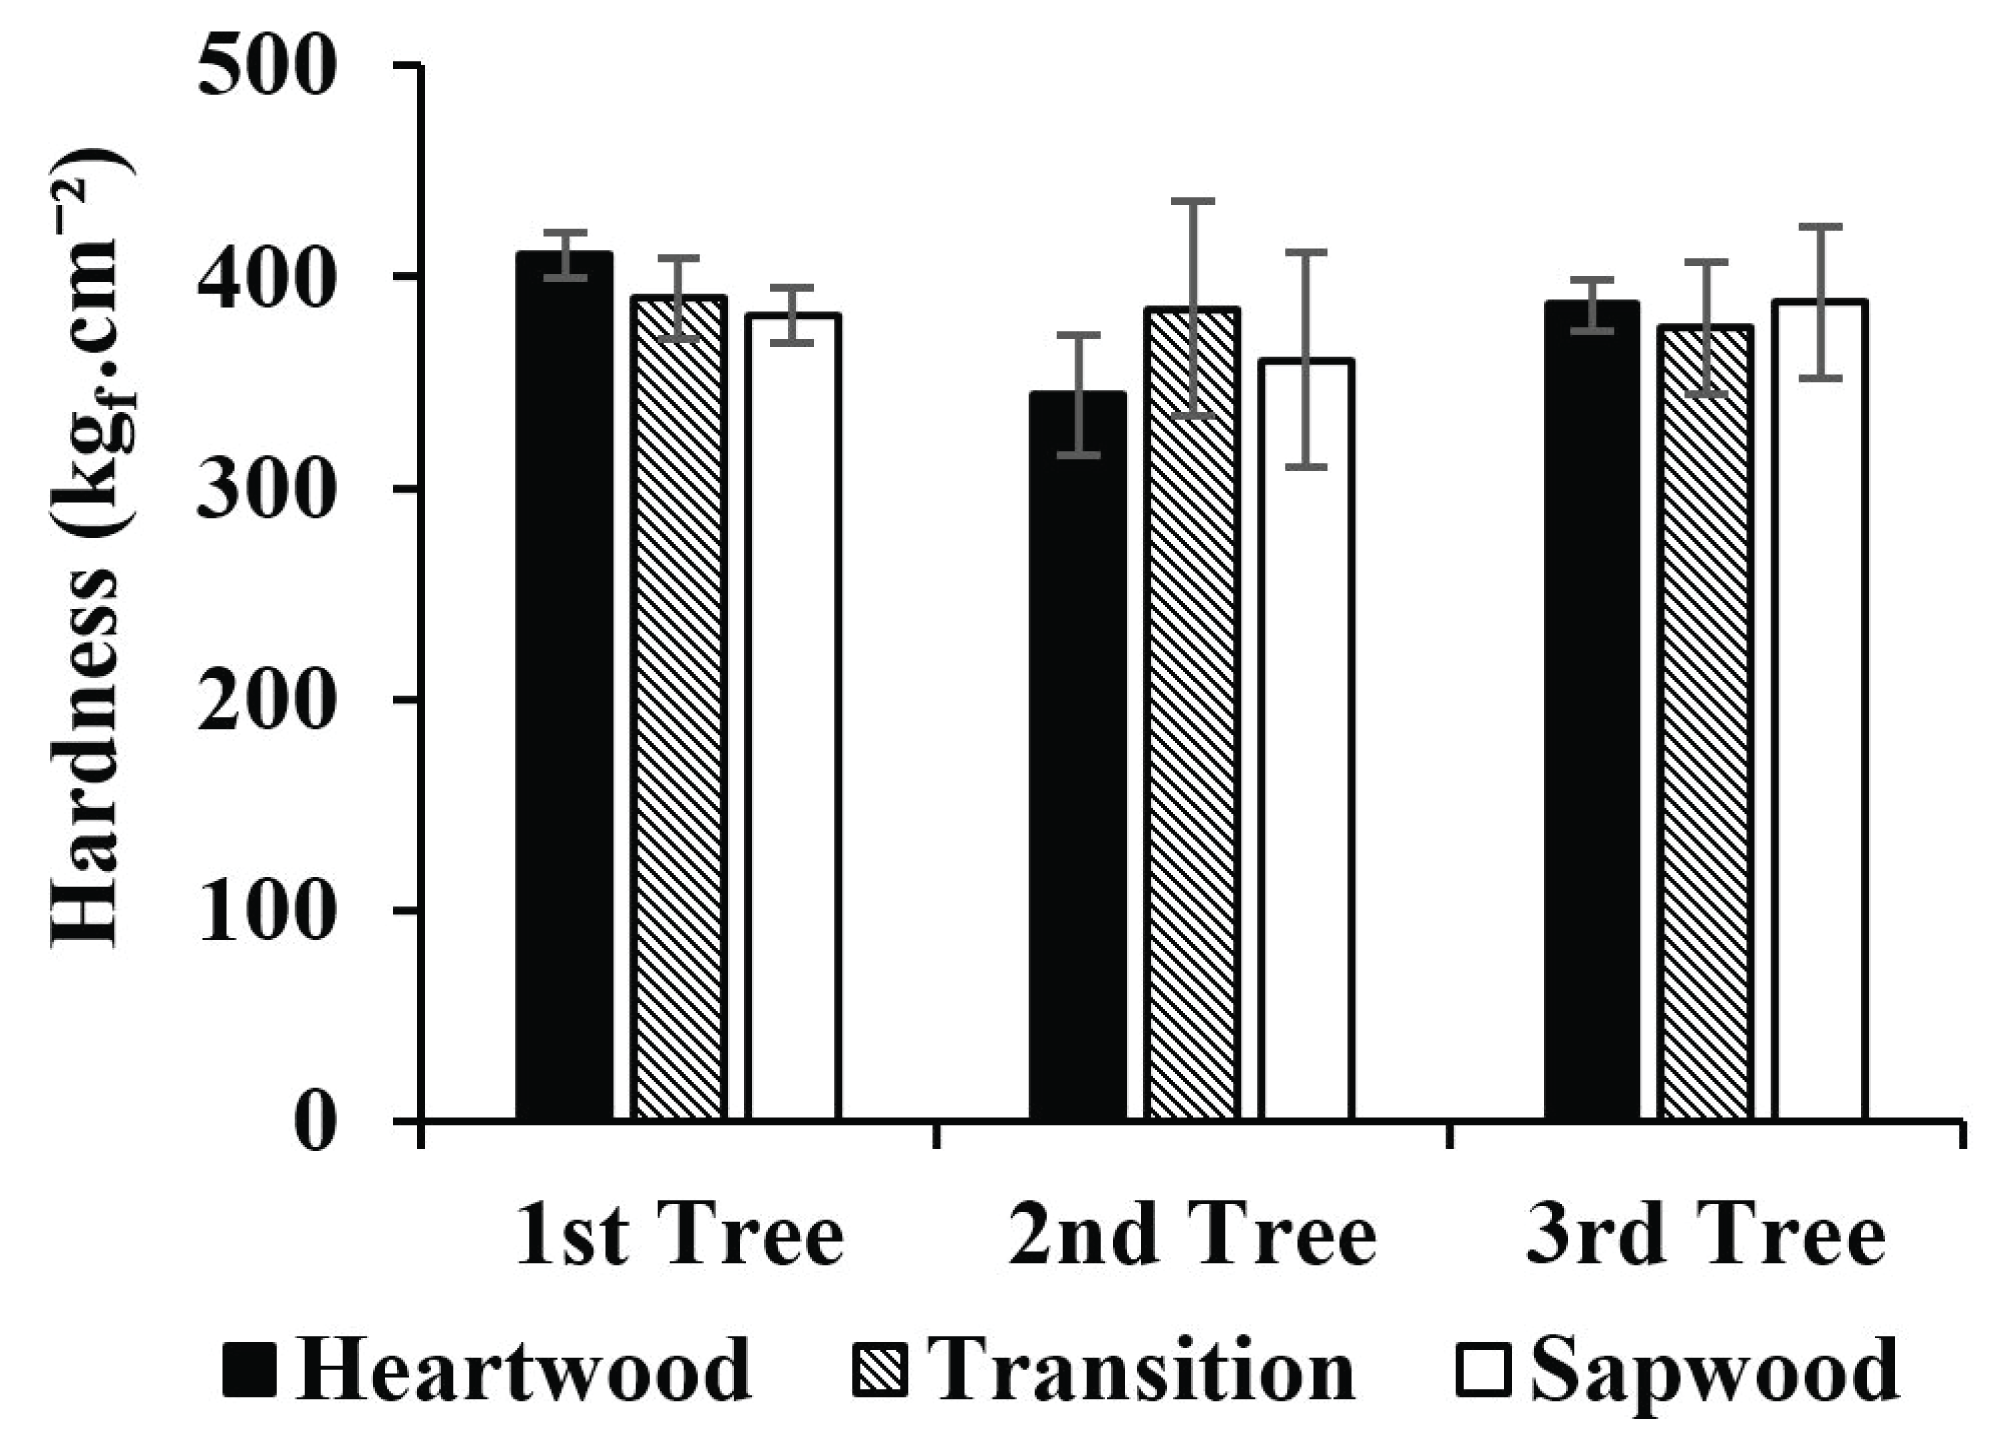
 = Heartwood,
  = Transition, and
  = Sapwood.
Teakwood, especially from old trees, is very popular as raw material for high-quality wooden furniture. Demand for wood and wood products is increasing from year to year. According to Tsoumis (1991), the suitability of wood for wooden furniture is highly correlated to its figure, dimensional stability, strengthens, natural durability, and machining properties. Based on all parameters studied, therefore, this superior Muna teakwood is suitable enough to be utilized as raw material even though it was produced by the 8-year-old tree. The wood has decorative figures, T/R-ratio is low (0.91‒1.70), stable, strong and belonged to Strength Class III, as well as durable enough. Moreover, wood texture is fine to rather coarse, and wood grain is straight to shallowly interlock. Therefore, it was ensure that quality of products produced will be satisfactory.
4. CONCLUSION
The anatomical characteristics of the 8-year-old superior Muna teakwood are relatively similar to those of regular teakwood, but its heartwood portion is higher (69.64‒75.59%). Averages fiber length and fiber wall thickness are 1.06 and 4.13 μm, respectively. Its wood moisture in green condition is lower than that of fast-growing teakwood in general. The wood is more stable compared to teakwood in general but its SG is lower than that of old teakwood (0.52 in average). Mechanical properties (MOE, MOR, σ//, and H) are higher than those of fast-growing teakwood, but lower than those of old teakwood. Based on its SG, this superior Muna teakwood was categorized as Strength Class III. Generally, the wood is suitable enough as raw material for wooden furniture manufacturing.
