1. INTRODUCTION
Antioxidant compounds in plants have attracted attention due to their potential value as food preservation agents or nutraceuticals (Kim et al., 2010; Kim et al., 2014). Rose species have been used for food and medicinal purposes in many countries. Rose leaves and flowers have been used mainly in cosmetics and perfumes. Rose fruits are used in many food products and drinks including teas, jellies, jams, and alcoholic beverages (Grochowski, 1990; Zhang et al., 2008). The rose fruits have a high antioxidant content and are enriched in vitamin C (ascorbic acid) (Czyzowska et al., 2015; Um et al., 2018). Vitamin C is essential for humans but is not synthesized in the body. It is acquired by ingestion. Although the rose fruit extracts in food have been confirmed to act as health supplements, the research is insufficient.
The rugosa rose (Rosa rugosa Thunb.) is a halophyte originating from East Asia. It has traditionally been used as food to prevent intractable diseases, such as diabetes (Cho et al., 2004). It is naturally grow well in various environments, from coastal to inland habitats, and is resistant to harsh climatic conditions and salinity. Thus, this plant is expected to have various bioactive compounds. Several studies on the antioxidant activity of the rugosa rose have been reported, which have used different extraction methods and investigated different parts of the plant (Demir et al., 2014; Kim et al., 2018; Um et al., 2018).
Extraction is the initial step in the process of obtaining bioactive compounds from plants (Jung et al., 2017; Manurung et al., 2019; Min et al., 2019). The extraction conditions differ depending on the target bioactive compound in the same plant. Various extraction methods have been developed to separate bioactive components from plants. Soxhlet extraction, heating reflux extraction, and maceration have been used as traditional extraction methods (Kim et al., 2017). However, these methods require high temperatures and are time-consuming, and thus their extraction efficiency is low in terms of the energy consumed during extraction (Yang et al., 2013). In order to overcome these disadvantages, ultrasoundsassisted extraction (UAE) was suggested. This method improves the extraction efficiency by increasing the contact area between the solvent and the target compounds present in the cell wall of the plant (Rodríguez-Rojo et al., 2012). The method has the advantage of rapidly extracting target compounds using a small amount of solvent. The extract yield differs depending on several variables that include the ultrasonic power, extraction temperature and time, and solvent type. It is important that the optimal extraction conditions for each target compounds be determined, taking into account the several variables on which UAE depends (Vilkhu et al., 2008; Wang et al., 2008).
UAE has higher extraction efficiency than conventional methods at the laboratory scale. However, as the extraction scale increases, the energy required for UAE increases rapidly (Preece et al., 2017). Therefore, it is important to determine the scale at which UAE has maximum extraction efficiency at the most feasible absorbed power density and absorbed energy density in the extraction efficiency.
In this study, we performed UAE to extract ascorbic acid from the rugosa rose fruit. The conditions of solvent concentration (50% ethanol) and liquid/solid ratio (1:20) for UAE were the same as described previously (Um et al., 2018). Based on these parameters, the optimal UAE conditions were investigated by response surface methodology, using the two independent variables of reaction time and temperature. In addition, we validated the ascorbic acid extract to ensure the reliability of our results. The specificity, linearity, limit of detection, limit of quantification, precision, and robustness were assessed according to the guidelines of the International Conference on Harmonization (ICH) were conducted for method validation to determine ascorbic acid extraction. Finally, we analyzed the extraction efficiency by taking into account the absorbed power density (W/mL) and absorbed energy density (J/mL) for UAE at the laboratory scale.
2. MATERIALS and METHODS
The rugosa rose was grown at Chonnam National University (35°10'25.6"N, 126°54'00.8"E, South Korea) and harvested in November 2016. After harvesting, the fruit was washed in water and freeze-dried for 2 days. The dried fruit was then ground to pass through a 40 mesh sieve and stored at 4°C in a sealed state.
The extraction from the rugosa rose fruit was carried out in an ultrasonic water bath (NXP-1505P, KODO Technical Research Co., Ltd., Hwaseong, Korea) operating at an ultrasonic power and frequency of 220 W and 40 kHz, respectively.
Ascorbic acid (No 23024, 99.7-100.5%) and gallic acid (No G7384, 97.5-100.5%) were purchased from Sigma Aldrich (St. Louis, MO, USA). Methanol for HPLC analysis was purchased from Duksan Pure Chemicals Co. (Ansan, Korea). The ascorbic acid was analyzed by HPLC (e2695, Separations module, Waters Co., Milford, MA, USA), equipped with a SunFire® C18 column (SKU: 186002560 Waters Co.) and a UV/Vis Detector (2489, Waters Co.). The analysis was performed at 254 nm and a column temperature of 30°C for 10 min (Nováková et al., 2008). In addition, 0.1% phosphoric acid (w/v) in 30% methanol was used as the mobile phase, and the flow rate was 0.6-1.0 mL/min.
A central composite design was used to optimize the extraction of ascorbic acid from rugosa rose fruit (Nováková et al., 2008). The temperature (X1, 16-44°C), reaction time (X2, 16-44 min) and five replicates at the central point were chosen as the independent variables by central composite design. The ascorbic acid concentration (Y1, mg/g) was used as the dependent output variable. Further, the other extraction conditions selected were the ethanol concentration (50%) and liquid/ solid ratio (1:20), which were in accordance with a previous study (Um et al., 2018). After each extraction process, the extract was separated from solid fraction by vacuum filtration and subsequently concentrated using a rotary evaporator. The concentrated extract was then freeze-dried for further analysis. Design Expert 10 (State Ease Inc., Minneapolis, MN, USA) was used for model building and data analysis.
The specificity, linearity, limit of detection (LOD), limit of quantification (LOQ), precision, and robustness were assessed according to the guidelines of the International Conference on Harmonization (ICH) for method validation in order to determine the presence of ascorbic acid in the extract obtained by RSM at optimal conditions (Shabir, 2003; Sahu et al., 2018).
The specificity was evaluated by HPLC as described above. Specificity implies the property of accurately distinguishing the target component (ascorbic acid) from other components by HPLC. Methanol was used as solvent. Ascorbic acid and gallic acid were used as the standard components to determine the chromatogram resolution. The standard component concentration was 100 μg/mL.
The linearity was evaluated for the extracts diluted at five different concentrations (50, 75, 100, 125, and 150 μg/mL). The ascorbic acid concentration in each diluted sample was measured by HPLC as described above. The LOD and LOQ were calculated for the analytes in six repeats.
The precision was evaluated to ensure repeatability of the extraction process. The precision for ascorbic acid was determined by HPLC for three different extract concentration (50 μg/mL, 100 μg/mL, and 150 μg/mL), by different analysts (analyst 1 and analyst 2), and at different dates (day 1 and day 2). The precision experiments were carried out both intra-day (within a day) and inter-day (between days).
The robustness was evaluated to assess the change in the relative standard deviation (RSD) by modification factors such as the column temperature (30°C and 35°C), solvent type (different manufacturers), and flow rate (0.6 mL/min and 1.0 mL/min). The ascorbic acid was detected by HPLC in six repeats for each condition.
All experiments in this study were performed in more than triplicate (RSM N = 3, Validation N = 6). Two way ANOVA was performed to determine the significant differences between mean values. The Pearson correlation coefficient was used to determine the correlation between the variables used, and the differences were considered significant at a p-value < 0.05.
The absorbed power density (APD, W/mL) and absorbed energy density (AED, J/mL) were investigated according to the UAE scale (solid/solvent: 2 g/40 mL, 5 g/100 mL, 10 g/200 mL, and 20 g/400 mL) (Chan et al., 2013), using the equations (1)-(3).
Q: total heat absorbed in the solvent during the UAE heating (J) (Incropera et al., 2007)
V: solvent volume (mL)
tH: UAE heating time (min)
mL: initial mass of the extraction solvent
CP: heat capacity of the extraction solvent
ΔT: temperature differential after UAE
t: extraction time (min)
3. RESULTS and DISCUSSION
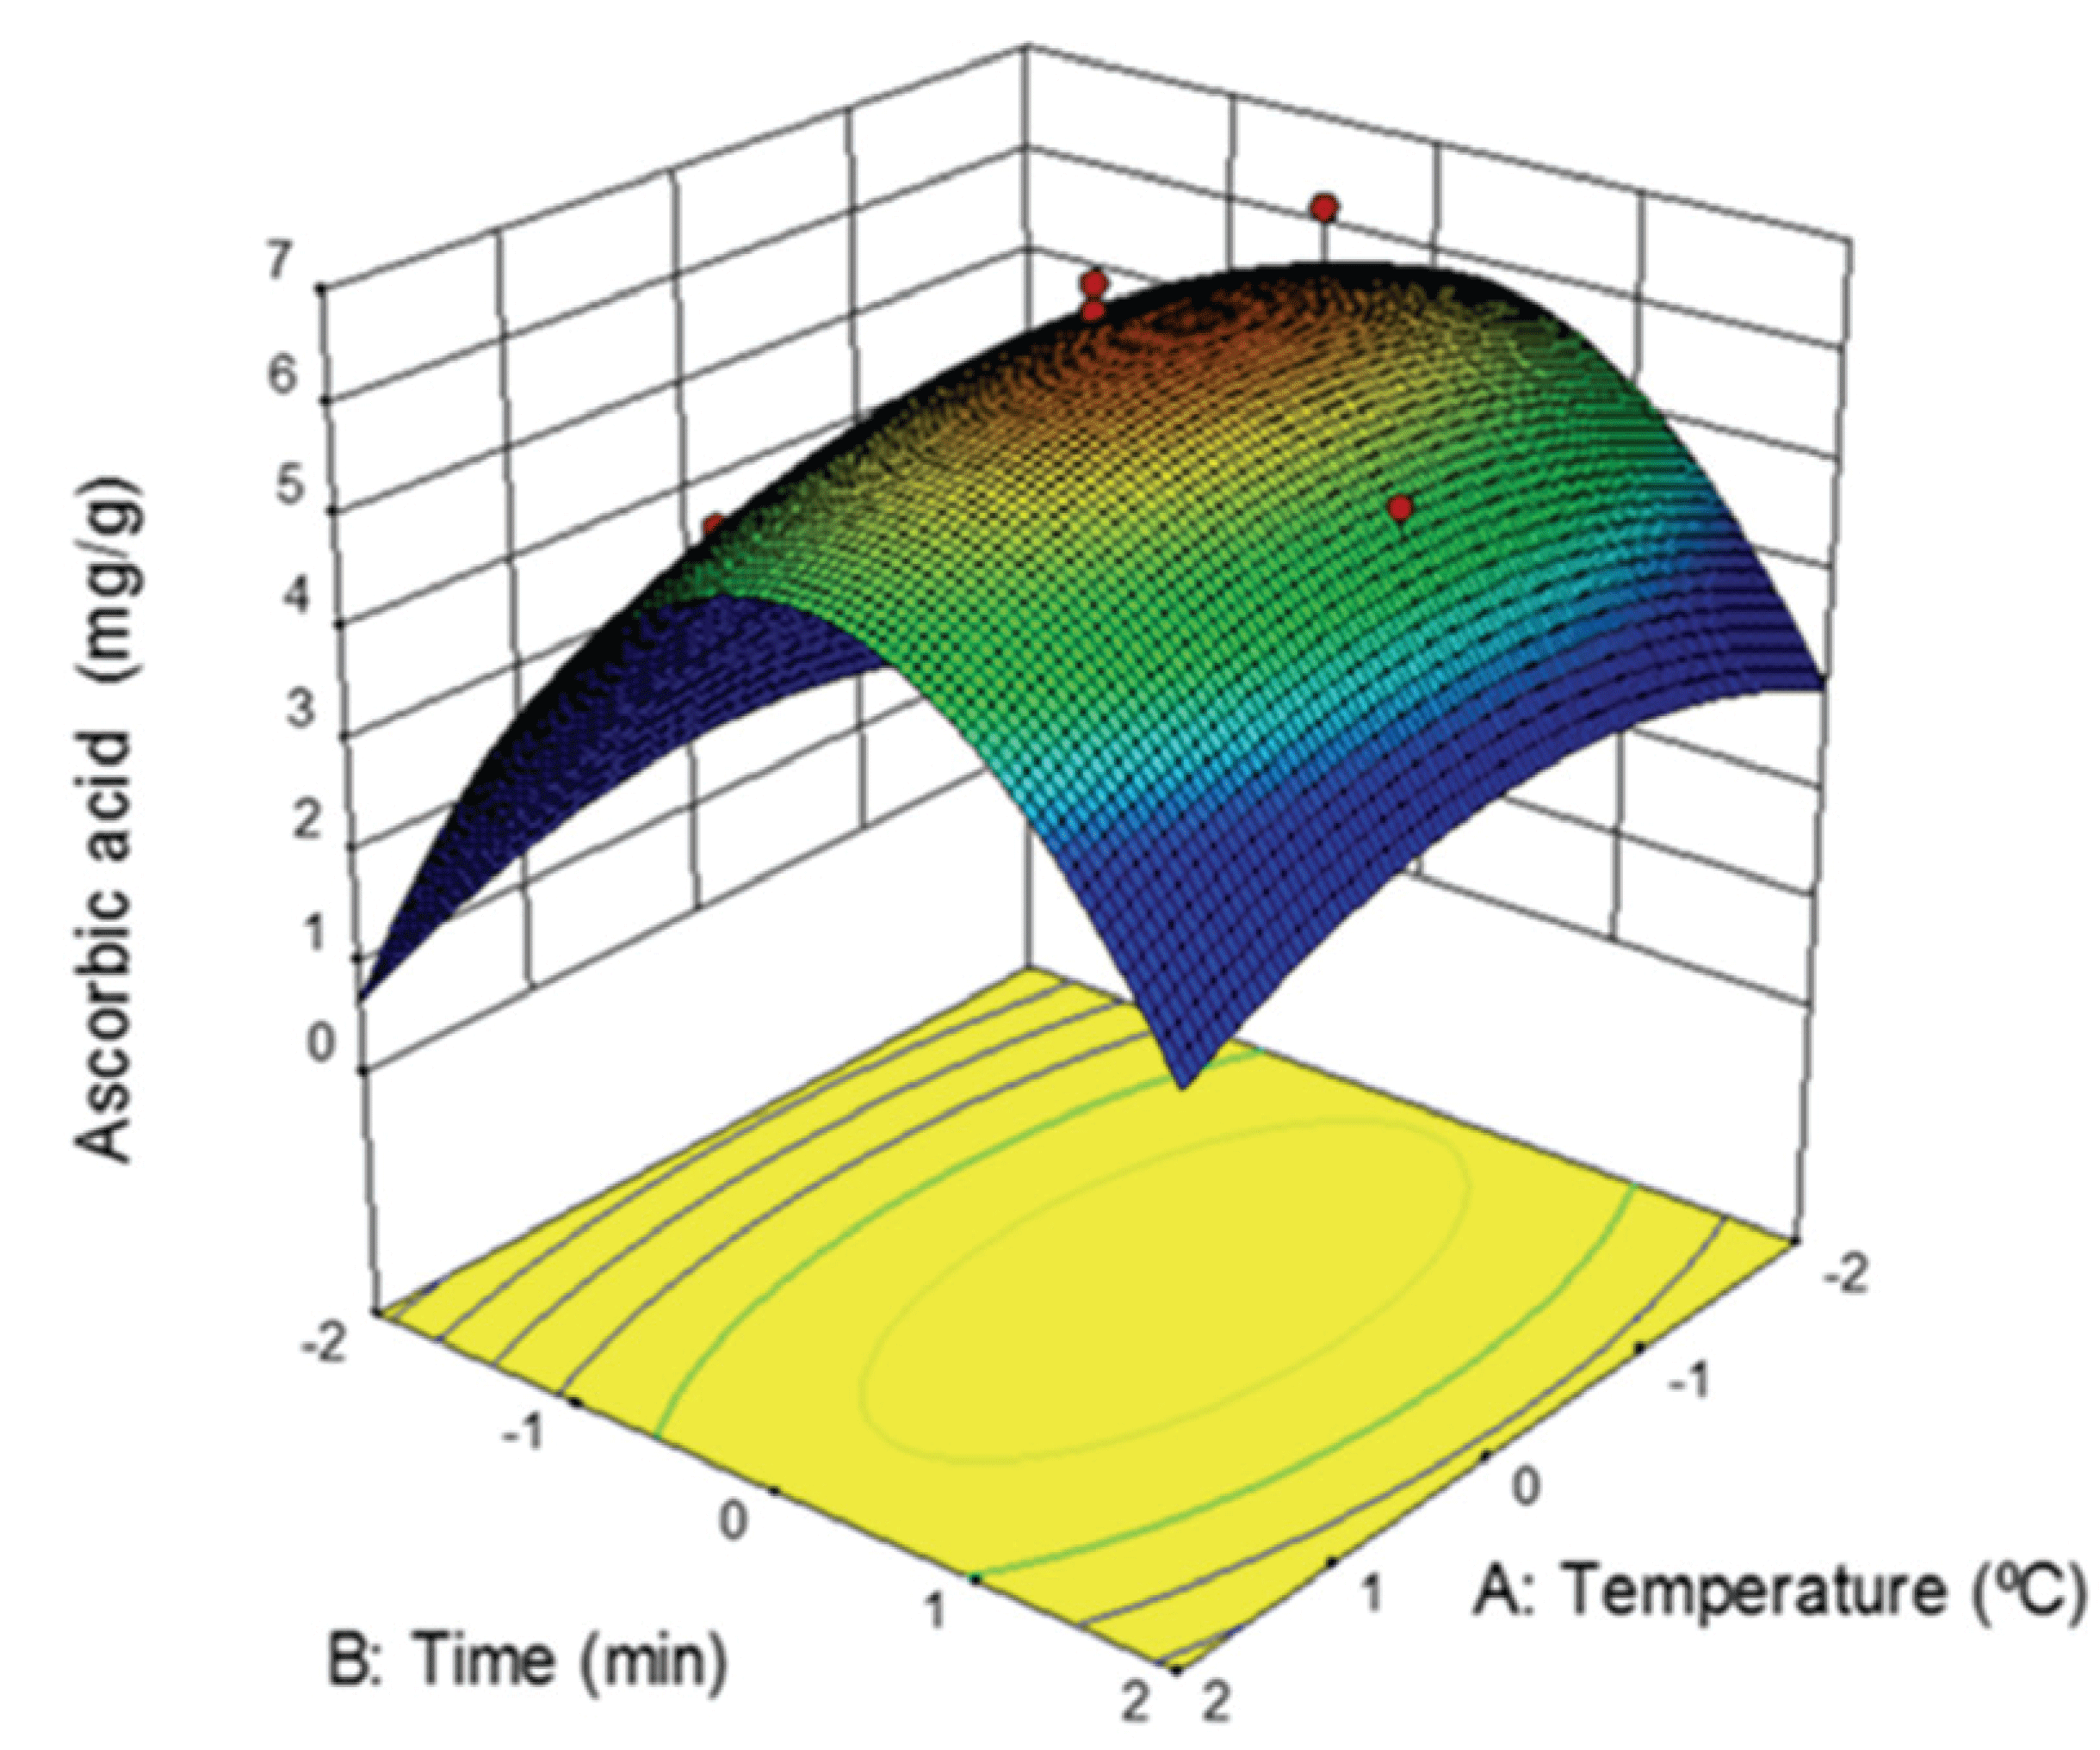
The independent variables (solid/solvent ratio, temperature, time, and extraction method) that define the extraction conditions can have either a concerted or an independently effect on target compound extraction (Vaez et al., 2012). In previous study, the optimum solvent concentration for ascorbic acid extraction from rugosa rose fruit was suggested to be 50% ethanol (Noordin et al., 2004; Rodríguez-Rojo et al., 2012). In this study, ascorbic acid was extracted from rugosa rose fruit using a central composite design that considered two other independent variables: temperature and time. The experimental results according to the extraction conditions are shown in Table 1. The highest ascorbic acid concentration was 6.82 mg/g when the rugosa rose fruit underwent extraction at 30°C for 30 min. On the other hand, the extract concentration was lowest, 4.02 mg/g at 30°C and an extraction time of 16 min. These results suggest that ascorbic acid extraction is sensitive to the reaction time rather than the reaction temperature. This is due to the ascorbic acid extraction increase as the time increases at the same reaction temperature.
The ANOVA analysis of the experiment results is shown in Table 2. The p-value was used to confirm the significance of each factor (p<0.05 was considered statistically significant). The ascorbic acid concentration was affected by the independent variable of time (p-value < 0.05). However, the interaction between the two variables (temperature and time) showed no significant effects, with the p-value being higher than 0.05 (p-value =1.00).
For this model the “Lack of Fit F-test” was 6.34, which implied that the lack of fit was not significant relative to the pure error. To fit the model, the lack of fit needs to be non-significant. The model calculated for the response (Y: ascorbic acid concentration, X1: temperature, X2: time) is represented in equation (4).
The equation (4) represents the response surface of the result in Fig. 1. The temperature had no significant influence on the experimental design compared to the time, indicating that a high temperature is not necessary to obtain a high concentration of ascorbic acid. These results are similar to those of a previous study (Um et al., 2018). However, the ascorbic acid extraction was sensitive to the reaction time, because the extract concentration decreased significantly for a relatively short or long reaction time.

The extraction conditions corresponding to a maximum concentration of ascorbic acid were incorporated in the experimental design. In general, as the temperature increases, the movement of molecules accelerates, and the diffusivity of the bioactive compounds improves, leading to higher extract yields (Yang et al., 2010). However, ascorbic acid is sensitive to temperature changes, as it decomposes at high temperatures (Van den Broeck et al., 1998). Therefore, high temperatures are not suited for the extraction of ascorbic acid. Based on the experimental design, the optimal temperature and time for ascorbic acid extraction from rugosa rose fruit were 25°C and 30 min (6.50 mg/g), respectively. The experimental result was 6.55 mg/g, indicating that the models can mathematically present the ascorbic acid extraction from rugose rose fruit.
The specificity, linearity, limit of detection (LOD), limit of quantification (LOQ), precision, and robustness were assessed in order to confirm the detection of ascorbic acid according to the guidelines of the International Conference on Harmonization (ICH) (Sahu et al., 2018).
The specificity for ascorbic acid is shown in Fig. 2. Ascorbic acid and gallic acid were used as standard chemicals to confirm the detected peaks from rugosa rose fruit extract. Ascorbic acid and gallic acid from rugosa rose fruit extract were detected in an HPLC chromatogram, and the major peak was that for ascorbic acid (Fig. 2B). The retention times of the two compounds were in agreement with those of the standard chemicals (Fig. 2C). It was confirmed that the peaks were detected without interaction between the two components. The resolution factor and resolution limit value between the two chemicals were 1.85 and 1.56, respectively. The ascorbic acid and gallic acid in the rugosa rose fruit extract were completely separated by HPLC analysis with a resolution factor of over 1.5 between the two, confirming HPLC to be suitable for assessing the ascorbic acid in the extract (Song and Wang, 2003).

Ascorbic acid concentration in the extract ranged from 50-150 μg/mL. The correlation between the ascorbic acid concentration and the peak areas was confirmed. The ascorbic acid concentration and the peak areas showed a linear proportional relationship. The correlation coefficient (R2) for the extracted ascorbic acid was 0.999 (Table 3). The LOD and LOQ values were calculated based on the standard deviation and the slope of linearity curve which are shown in Table 3.
The precision of the analytical method in detecting ascorbic acid was assessed by analyzing repeatability relative standard deviation (RSD, intra-day) and a reproducibility relative standard deviation (RSD, inter-day) (Table 4) (Zhao et al., 2016). Each RSD showed good precision at less than 5% (N=6). The ascorbic acid extracted from rugosa rose fruit can be considered to provide accurate quantitative analysis data at the proposed concentrations (50-150 μL) (Singh et al., 2006).
Robustness refers to the reliability of the analysis. This property is determined by intentionally changing the variables, such as flow rate, column temperature, and solvent manufacturer, during analysis (Vander Heyden et al., 2001). In this study, experimental robustness determinations were carried out for different solvent manufacturers (A and B), flow rates (1.0 and 0.6 mL/min), and column temperatures (30 and 35°C) (Table 5). The flow rate had the strongest influence on the ascorbic acid analysis. The peak shape was relatively wide at a flow rate 0.6 mL/min of flow rate when a C18 column was used for HPLC. The peak exhibited tailing, and the detected ascorbic acid concentration decreased slightly, from 0.56 to 0.51 μg/mL. On the other hand, the ascorbic acid analysis showed reproducibility for solvent manufacturer and column temperature under the tested conditions. The RSD values were 2.79 and 3.47%, respectively. The RSD values were less than 5% for all conditions. This implies that ascorbic acid can be analyzed stably under the given conditions.
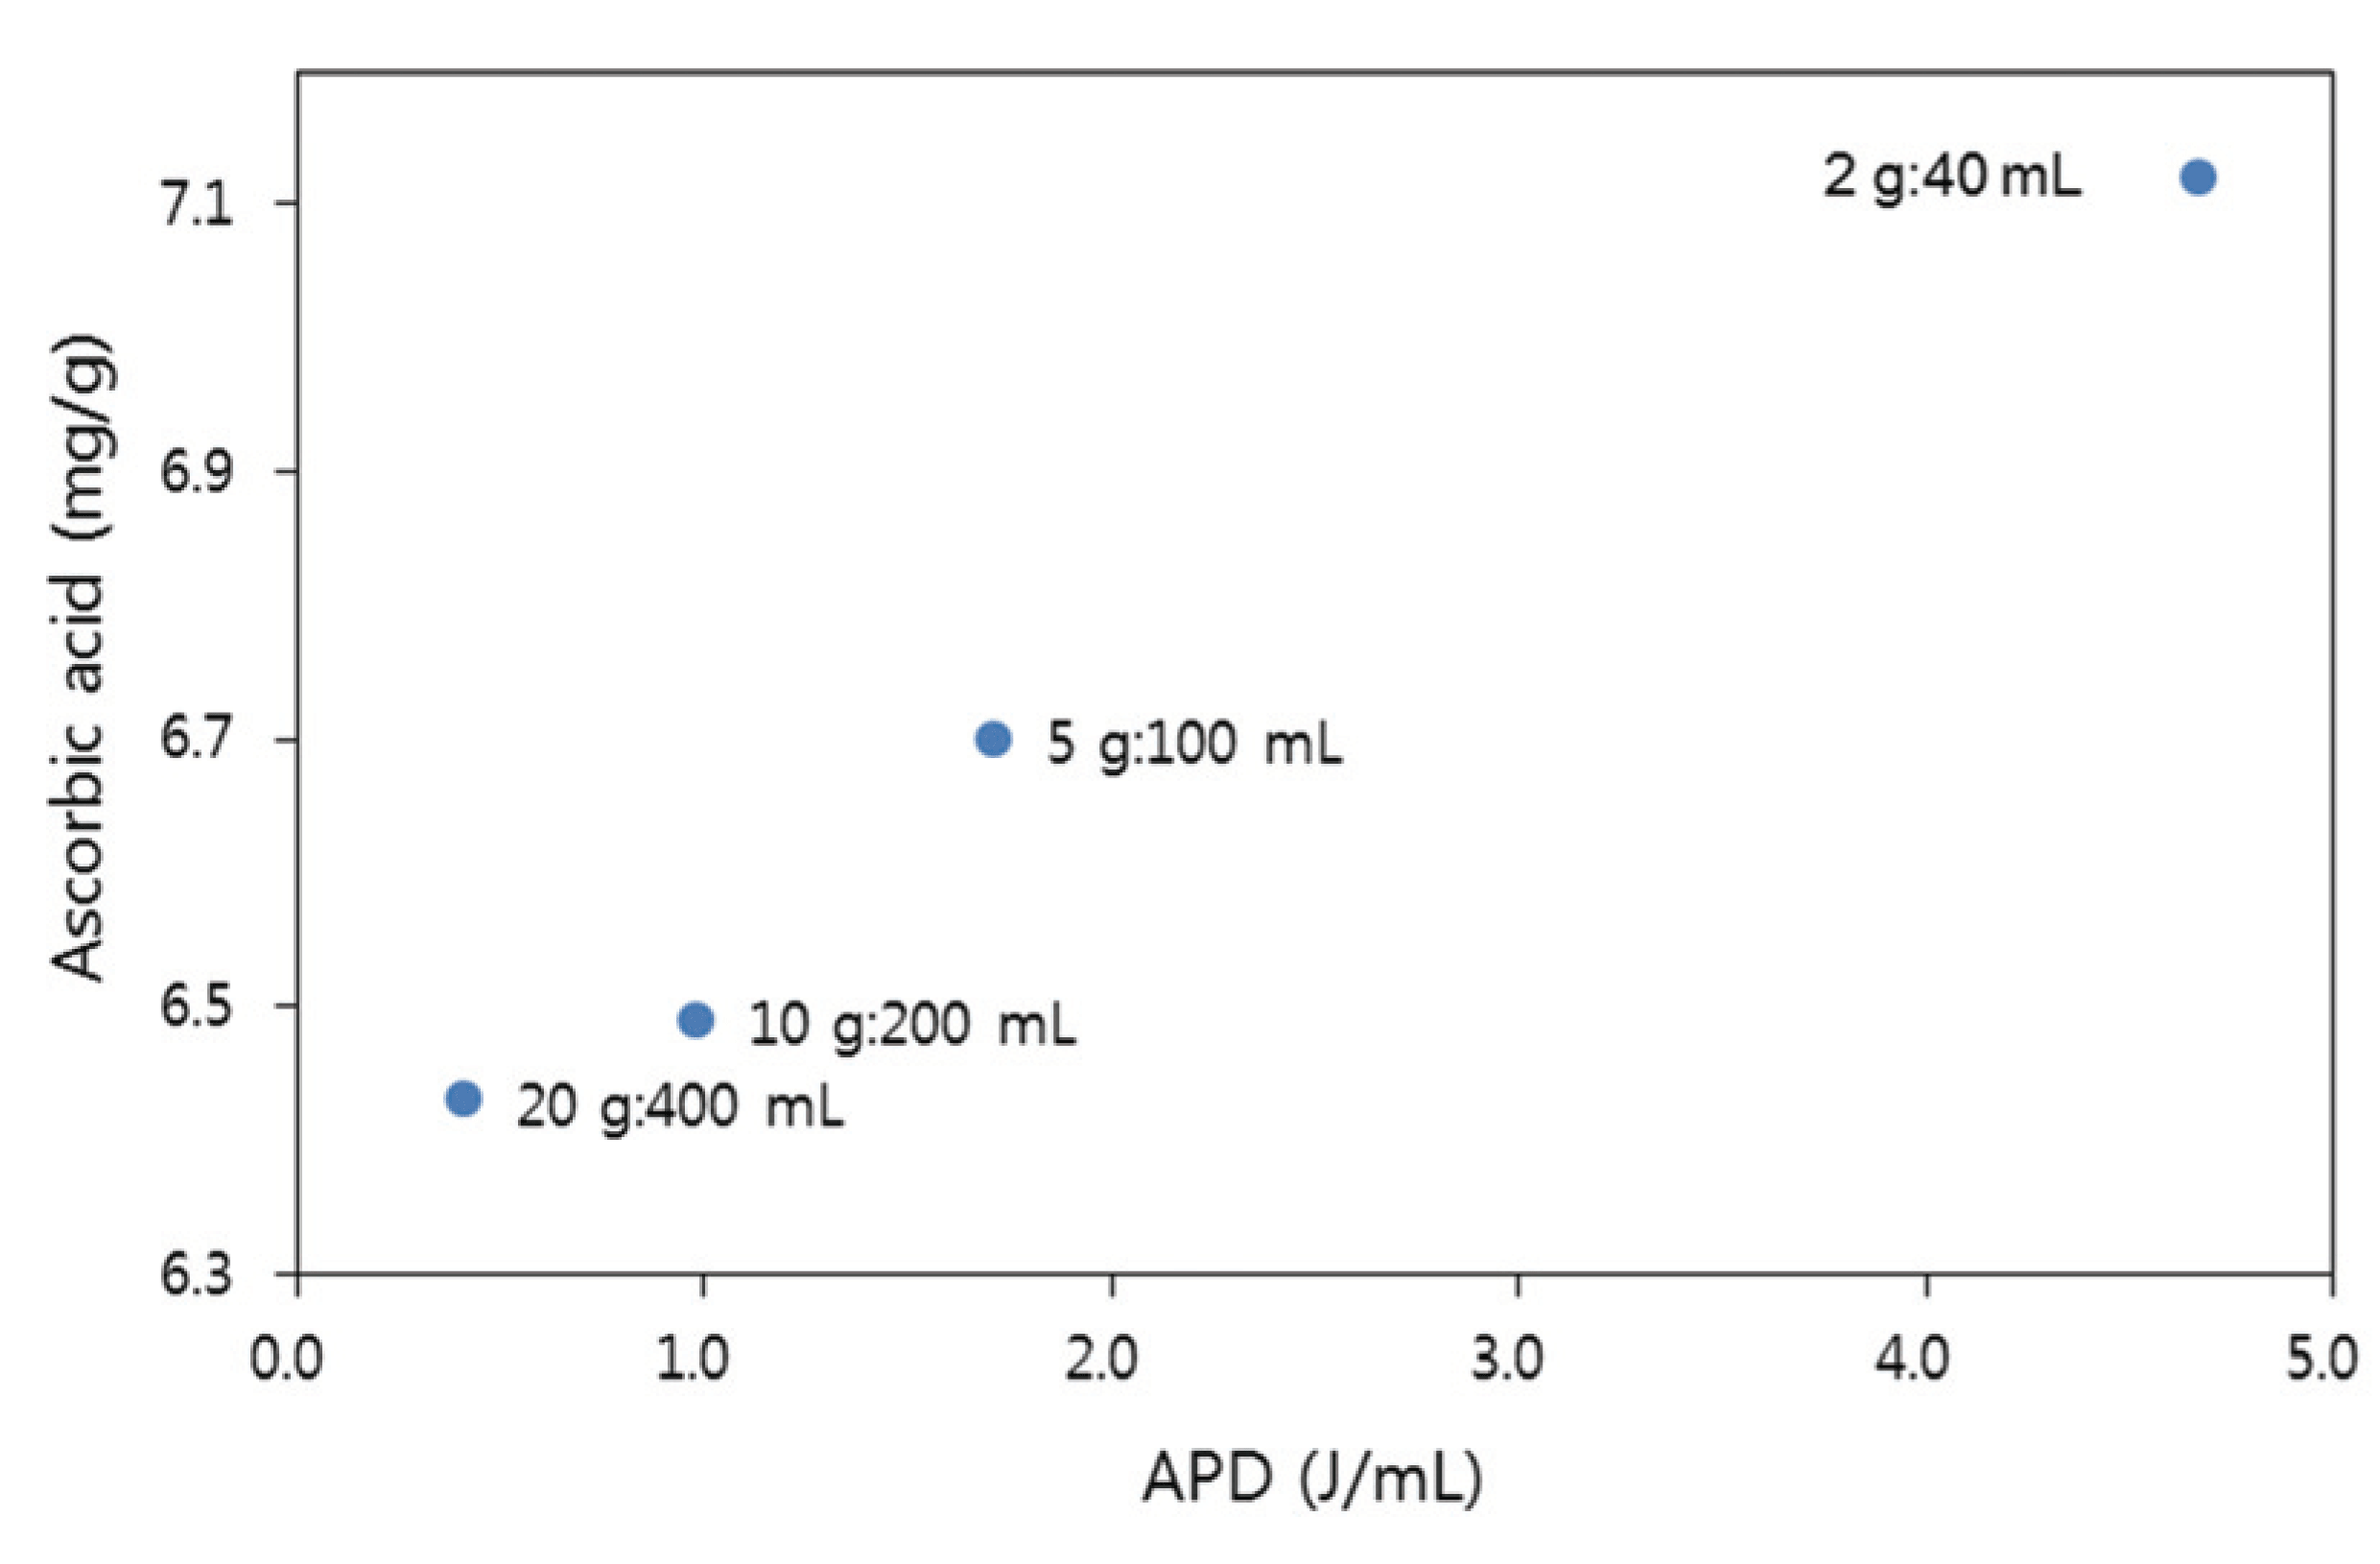
For UAE carried out at laboratory scale, the absorbed power density (APD) and absorbed energy density (AED) were investigated. APD represents the power (W) used per volume of solvent. The AED conveys the energy (J) when consuming 1 W power for a certain period of time. The AED and APD for the extraction of ascorbic acid were proportional according to the extraction scale. The amount of energy consumption decreased as the amount of solvent increased. At an extraction scale of 2:40, the AED was 7002 J/mL, and the energy consumption decreased as the extraction scale increased (616 J/mL, 20:400). Similarly, the APD was 4.67 W/mL at 2:40 scale, and its value decreased to 0.41 W/mL when the extraction scale reached 20:400, which corresponds to a 91.22% reduction. However, the ascorbic acid extraction yield decreased as the extraction scale increased (Fig. 3). The ascorbic acid extraction yield was 6.4 mg/g at an extraction scale of 2:40, and 7 mg/g at 20:400, indicating a 9.7% decrease in the extraction yield. At the 20:400 extraction scale, the AED and APD decreased 91.20% (J/mL) and 91.22% (W/mL), respectively, but the ascorbic acid extraction yield decreased by 9.69% compared to that at the 2:40 extraction scale.

4. CONCLUSION
ANOVA for the ascorbic acid extraction from rugosa rose fruit using RSM revealed that the optimum conditions for ascorbic acid extraction by UAE were 25°C for 30 min. The validation of the extracts was performed by HPLC using an extract concentration in the range of 50-150 μg/mL. In the extracts, ascorbic acid was detected along with gallic acid, and the resolution factor between the two compounds was over 1.5. The correlation coefficient of ascorbic acid in a linearity test was 0.999. The repeatability and reproducibility RSDs were less than 5%. These results suggest that the method is highly repeatable and reproducible. These results further indicate that the validation method is appropriate for the extraction of ascorbic acid and determination of its concentration. The energy consumption (AED and APD) decreased by more than 90% when the extraction scale was increased 10 times, from 2:40 to 20:400. At the same conditions, the ascorbic acid extraction yield decreased by 9.69%. These results can be used as data to reduce the time and energy required to analyze ascorbic acid from such extracts, and can provide basic data for the development of cosmetics development and functional food processing using preparations from rugosa rose fruit.
