1. INTRODUCTION
Medium-density fiberboard (MDF) is a type of wood-based composite panels that are widely used for the building and furniture industries. It is composed of refined wood fibers that have been pressed together under high temperature and pressure with a synthetic resin i.e. urea-formaldehyde (UF) resins to form a homogeneous board. The demand for MDF panels has significantly increased in recent years so that this growth in demand caused its worldwide production to be 93 million m3 in the 2017's (Haeldermans et al., 2019). In 2018, the MDF production in Republic of Korea was about 1,840,000 m3, which was ranked as the 9th country in the world after China, Turkey, Brazil, Poland, Russia, Thailand, the United States and Belarus, respectively (FAO, 2019).
Due to this large volume of MDF production and the short life span of MDF panels compared to other building materials, it is expected to produce massive amounts of waste MDF. This increase in waste MDF requires an effective waste management system to alleviate issues without landfilling and combustion. Unfortunately, these wastes are usually incinerated or disposed to landfill sites (Lee et al., 2014; 2015), which consequently caused many environmental issues such as air pollution, greenhouse gas emissions, and the occupation of useful land. Therefore, finding a way of using these wastes is essential in the management of municipal solid waste (Seo et al., 2019). To alleviate environmental concerns about these wastes and add economic returns to the forest product industry, much research has been done in recent years and distinguishable progress has been achieved. The production of particleboard (Azambuja et al., 2018), wood-plastic composite (Krause et al., 2018), wood cement composite (Karade, 2010), activated carbon (Shang et al., 2014), biofuel via pyrolysis (Aslan et al., 2018), Bio-oil and biogas (Park et al. 2013), and dyed recycling wood fiber (Ju and Roh, 2017) from MDF wastes have been reported.
Production of cellulose nanocrystals (CNCs) from recycled MDF fibers can be an option. There is a growing interest in using CNCs derived from renewable and bio-sources (Kim and Kim, 2019). These nanoparticles can be used in combination with other materials to improve their performance or introduce new applications. CNCs are unique, renewable, biodegradable and non-toxic materials with exceptional mechanical properties (Cho et al., 2012; Khanjanzadeh et al., 2018; Park et al., 2014). These rigid rod-like CNCs display individual characteristics such as high aspect ratio (10–70), high specific surface area (150 m2/g), high strength and modulus (10 and 150 GPa, respectively), and low density (1.6 g/cm3) (Gwon et al., 2018; Khanjanzadeh et al., 2018). With such advantages, CNCs have been widely considered to have great potential applications in diverse fields, including reinforcement agent for films and nanocomposites, drug delivery systems, medical implants, conducting polymer nanocomposites, functional hydrogels, components in tissue engineering materials, protective coatings, supports for enzyme immobilization, etc. (Khanjanzadeh et al., 2018).
So far, two studies were carried out regarding the extraction of CNC from waste MDF (Couret et al., 2017; Gu et al., 2017). In both studies, sulfuric acid hydrolysis has been used for the isolation of CNCs. Acid hydrolysis is the most applied method to prepare CNCs from cellulosic fiber-based materials. The main challenges associated with this process include the use of highly corrosive mineral acids, environment pollution, large amount of water usage, over-degradation of cellulose, the requirement of large amounts of sulfuric acid, the production of a huge amount of salts for neutralization, and lower thermostability of the resultant CNCs because of the sulfate groups (Bashar et al., 2019; Leung et al., 2011; Zaini et al., 2019). Furthermore, the removal of lignin, hemicellulose, wax, and other non-cellulosic components is a prerequisite prior to the extraction of CNCs. In contrast to sulfuric acid hydrolysis, the APS oxidation is a simple and one-step procedure which can be used to prepare CNCs directly from a variety of cellulosic biomass without any pretreatment by removing non-cellulosic components as well as amorphous cellulose.
In general, two simultaneous actions occur during the APS oxidation: (1) removal of lignin, hemicellulose and other non-cellulosic components as well as removal of amorphous cellulose regions. (2) conversion of –OH groups at the C6 position to –COOH groups (Lam et al., 2013; Oun and Rhim, 2017). In fact, the breakdown of amorphous regions and cellulose oxidation through the formation of sulphate radical anion (SO4•–), hydrogen peroxide (H2O2) and hydrogen sulfate ion (HSO4–) are principal mechanism of the APS oxidation, as illustrated in Scheme. 1.
However, to the authors’ knowledge, no report has been made about the preparation of carboxylated CNCs from recycled MDF fiber by the APS oxidation. So, the main goal of this study was to characterize CNCs extracted from recycled MDF fiber using the APS oxidation. The properties of the obtained CNCs were characterized by transmission electron microscopy (TEM), conductometric titration, and ATR-FTIR spectroscopy. Prior to the CNC extraction, the chemical composition of the recycled MDF fibers were determined according to relevant standard methods.
2. MATERIALS and METHODS
Ammonium persulfate (APS; (NH4)2S2O8, >98.0%); Sulfuric acid (H2SO4; >98.0%); Sodium hydroxide (NaOH; >97.0%); Potassium sulfate (K2SO4; >99.0%); Mercuric oxide (HgO; >99.0%); Boric acid (H3BO3; > 99.5%) and Dextrose (C6H12O6; >98.0%) were purchased from Daejung Chemical Industry Co., Ltd., Korea. Sodium chlorite (NaClO2; >78.0%); Benzene (C6H6; >99.5%) and Ethanol (C2H5OH; >99.5%) were purchased from Duksan Pure Chemicals Co., Ltd., Korea. Purified water by a reverse osmosis system with a conductivity of 6 μS/cm was obtained from Ultra-pure ROTech, Korea and was used for experiments. All the chemicals were analytical grade purity and were used as received without further purification. This work used recycled MDF fibers with about 1.08 mm length that had been prepared by the previous work (Hong et al., 2018).
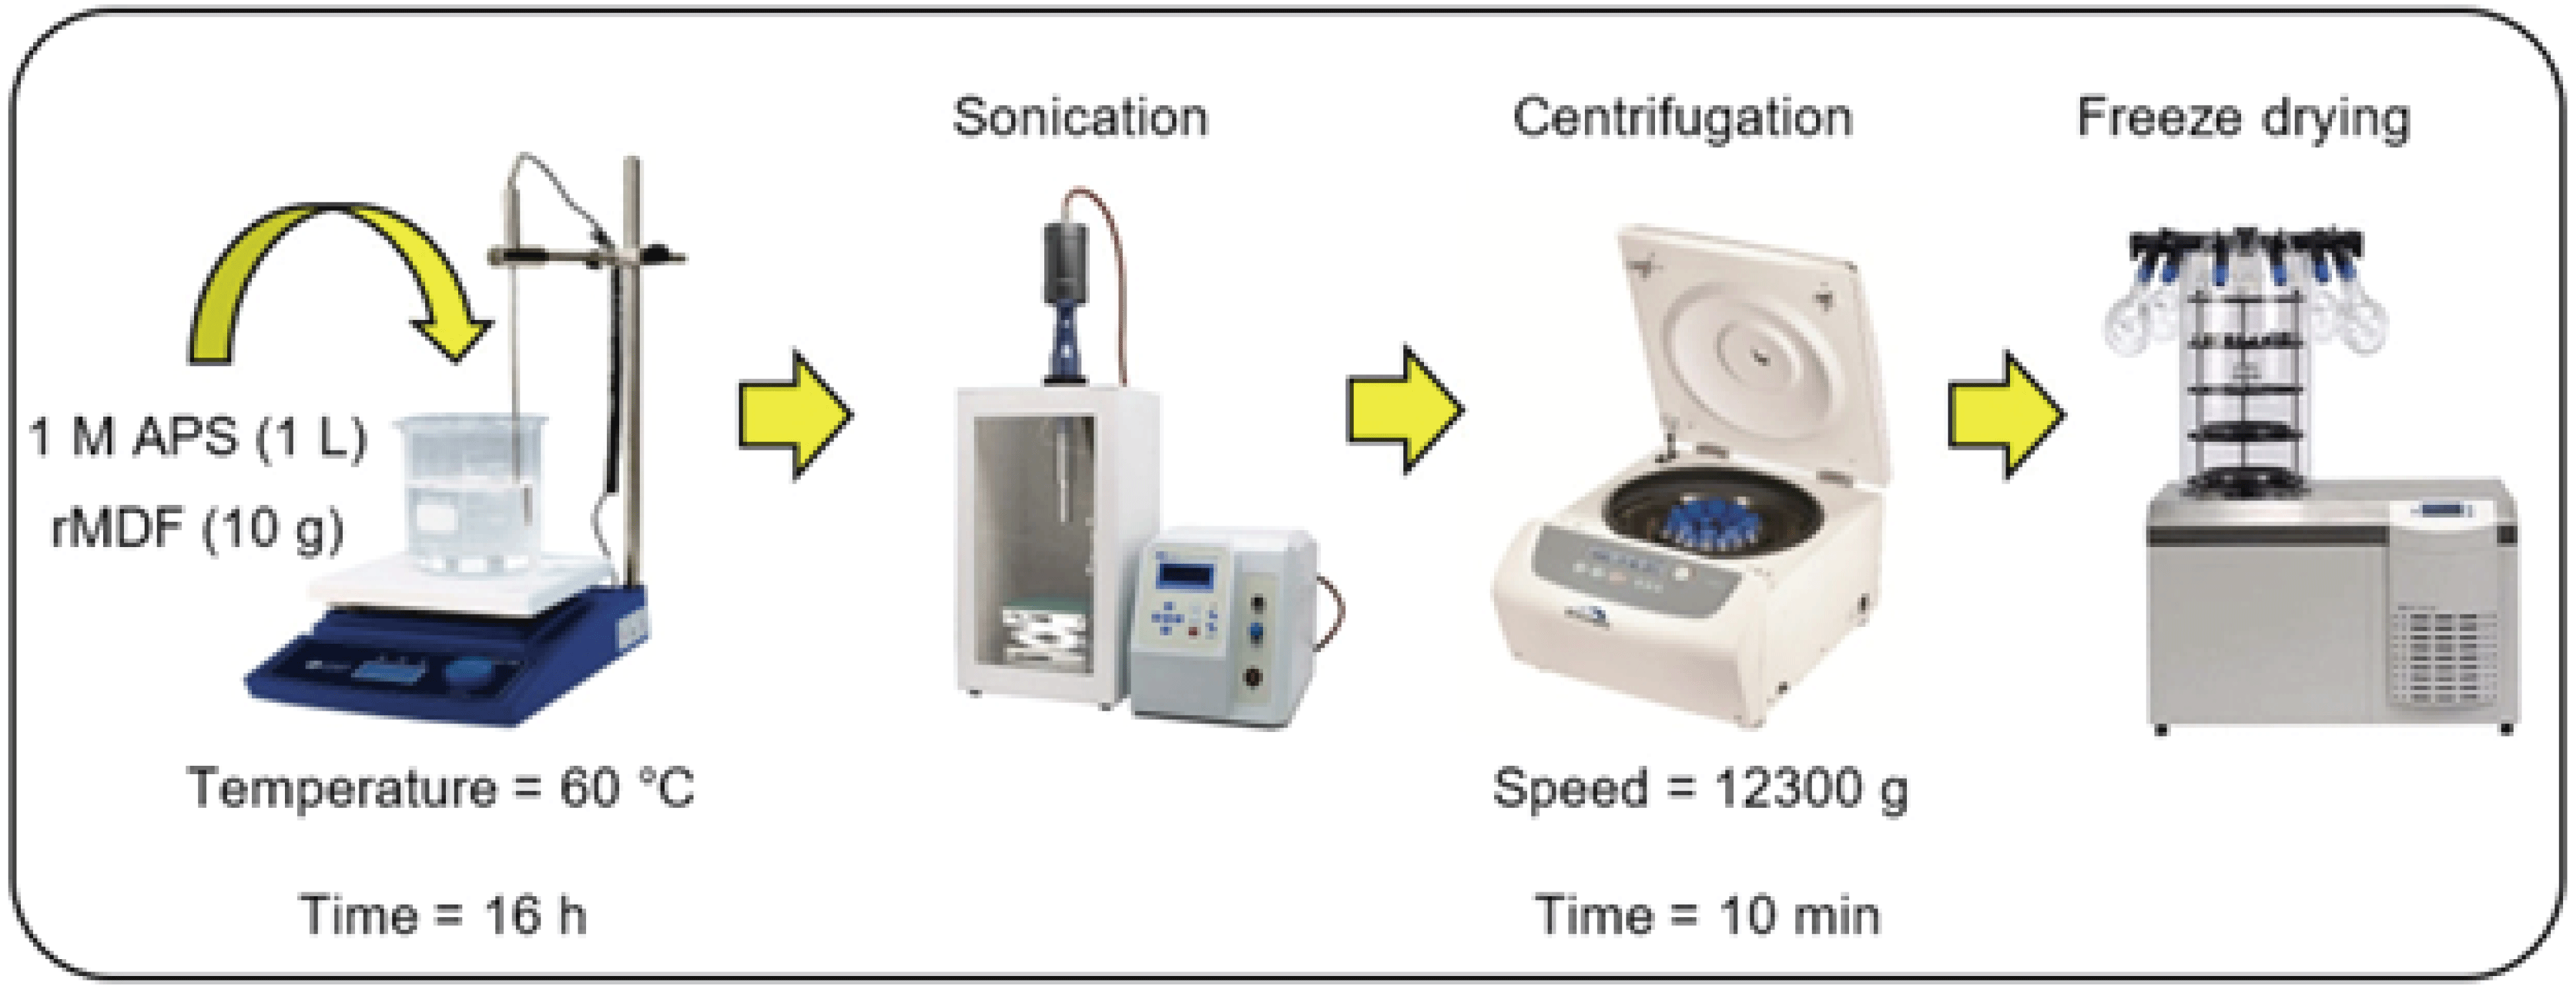
A schematic diagram of the preparation of CNCs using APS oxidation is shown in Fig. 1. 10 g of recycled MDF fibers as the starting material and 1 L of 1 M APS solution were introduced into a large beaker, onto a magnetic stirrer hotplate, equipped with a temperature controller. The mixture was heated at 60 °C for 16 h under constant mechanical stirring and an aluminum foil cover to prevent the evaporation of water. At the end of the desired reaction time, the vessel was placed in an ice bath to terminate the oxidation. The suspension was sonicated for 40 min using a high-power ultrasound processor (Sonomasher ULH-700S; ULSSO High-Tech Co., Cheongwon, Korea) at 20 kHz frequency with a probe diameter of 1 cm and then centrifuged for 10 min at 12,300 g (Labogene 1580, Gyrozen Co., Ltd., Daejeon, Korea). After each centrifugation, the supernatant was decanted and replaced with deionized water. The centrifugation/ washing cycle was repeated until the solution pH was ~4. Then, the sample was sonicated in an ice bath 30 min before freeze-drying. The purified suspension was frozen at -18°C overnight and freeze-dried under vacuum at room temperature to give white flaky solid freeze-dried CNCs.
A transmission electron microscopy (TEM) (JEM- 2100F, Jeol Ltd., Tokyo, Japan) was used to observe the morphology of the isolated CNCs. For TEM analysis, the CNC suspension was diluted to a concentration of 0.01 wt% and sonicated for 10 min. until the sample was uniformly dispersed. A droplet of this diluted suspension was dropped on a copper grid and allowed to dry at room temperature. Then a droplet of 3% uranyl acetate was applied to stain the specimen and the excess stain solution was removed with a filter paper. After that, the samples were allowed to dry at room temperature and the morphology and size of the CNCs were observed by TEM. The size of the CNCs was determined by measuring over 100 CNCs using an image analysis software.
The content of carboxylic acid groups on the surface of CNC after the oxidation was determined by the conductometric titration method according to the procedure reported by Saito and Isogai (2004) with a minor modification. In a typical titration experiment, about 0.3 g freeze-dried CNC sample was dispersed in 55 ml DI water and 5 ml NaCl (0.01 M), and the mixture was sonicated for 10 min to obtain a very well-dispersed suspension. Then, the pH of the dispersion was adjusted to 2.5-3.0 by adding 0.1 M HCl and the titration was performed using 0.01 M NaOH solution at the rate of 0.1 ml/ min up to pH 10. The conductivity was plotted against the volume of NaOH consumed, and the difference in NaOH volume between the start and the end of the plateau region was determined from where the regression lines were intersect, which represented the volume of NaOH used to neutralize the carboxylic acid groups. The results can be calculated using equation 1:
where ΔV is the difference in NaOH volume for the plateau region, CNaOH is the concentration of NaOH, and m is the mass of the CNCs used in the titration.
FTIR spectra were obtained using an ATR-FTIR spectroscopy (ALPHA-P model, Bruker Optics, Germany) equipped with an ATR universal accessory at room temperature. The spectra were recorded in absorbance mode over the wavenumber range of 400–4000 cm-1, with 32 scans for each spectrum and a scanning resolution of 4 cm-1.
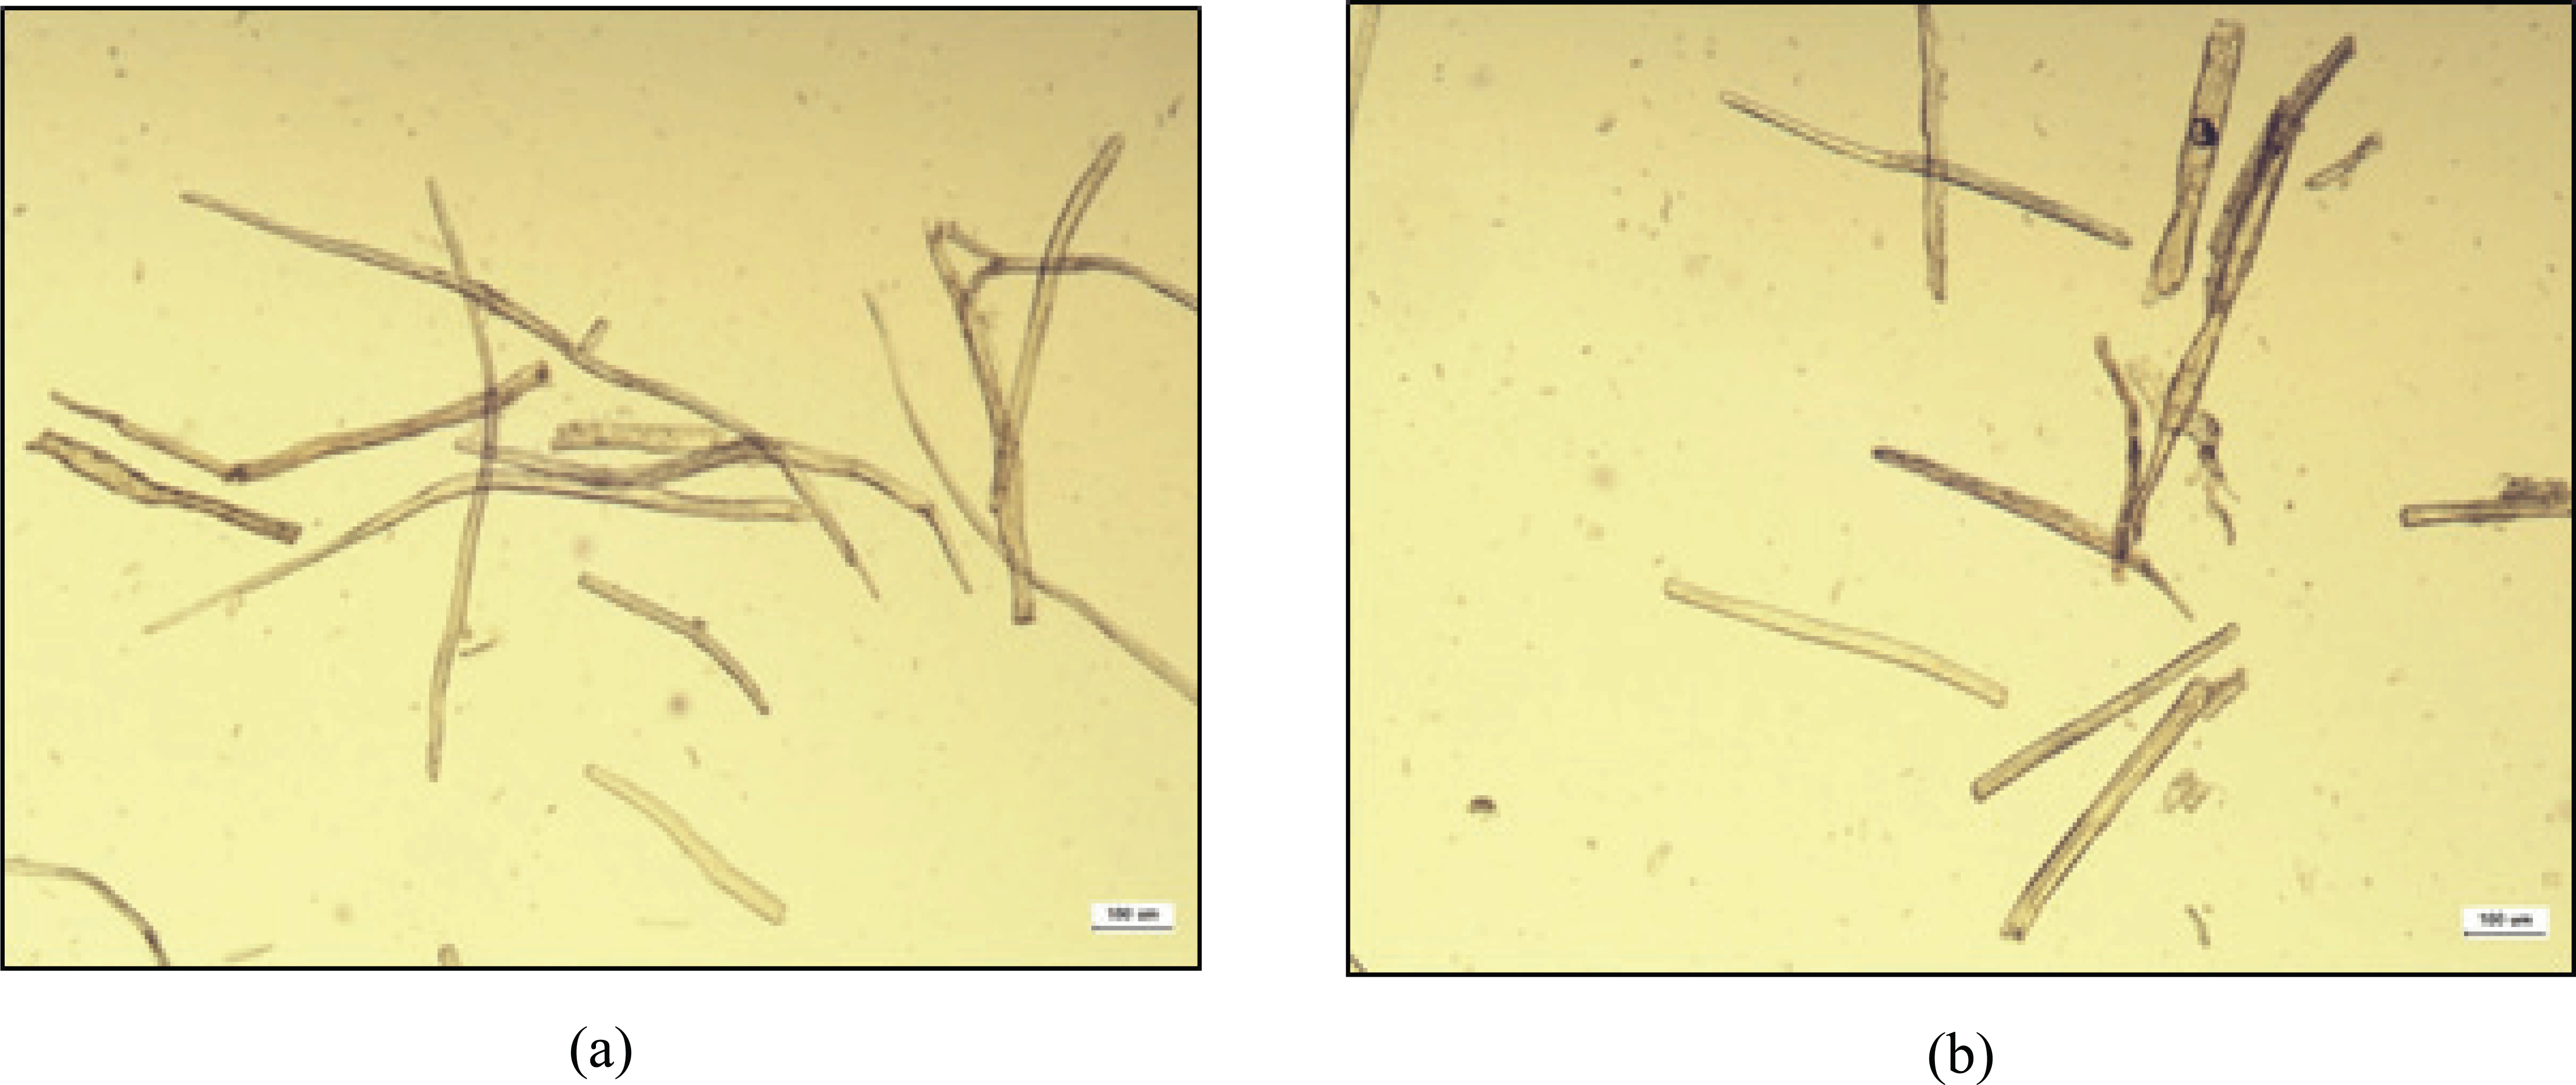
A light microscope (BX50, Olympus, Japan) was used to capture images of recycled MDF fibers for the measurement of their length and diameter. First, the fibers were suspended in deionized water and one single droplet of the diluted suspension was dropped on the microscope slide and covered with a cover glass. Then, images were taken at a suitable magnification at room temperature. Image analysis software (iSolution) was used to measure the length and diameter of each fiber. An average of 50 images was analyzed for the recycled MDF fiber.
For chemical composition analysis, recycled MDF fibers were ground to powder with microfine grinder (MF10, IKA, Germany) and 40–60 mesh fractions were chosen for further use. The chemical composition of recycled MDF fibers was determined according to the relevant standards. Extractives content was measured with ethanol-benzene extraction according to TAPPI method T204 cm-97 (TAPPI, 1997). An amount of approximately 2 g of oven-dried recycled MDF fibers (W1) was weighed out into an extraction thimble and placed into a Soxhlet extraction tubes connected to a pre-weighed flask containing 150 mL of the ethanol-benzene mixture at 1:2 v/v. The Soxhlet apparatus was placed, with condenser attached into the heating mantle and the temperature of the heating mantle was adjusted to provide a boiling rate that cycled the solvent at least six times per hour. After the extraction was completed, most of the solvent in the flask was evaporated leaving behind a few milliliters of solvent containing the extractives. The extractives were dried for 1 hour at 105 °C, then cooled in a desiccator and weighed (W2). The extractive-free samples were used to determine lignin, holocellulose and α-cellulose content of recycled MDF fibers. The extractive content was calculated as the Eq. (2):
The ash content of the recycled MDF fibers was determined by the TAPPI T211 om-02 standard procedure (TAPPI, 2002). First, the ceramic crucibles were dried at approximately 525 ± 25 °C for 30 min. Then they were put in a desiccator for 45 min and weighed. About 3 g of recycled MDF fibers (W1) were placed in ceramic crucibles and then the crucibles were closed. They were put in a muffle furnace at 525 ± 25 °C until all carbon was removed. The samples in the crucible were occasionally mixed. This process continued for at least 4 h. All black particles should be lost and the samples should be completely white by the end of this time. After that, the sample was weighed (W2). The ash content in samples was calculated as the Eq. (3):
The nitrogen content of the recycled MDF fibers was measured using the Kjeldahl method according to the TAPPI T418 cm-07 standard (TAPPI, 2007). About 2 g of recycled MDF fibers placed in a 500-mL Kjeldahl flask, 15 g of potassium sulfate and 0.7 g of mercuric oxide and 25 mL of concentrated sulfuric acid were added into the flask. The digestion was initiated by maintaining the temperature at about 150 °C until white fumes appeared. The temperature was then raised until the acid boils gently. The sample experiences distinct color changes and ultimately becomes colorless and the fuming ends. The digestion was maintained further at this temperature for an additional 1 h. Once the digestion was completed, the digestion residue obtained was cooled and diluted with 300 mL DI water. The distillation was performed after the addition of 55 mL of 50% w/v sodium hydroxide to convert the ammonium sulphate to ammonia. One gram of dextrose was also digested simultaneously to constitute the blank test.
Boric acid indicator solution was used to capture the ammonia gas. Distilled ammonia was absorbed on 50 mL boric acid indicator solution up to 150 mL and then diluted to about 250 mL with DI water. Finally, the nitrogen content was determined by titration with 0.1 N of hydrochloric acid after blank correction shown as the Eq. (4). During the titration, the color changed from green to gray and finally to purple.
where V is volume of hydrochloric acid required to titrate the distillate (mL), N is normality of hydrochloric acid (N), W is weight of sample (g), and 1.4 is equivalent weight of nitrogen (g).
Acid-insoluble lignin content was determined using TAPPI standard T222 om-02 (TAPPI, 2002). Accordingly, about 1.0 g of oven-dry extractives-free sample was treated with 15 mL 72% sulfuric acid and kept at a 20 °C water bath for 2 h. Followed by the amount of 575 mL of DI water was added to the sample to make up a sulfuric acid concentration to 3% and kept under reflux for 4 h. After the end of the reaction, the system was cooled for 30 min at room temperature. The hydrolyzed solution was filtered through a previously weighed sintered (medium) glass crucible and washed with DI water until the pH of filtrates was equal to that of the DI water. After these washings, the solid residue was dried at 105 °C for 24 h and used to determine the insoluble lignin (Eq. (5)).
where W2 is weight of the oven-dry lignin residue (g), and W1 is weight of the oven-dry extractives-free recycled MDF fibers (g).
Holocellulose and α-cellulose content were determined using a protocol established by Han and Rowell (Han and Rowell, 2008). Briefly, to 2.5 g of sample were added 80 mL of hot distilled water, 0.5 mL acetic acid, and 1 g of NaClO2 in a 250 mL Erlenmeyer flask and heated on a water bath at 70 °C. After 60 min, 0.5 mL of acetic acid and 1 g of NaClO2 are added. After each succeeding hour, fresh portions of 0.5 mL acetic acid and 1 g NaClO2 are added with shaking. The addition of acetic acid and NaClO2 continued until the fibers were completely separated from the lignin (6 h). Then, the sample was left in a water bath overnight. At the end of the reaction, the sample cooled, and then the holocellulose filtered on filter paper using a Buchner funnel and then rinsed with acetone. Ultimately, the holocellulose dried in a vacuum oven at 105°C for 24 h. The mass difference before and after the acid treatment was used to calculate the holocellulose content according to Eq. (6).
where W2 is weight of the oven-dry holocellulose residue (g), and W1 is weight of the original oven-dry extractives-free recycled MDF fibers (g).
The α-cellulose content was determined as follows: First, 2 g moisture-free holocellulose sample was added to 10 mL 17.5% NaOH solution at 20 °C. Then, 5 mL 17.5% NaOH solution was added to the mixture per 5 min until an ultimate volume of 25 mL was achieved. Following 30 min, 33 mL DI water was added and stirred for 1 h. The filtered solid phase was washed, first once with 100 mL 8.3% NaOH solution and then twice with DI water. Also, 15 mL 10% acetic acid was poured onto the solid phase and washed until pH ≈7. Finally, the sample dried in a vacuum oven at 105 °C for 24 h. The α-cellulose content was calculated according to the Eq. (7):
where W2 is weight of the oven-dry α-cellulose residue (g), and W1 is weight of the original oven-dry holocellulose sample (g). Finally, the hemicellulose content was determined by subtracting the α-cellulose content from the holocellulose content.
3. RESULTS
Fig. 2 shows the optical micrographs of recycled MDF fiber. The length and diameter of these fiber were 434 ± 148 μm and 22.76 ± 9.50 μm, respectively.
The mass fractions of cellulose, hemicellulose, lignin, extractives, ashes, and nitrogen of the recycled MDF fibers are summarized in Table 1. In lignocellulosic materials, the term “extractives” refer to a group of low molecular weight salts, fats, waxes, resins, carbohydrates, and non-volatile hydrocarbons. The extractive content of the recycled MDF fibers was determined as 4.70% based the fiber dry mass. The analysis results also showed that recycled MDF fibers contained 0.55% ash and 2.70% nitrogen. It was believed that the nitrogen resulted from urea-formaldehyde (UF) resins used as adhesive for the MDF manufacture. The cellulose content of the recycled MDF fibers was 40.51%, which was comparable with poplar (39%), birch (41%), pine (42%) and lower compared to cedar (44%), balsa (48%), and spruce (49%) (Madsen and Gamstedt, 2013). Meanwhile, the amounts of hemicellulose and lignin were 24.79% and 24.75%, respectively.
| Constituents | Weight (%) |
|---|---|
| Cellulose | 40.51 (0.63) |
| Hemicellulose | 24.79 (0.45) |
| Acid-insoluble lignin | 24.75 (0.71) |
| Solvent extractives | 4.70 (0.72) |
| Nitrogen | 2.70 (0.03) |
| Ash | 0.55 (0.06) |
Fig. 3 shows TEM images of the carboxylated CNCs from recycled MDF fibers at different magnifications. These images clearly show that the resultant CNCs have a rod-like morphology, confirming their successful extraction from recycled MDF fibers. The average diameter and length of extracted CNCs were at a nanometer scale. From the TEM analysis, the length of CNCs measured was an average of 167±47 nm with a range of 100~295 nm, and the diameter was an average of 8.24±2.28 nm with a range of 5~15 nm, leading to an aspect ratio (L/D) of 20. These values are similar to those reported in the literature for rod-shaped nanocrystals (Castro-Guerrero and Gray, 2014; Mascheroni et al., 2016; Rampazzo et al., 2017).
Fig. 4 shows the conductometric titration curve of the suspension of carboxylated CNCs after the APS oxidation. As exhibited in Fig. 4, the conductivity of the suspension is reduced as protons (H+) are consumed by –OH groups until the first equivalence point is reached.
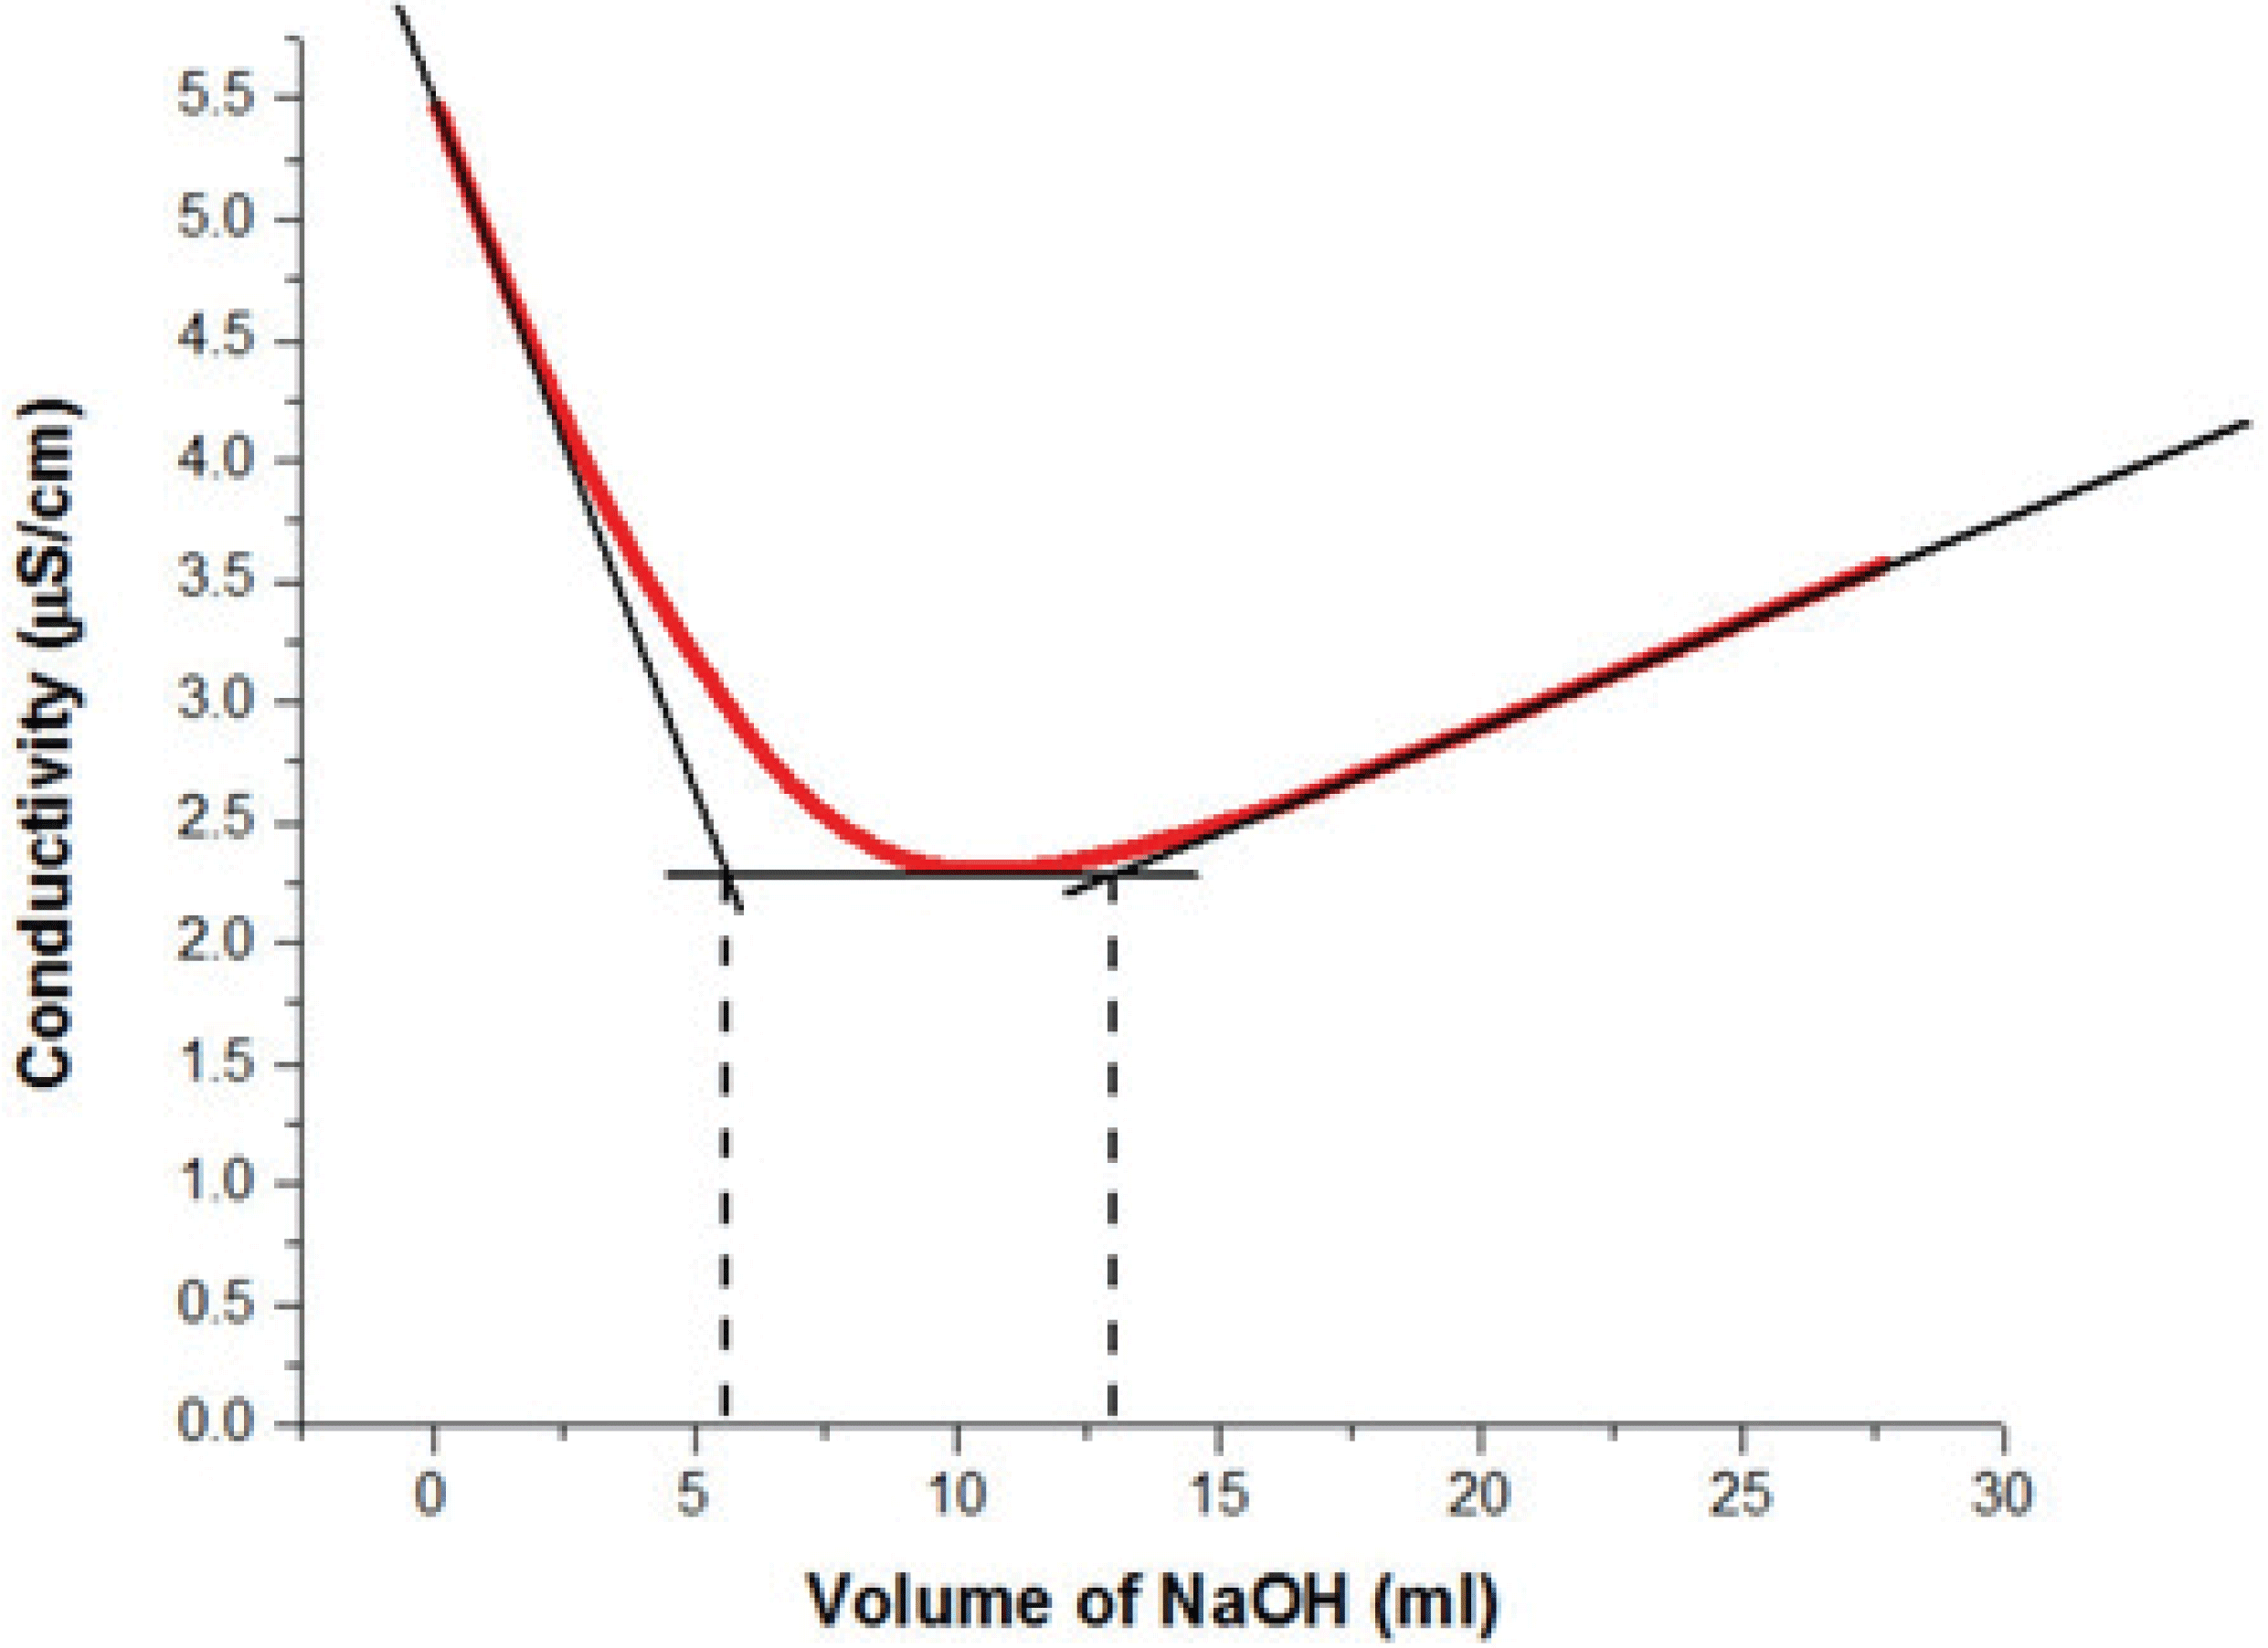
All proton counterions of CNCs have been replaced with Na+ counterions at the equivalence point. When sodium hydroxide added is in excess, the conductivity increases due to the presence of free hydroxyl groups in the suspension. It is worth noting that the slope of the acidic domain is steeper than that of the basic domain because the protons are more conductive than the hydroxyl groups (Foster et al., 2018). For the determination of the degree of oxidation (DO), the carboxylated CNC was subjected to 0.1 M HCl for complete protonation of the carboxyl groups. Then, the resulting carboxylated CNC was titrated with NaOH and the DO value was calculated using the following equation (Eq. (8)):
where C is the concentration of NaOH solution (mol/L); w is the weight of the CNC samples (g); V1 and V2 are the volumes of NaOH (L). The molecular weight of an anhydroglucose unit (AGU) is 162 (g/mol). The molecular weight of an oxidized anhydroglucose unit in the form of sodium salt is 36 (g/mol).
The DO stands for a ratio of the amount of oxidized –OH groups to that of the un-oxidized groups on the anhydroglucose unit (Ye et al., 2018). The DO of CNCs depends not only on the source of cellulose but also on the reaction conditions (temperature, time and concentration of oxidizing agent) (Cheng et al., 2014; Leung et al., 2011). The conductometric titration showed that the carboxylated CNC sample prepared from recycled MDF fibers had the carboxyl content of 0.24 mmol/g and the degree of oxidation of 0.04. This level is lower than the reported ones (Castro-Guerrero and Gray, 2014; Mascheroni et al., 2016). The carboxyl content and DO for cotton was reported as 0.9 mmol/g and 0.13, respectively, by Castro-Guerrero and Gray (2014). According to Mascheroni et al. (2016), the carboxyl group content was 0.98 mmol/g at the reaction temperature of 75°C and the DO was around 0.15. The DO of 0.096 for microcrystalline cellulose was reported by Lam et al. (2013). These results indicate that the carboxyl content and DO of nanomaterials depend on the sources of cellulose and reaction conditions. For example, Oun and Rhim (2017) reported that the DO of 0.24 for chitin nanocrystals, which was greater than the DO of 0.084 from cotton linter and 0.15 from microcrystalline cellulose, respectively, at the same isolation condition.
Fig. 5 shows ATR-FTIR spectra of recycled MDF fibers and carboxylated-CNCs at pH 4 and 7 after the APS oxidation. As expected, the carboxylated CNCs displayed absorption peaks that were characteristic of cellulose. According to Fig. 5a, recycled MDF fibers and carboxylated CNCs are characterized with absorbance peaks in the range 3600–3000 cm-1 assigned to the stretching vibration of hydroxyl groups of cellulose (Cheng et al., 2014; Hu et al., 2014; Oun and Rhim, 2017; Robles et al., 2015; Zhang et al., 2016), the band observed between 3000 and 2800 cm-1 region corresponds to asymmetric and symmetric C-H stretching vibration (Cheng et al., 2014; Goh et al., 2016; Hu et al., 2014; Oun and Rhim, 2017; Zhang et al., 2016). Meanwhile, the peaks present at ~1426, 1367 and 1316 cm-1 in the all spectra are assigned to the symmetric bending of CH2, asymmetric deformations of C–H and the bending vibrations of the C-H and C-O groups of the rings in polysaccharides, respectively (Cheng et al., 2014; Jiang et al., 2017; Oun and Rhim, 2017). Also, the peaks at ~1159, 1106 and 1055 cm-1, are attributed to the asymmetric COC bridge stretching, anhydroglucose ring asymmetric stretching, and COC pyranose ring stretching vibration in cellulose, respectively (Robles et al., 2015). These absorptions become more intense after oxidation by the APS oxidation, indicating the removal of non-cellulosic compounds during the APS oxidation process and an increase in the crystalline cellulose content. The peak observed at ~1032 cm-1 could be assigned to the COC pyranose ring skeletal vibration (El Achaby et al., 2018). Furthermore, the peak observed at 900–895 cm-1 in all spectra could be attributed to the glycosidic bonds related to C1-H deformation vibrations which are symmetric in polysaccharides, represents the β -glucosidic linkage between the anhydroglucose rings in the cellulose chains (El Achaby et al., 2018; Jiang et al., 2017; Liu et al., 2019; Ng et al., 2015; Oun and Rhim, 2017).
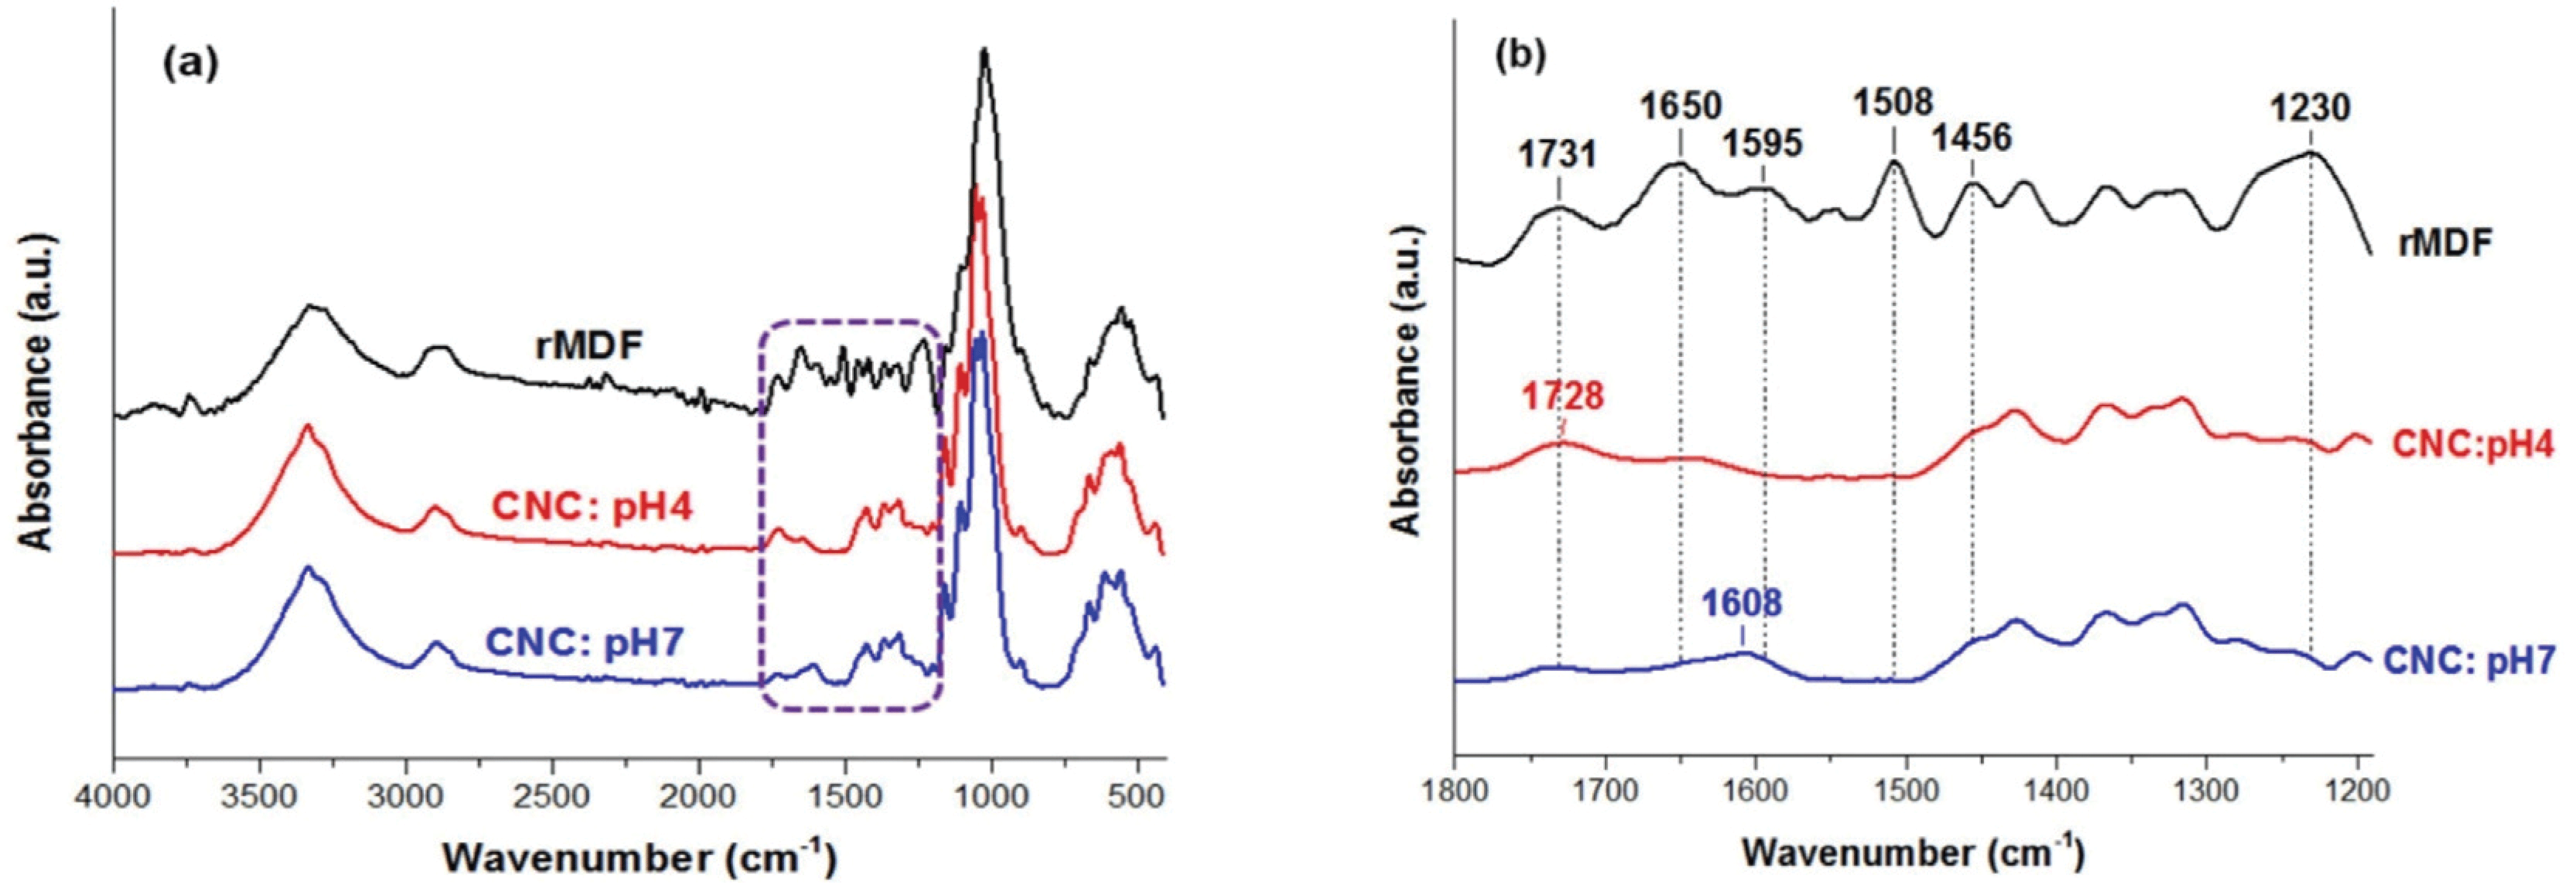
There is no peak in the 2800–2700 cm-1 range, indicating that intermediate aldehyde or ketone oxidation products are absent (Castro-Guerrero and Gray, 2014). According to Fig. 5b, the carbonyl peak at 1731 cm-1 in the recycled MDF fibers attributed to the C=O stretching of the acetyl ester and uronic groups of hemicellulose and the ester linkage of the carboxylic groups of the ferulic and p-coumaric groups in lignin (Fortunati et al., 2016; Goh et al., 2016; Hafemann et al., 2019; Ng et al., 2015). On the other hand, in spectrum of the carboxylated CNCs at pH 4, a new carbonyl peak was observed at ~1728 cm-1, which was attributed to the C=O stretching peak of the carboxyl groups (-COOH), indicating that the functional groups were successfully introduced onto the surface of the prepared CNCs (Cheng et al., 2014; Goh et al., 2016; Liu et al., 2019; Mascheroni et al., 2016; Nascimento et al., 2016; Oun and Rhim, 2017; Ye et al., 2018; Zhang et al., 2016). In the case of the carboxylated CNCs at pH 7, the band shifted to 1608 cm-1, which is responsible for sodium carboxylates (COO–Na+) (Oun and Rhim, 2017). The carboxylated CNCs did not show absorption peaks at 1595, 1508, or 1456 cm-1, which were related to lignin (Goh et al., 2016; Hu et al., 2014; Nascimento et al., 2016). In the recycled MDF fiber spectrum, the peak at ~1508 cm-1 corresponds to the C=C stretching vibration in the aromatic ring of lignin (Goh et al., 2016; Jiang et al., 2017), whereas the absence of this peak in the spectra of CNCs confirm the APS oxidation efficacy in the removing of lignin. The absorbance peaks at 1650 cm-1 and 1230 cm-1 was attributed to the C=C stretching present in lignin components (Ng et al., 2015) and the C=O stretching of hemicellulose, respectively (Fortunati et al., 2016). In the spectra of CNCs, the decrease in the intensity of both bands at 1731 cm-1 and 1230 cm-1 indicates the dissolution or removal of hemicellulose (Hafemann et al., 2019).
4. CONCLUSION
In this study, the carboxylated CNCs were directly isolated from recycled MDF fibers through simple and one-step APS oxidation and the following conclusions can be drawn:
The cellulose content of the recycled MDF fibers was in the range of 40–41%, which makes it a good source of cellulosic material for different industrial uses.
TEM analysis of the resultant CNCs showed a rod-like whisker shape with a length of 100 ~ 295 nm, diameter of 5 ~ 15 nm, and an aspect ratio of around 20.
ATR-IR results confirmed the removal of the non-cellulosic compounds of recycled MDF fibers and also the presence of new bands at ~ 1608 cm-1 and 1728cm-1 for CNCs with pH 4 and 7, respectively.
The use of recycled MDF fibers for the preparation of carboxylated CNCs showed a great potential for their future applications such as nanocomposites, sensors or packaging.


