Journal of the Korean Wood Science and Technology
The Korean Society of Wood Science & Technology
Original Article

Moisture Content Change of Korean Red Pine Logs During Air Drying: II. Prediction of Moisture Content Change of Korean Red Pine Logs under Different Air Drying Conditions

Yeonjung HAN2,, Yoon-Seong CHANG2, Chang-Deuk EOM2, Sang-Min LEE2
2Department of Forest Products, National Institute of Forest Science, 57 Heogi-ro, Dondaemun-gu, Seoul, 02455, Republic of Korea
Corresponding author: Yeonjung HAN (e-mail: yeonjungh@korea.kr, ORCID: 0000-0002-0962-5918)

© The Korean Society of Wood Science & Technology.

Received: Oct 11, 2019; Accepted: Oct 28, 2019

Published Online: Nov 25, 2019

Abstract

Air drying was carried out on 15 Korean red pine logs to provide a prediction model of the moisture content (MC) change in the wood during drying. The final MC was 17.4% after 880 days since the beginning of air drying in the summer for 6 Korean red pine logs with 68.7% initial MC. The final MC was 16.0% after 760 days since the beginning of air drying in the winter for 9 Korean red pine logs with 35.8% initial MC. A regression model with R-squared of 0.925 was obtained as a result of multiple regression analyses with initial MC, top diameter, temperature, relative humidity, and wind speed as independent variable and and MC change during air drying as dependent variable. The initial MC and top diameter, which is the characteristic of Korean red pine, have greater effect on the MC decrease during air drying compared to meteorological factors such as the temperature, relative humidity, and wind speed. Two-dimensional mass transfer analysis was performed to predict the MC distribution of Korean red pine logs during air drying. Two prediction models with different air drying days and different meteorological factors for the determination of the diffusion coefficient and surface emission coefficient were presented. The error between the different two methods ranged from 0.1 to 0.8% and the difference from the measured value ranged from 2.2 to 3.6%. By measuring the internal MC during air drying of Korean pine logs with various initial MC and diameter, and calculating the moisture transfer coefficient in wood for each meteorological condition, the error of the prediction model can be reduced.

Keywords: air drying; moisture content distribution; mass transfer; finite difference method; Korean red pine

1. INTRODUCTION

It is not an easy task to estimate the time for air drying of wood. It is affected by the geopolitical location of the drying facilities, and species and thickness of the wood. In general, small-density species could have a faster drying rate than greater-density species, but changing weather conditions make the results more complicated. The variables involving weather conditions, such as temperature and relative humidity that affect the drying rate, change from year to year. One of the best ways to decide on the weather conditions in a particular area is to use the averages of weather factors across several years (Simpson and Hart, 2000). Wood stacked in spring takes relatively shorter to dry because the drying period is longer, i.e. in spring and summer, whereas wood stacked in late summer or early autumn takes relatively longer to dry because of the longer period of cold days in winter.

Among the studies on air drying, those related to the change of moisture content (MC) and drying time of wood have generally used lumber with a thickness of 50 mm or less. Studies have been conducted in the United States to show the time required for air drying of softwood and hardwood lumbers 25 mm and 50 mm thick up to a target MC of 20% (Rietz and Page, 1971; McMillen and Wengert, 1978). However, the list of time periods for air drying suggested in those studies is limited to the wood stacked in a specific area and at a specific time due to lack of data for calculating the time periods. And the results for species such as hardwoods are not exact (Simpson and Hart, 2000). In these studies, variables such as initial MC, temperature, and relative humidity were put into a regression equation to apply the results obtained in a specific area across the country (Denig and Wengert, 1982). In addition, these studies have developed a numerical analysis model using moisture diffusion coefficients obtained through experiments and suggested a method of changing each coefficient by using weather data from different regions (Hart, 1982). While these studies have presented finite difference methods to analyze heat and mass transfer in arbitrary materials (Holman, 1989), the method was used to conduct one-dimensional analysis (Sutherland et al., 1992) and two-dimensional analysis (Ranta-Maunus, 1994; Perré et al., 1993). There were studies in Korea to predict the MC change during the high temperature drying of Korean red pine timber (Kim et al., 2017) and to predict the temperature distribution during heat treatment of black pine wood (Han et al., 2016). In both of these studies, the finite difference method was used. In those studies, when comparing the predicted and measured values of the MC distribution during wood drying, appropriate choice of diffusion coefficients and surface emission coefficients turned out to be very important (Kamke and Vaneck, 1994). A study on air drying in Korea reported that it took 38 and 84 days for a 25mm thick and 50 mm taun lumber to reach 20% MC, respectively (Jung, 1985) and other studies have analyzed seasonal changes in the rate of air drying of softwood and hardwood lumbers (Lee and Jung, 1989; Jung et al., 1997). One study involving the air drying of timbers and logs measured the time it took for MC to reach 18% for air drying of Korean red pine and Japanese larch (Jung et al., 2003). Another study was carried out to analyze the effect of air drying as a preliminary drying for high temperature and low humidity drying of Korean red pine wood’s large cross section (Lee et al., 2014).

The purpose of this study is to analyze the change of MC during air drying of Korean red pine logs and to suggest air drying time to reach the target. A air drying facility was set up in Seoul, and the weight of logs was measured to evaluate the changes in MC. Then, wood-related data such as initial MC, top diameter, and dry weight of Korean red pine logs and weather data such as temperature, relative humidity, and wind speed were used to conduct two-dimensional moisture transfer analysis, which led to the prediction of MC distribution of wood.

2. MATERIALS and METHODS

2.1. Test materials and air drying of Korean red pine logs

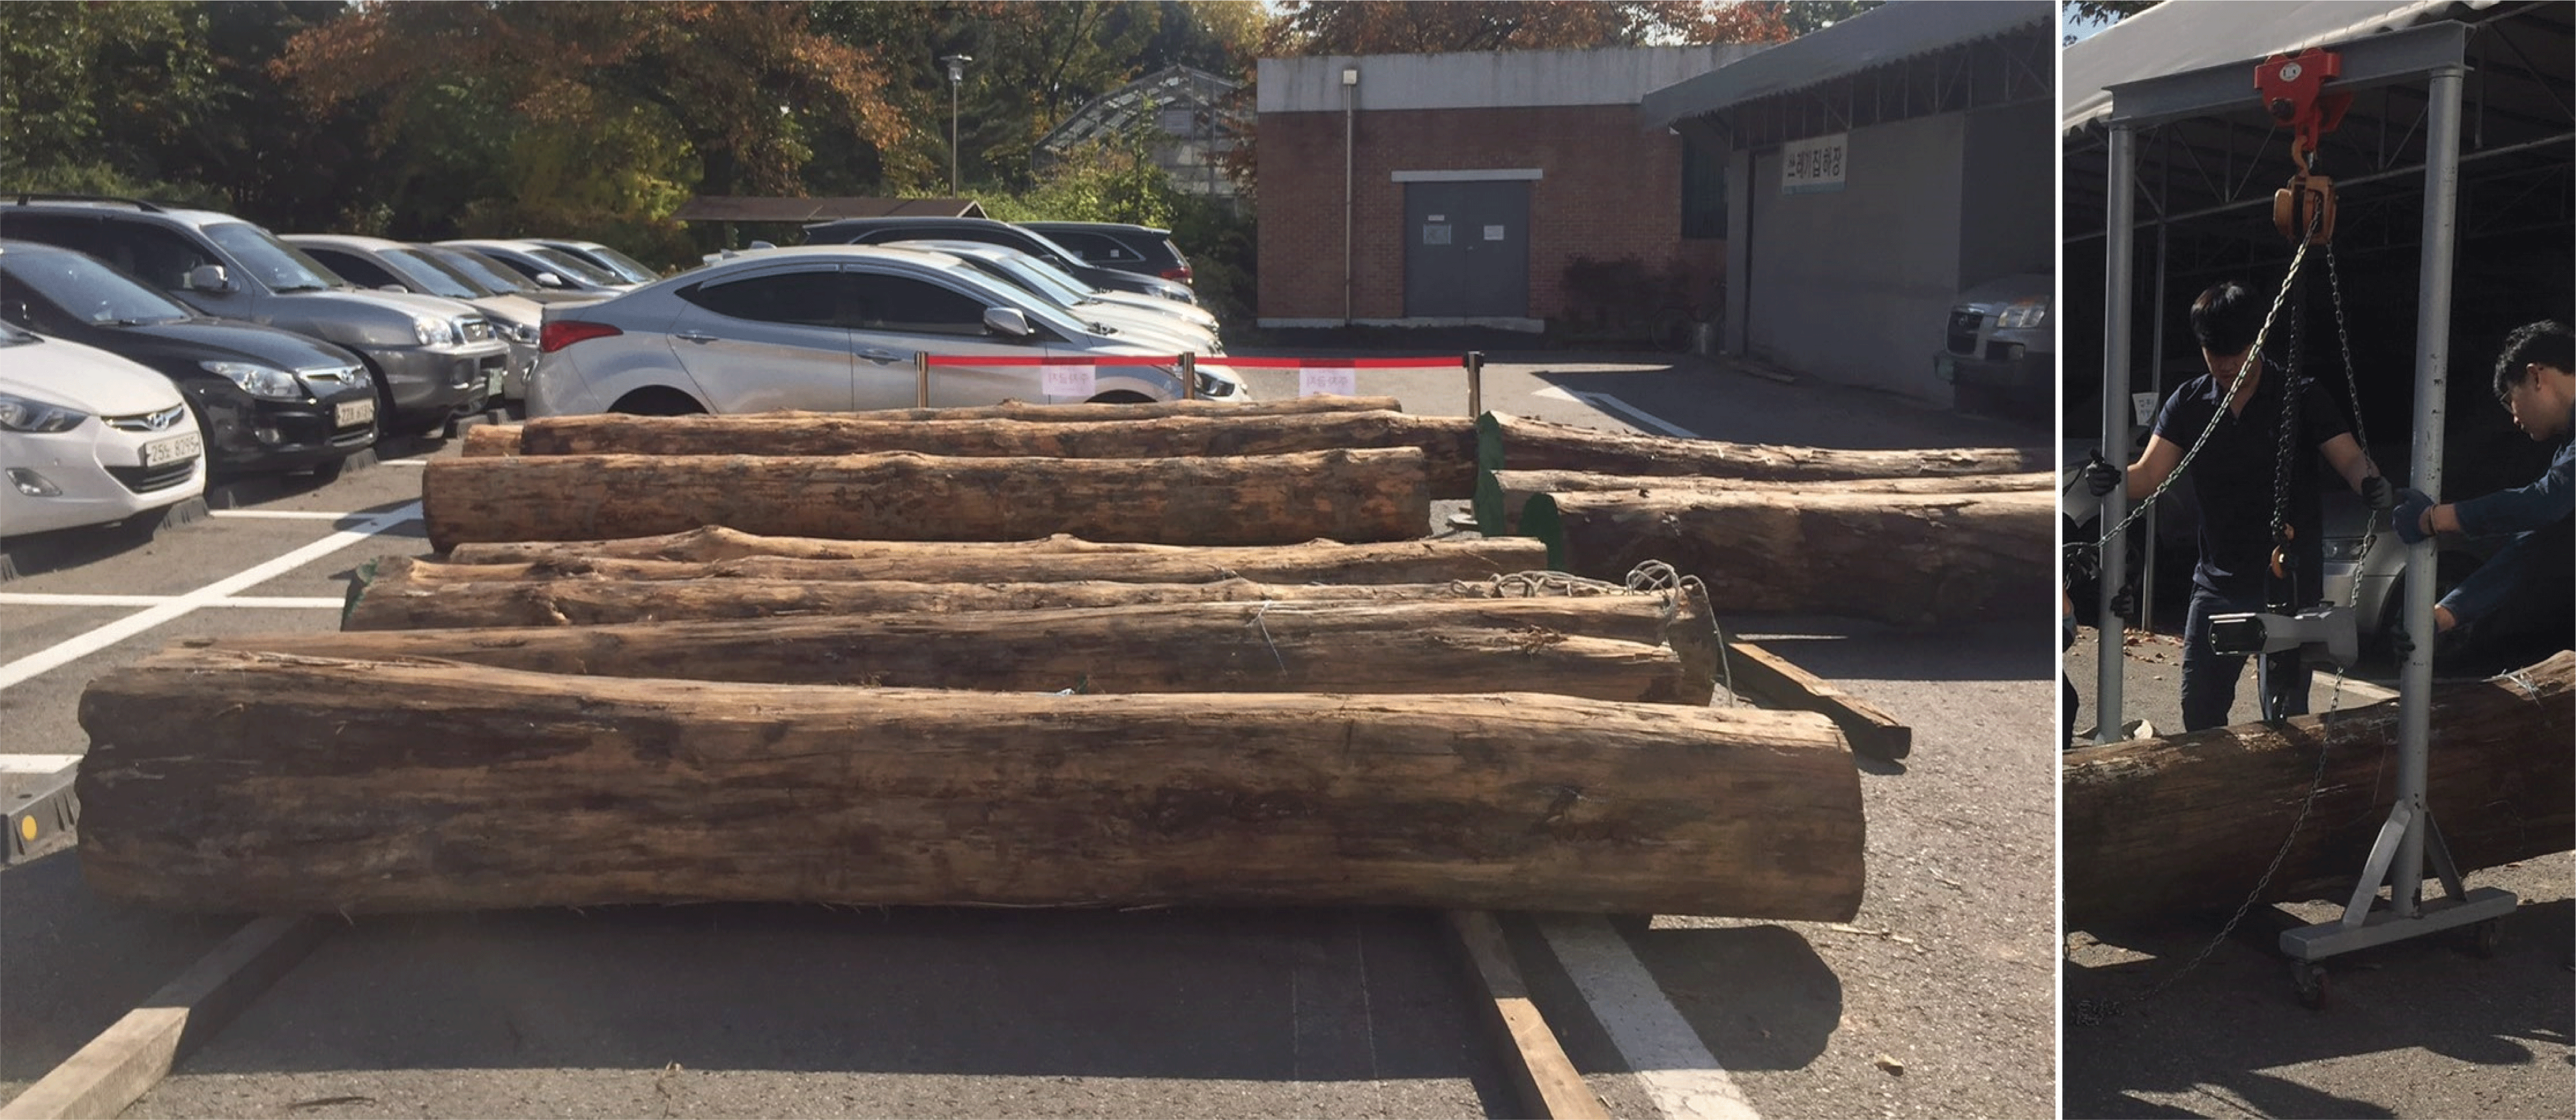
Test species are Korean red pine trees (Pinus densiflora) collected from Uljin-gun, Gyeongsangbukdo and 15 logs with IV-XI age class were cut to 3.6 m in length. The initial MC of the logs measured using increment borer (L 300 mm × ø 10 mm; Haglof, Sweden) ranged from 28% to 83%, and the top diameter ranged from 310 mm to 510 mm. Oven-dry specific gravity was 0.484 (0.30 SD). In Table 1, the Korean red pine logs are classified according the age class and top diameter, initial MC, oven-dry specific gravity, and annual ring width were presented. A air drying facility was temporarily installed in the National Forest Research Institute of Dongdaemun-gu, Seoul. After the bark of the logs was removed for air drying, it was end-coated with urethane-based paint to prevent the drying of cross section. Of the total 15 pine logs, six of them were stacked in early summer (June 2016) and nine were stacked in late autumn (October 2016). During the air drying, the weight of the logs was measured using a hanging scale (W 230 mm × D 370 mm × H 474 mm; 1 ton; CAS, Korea) once every 3 to 6 months (Fig. 1).

Table 1. Physical properties of Korean red pine for air drying
Species Age class Average top-diameter (mm) Total number Initial moisture content (%) Average oven-dry specific gravity Average ring width (mm)
Korean red pine III-IV 339 (46.3 SD1) 5 41.7 (4.4 SD) 0.47 (0.03 SD) 4.6 (0.8 SD)
VI-VII 455 (21.2 SD) 5 49.7 (18.8 SD) 0.50 (0.01 SD) 3.5 (0.5 SD)
IIX-IX 412 (72.3 SD) 5 46.7 (19.9 SD) 0.51 (0.04 SD) 2.6 (0.4 SD)
XI 438 1 83.2 0.52 2.1

Standard deviation

Download Excel Table
wood-47-6-732_F1
Fig. 1. Measurement of the weight variation of Korean red pine logs in air drying
Download Original Figure
2.2. Method of predicting internal moisture content of the Korean red pine logs during air drying
2.2.1. Two-dimensional mass transfer analysis using finite difference method

The governing equation for two-dimensional mass transfer can be shown as Equations (1).

D x 2 C x 2 + D y 2 C y 2 = C t
········· (1)

where, Dx = diffusion coefficient in x-direction (m2/s); Dy = diffusion coefficient in y-direction (m2/s); C = mass concentration (kg/m3); x and y = distance in the direction of flow (m); t = time (s).

If a two-dimensional object is divided and increased in the x- and y-axis directions, the intersection is designed as shown in Fig. 2. In the figure, m is the increment along the x-axis direction, n is the increment along the y-axis direction, and the concentration gradient can be expressed as Equations (2)-(4).

wood-47-6-732_F2
Fig. 2. Sketch illustrating nomenclature used in 2-dimensional numerical analysis: (a) interior node, (b) convective boundary node, (c) exterior corner node with convective boundary
Download Original Figure
C x m + 1 2 , n C m + 1 , n C m , n Δ x
········· (2)
C x m 1 2 , n C m , n C m 1 , n Δ x
········· (3)
C y m , n + 1 2 C m , n + 1 C m , n Δ y
········· (4)
C y m , n 1 2 C m , n C m , n 1 Δ y
········· (5)

where, m and n = increment in the x- and y- direction.

The second partial derivative of the inner nodal point (m, n) of the log shown in Fig. 2 (a) can be expressed by equations (6) and (7).

2 C x 2 m , n C x m + 1 2 , n C x m 1 2 , n Δ x C m + 1 , n + C m 1 , n 2 C m , n Δ x 2
········· (6)
2 C y 2 m , n C y m , n + 1 2 C y m , n 1 2 Δ y C m , n + 1 + C m , n 1 2 C m , n Δ y 2
········· (7)

The change in concentration per unit time at nodal point (m, n) can be expressed as equation (8) using time increment p.

C t C m , n p + 1 C m , n p Δ t
········· (8)

where, p = time increment.

Equation (8) can be summarized in the form of finite difference as equation (9). Similarly, the outer surface undergoing convection (Fig. 2 (b)) and the corner node (Fig. 2 (c)) can be expressed as Equations (10) and (11), respectively.

D x C m + 1 , n + C m 1 , n 2 C m , n Δ x 2 + D y C m , n + 1 + C m , n 1 2 C m , n Δ y 2 = C m , n p + 1 C m , n p Δ t
········ (9)
D x Δ y C m 1 , n p + 1 C m , n p + 1 Δ x + D y Δ x 2 C m , n 1 p + 1 C m , n p + 1 Δ y + D y Δ x 2 C m , n + 1 p + 1 C m , n p + 1 Δ y + S Δ y C e C m , n p + 1 = Δ x Δ y 2 C m , n p + 1 C m , n p Δ t
········ (10)
D x Δ y 2 C m 1 , n p + 1 C m , n p + 1 Δ x + D y Δ x 2 C m , n + 1 p + 1 C m , n p + 1 Δ y + S Δ x 2 C e C m , n p + 1 + S Δ y 2 C e C m , n p + 1 = Δ x Δ y 4 C m , n p + 1 C m , n p Δ t
········ (11)

where, S = surface emission coefficient (m/s); e = equilibrium state.

Mass transfer in arbitrary materials using the finite difference method is described in detail in Hollman (1989).

2.2.2. Determination of diffusion and surface emission coefficients for Korean red pine logs

Two variables are needed for the analysis of mass transfer using finite difference method. One is the diffusion coefficient, which is the rate of moisture movement inside the wood, and the other is the surface emission coefficient, which is the rate of moisture movement from the surface of the wood to the atmosphere. Diffusion coefficients were determined using a moisture transfer model (Siau, 1995) created with a simplified cell model. Diffusion coefficient DT in the transverse direction and diffusion coefficient DL in the longitudinal direction can be expressed as Equations (12) and (13).

D T = 1 1 a 2 D BT D V D BT + D V 1 a
········ (12)

where, DT = transverse bound water diffusion coefficient of wood (m2/s); DBT= transverse bound water diffusion coefficient of cell wall (m2/s) = 7 × 10⁻⁶ exp[ -(38500 - 290M) / RT]; M = moisture content (%); R = universal gas constant (8.314 J/mol K); T = temperature (K); DV= water vapor diffusion coefficient of air in the lumens based on the concentration of bound water in the cell wall (m2/s) = Da × ∂Ca / ∂Cw = (0.018 Dap0 / GMw ρwRT) × (∂H / ∂M); Da = coefficient of interdiffusion of water vapor in bulk air (m2/s); Ca = concentration of water vapor in the lumen in equilibrium with the cell wall (kg/m3); Cw= concentration of bound water in the cell wall in equilibrium with the air in the lumens (kg/m3); p0 = saturated vapor pressure (Pa); GMw = specific gravity of the cell wall at moisture content M; ρw = normal density of water (kg/m3); ∂H / ∂M = slope of the sorption isotherm; a = diameter of lumens = square root of porosity.

D L = a 2 1 a 2 D V D BL D BL + 0.01 1 a D V
········ (13)

where, DL = longitudinal bound water diffusion coefficient of wood (m2/s); DBL= diffusion coefficient of the cell wall in the longitudinal direction (m2/s) = 2.5 × DBT.

The surface emission coefficient was determined by equation (14) using the method of conversion from the convective mass transfer coefficient (Yeo and Smith, 2005).

S = h p p s p e G SMC ρ w SMC 100 G EMC ρ w EMC 100
········ (14)

where, S = surface emission coefficient (m/s); hp = convective mass transfer coefficient based on the potential of water vapor pressure (kg/m2sPa) = J / (ps - pe); J = moisture flux from surface to air (kg/m2s); ps = water vapor pressure in air adjacent to the wood surface (Pa); pe= water vapor pressure in ambient air at the dry-bulb temperature (Pa); SMC and EMC = surface and equilibrium moisture content (%); GSMC and GEMC = specific gravities of wood based on oven-dry weight and volume at SMC and EMC.

In this study, monthly average temperature, relative humidity, and wind speed in the Seoul area where the air drying facility was installed were used to determine diffusion coefficients and surface emission coefficients. The data from the Korea Meteorological Administration (http://data.kma.go.kr) surveyed in a previous study (Han et al., 2019) can be used to obtain average monthly temperature and relative humidity. Since the average monthly wind speed is very large compared to the flow of air through the stacked logs, the former needs to be adjusted arbitrarily. To calculate wind speed values, 25% of the weather data was applied, as used in the prediction of drying rates for six species in North America (Hart, 1982). For the weather data from June 2016 to October 2018, the transversal diffusion coefficient is ranged from 3.48 × 10⁻¹¹ to 1.55 × 10⁻¹⁰ m2/s, and the longitudinal diffusion coefficient is ranged from 1.88 × 10⁻¹⁰ to 1.64 × 10⁻¹⁹ m2/s and surface emission coefficients ranged from 3.80 × 10⁻⁷ to 1.60 × 10⁻⁶ m/s.

Changes in MC of Korean red pine logs during air drying were calculated in two ways. One is to apply the diffusion coefficient and surface emission coefficient of each month to the actual days from January to December. The other is to apply the diffusion coefficient and surface emission coefficient of summer (June-August) to the effective air drying days calculated for each month.

3. RESULTS and DISCUSSION

3.1. Changes in moisture content of Korean red pine logs during air drying

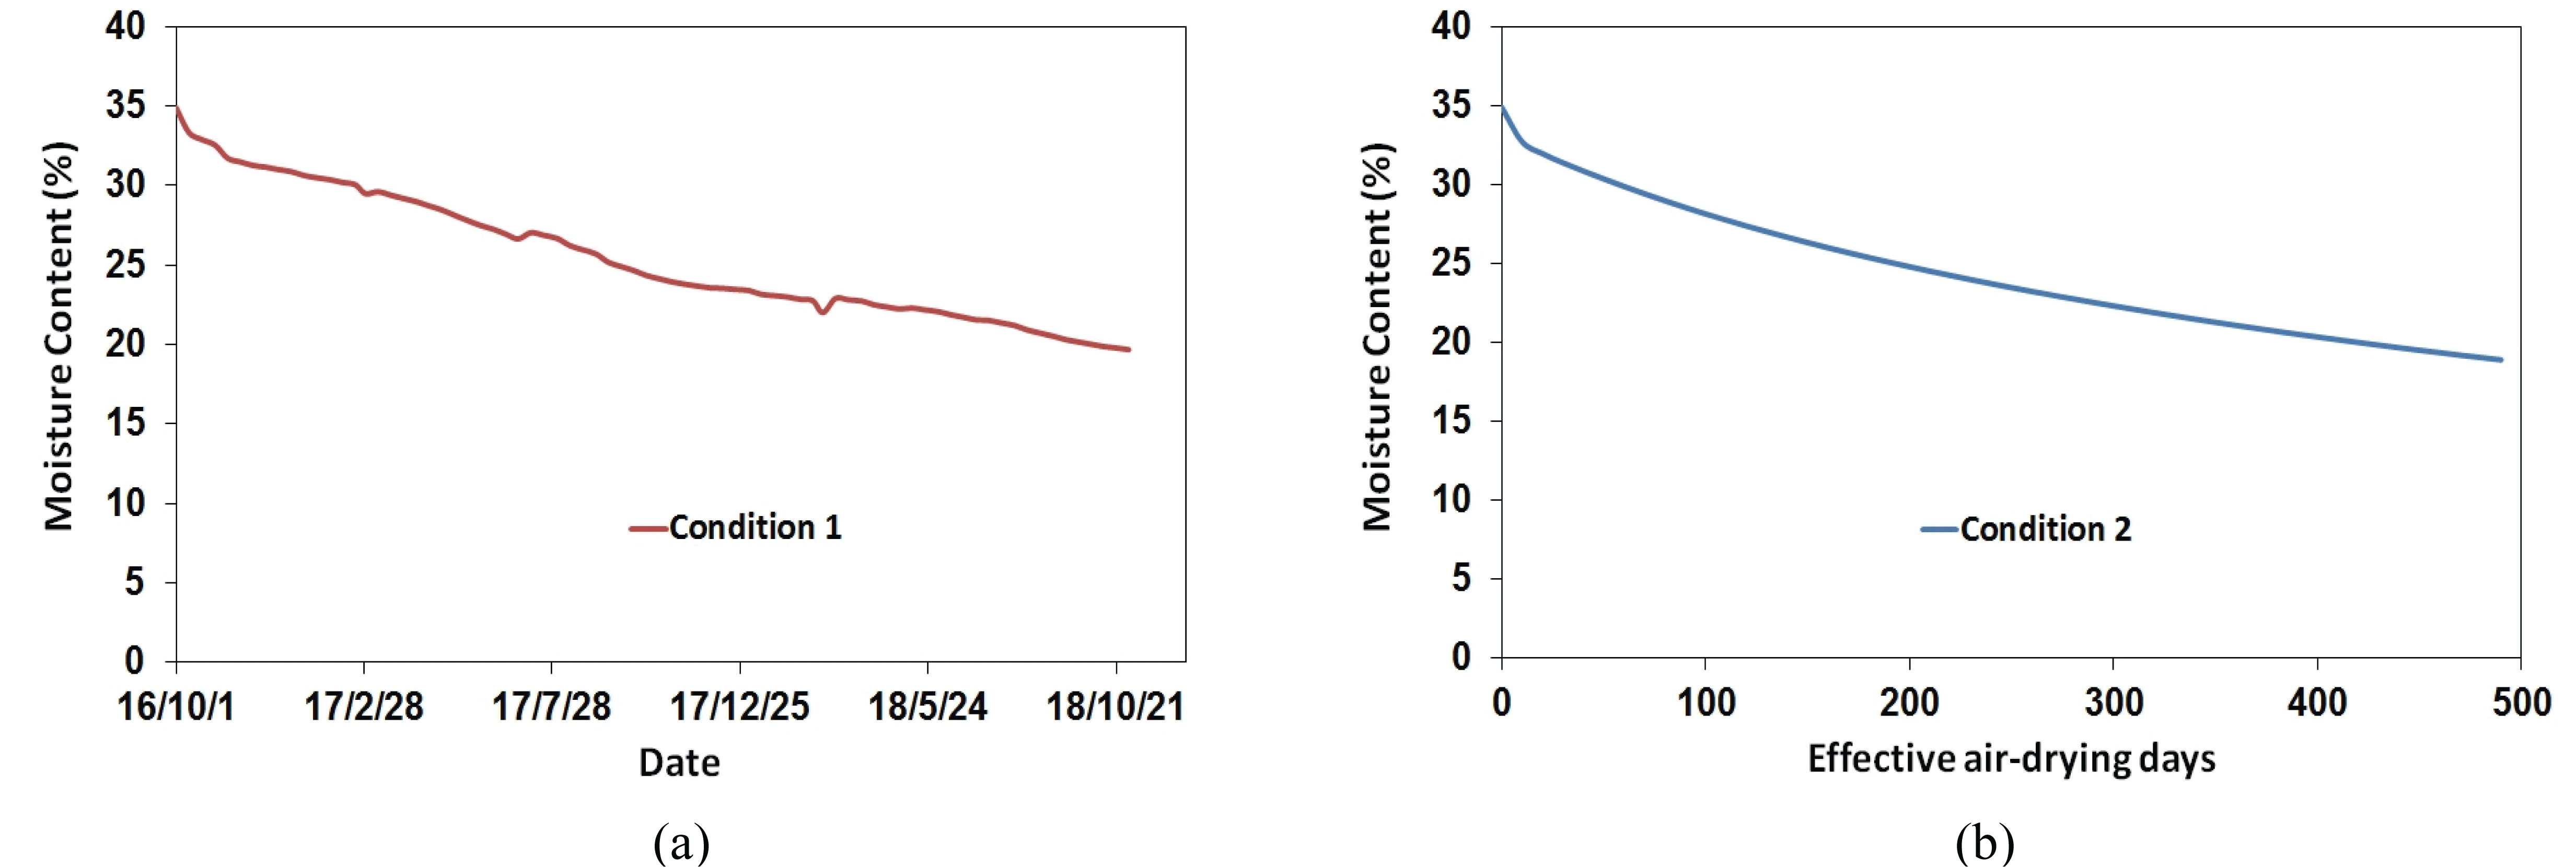
Figs. 3(a) and 3(b) show changes in MC during air drying. One is for six Korean red pine logs, which started drying in the summer (June 2016), and continued for about 880 days. The other is for nine Korean red pine logs, which began drying in autumn (October 2016) and continued for about 760 days. As for the former, the initial MC was 68.7% (± 8.9), the final MC was 17.4% (± 4.0), while they were 35.8% (± 6.3) and 16.0% (± 3.1), respectively, for the latter. Since air drying was started in different seasons, the initial MC of the two conditions were different, making it difficult to make a direct comparison.

wood-47-6-732_F3
Fig. 3. Moisture content change of Korean red pine logs that began to air-drying in summer (a) and autumn (b).
Download Original Figure

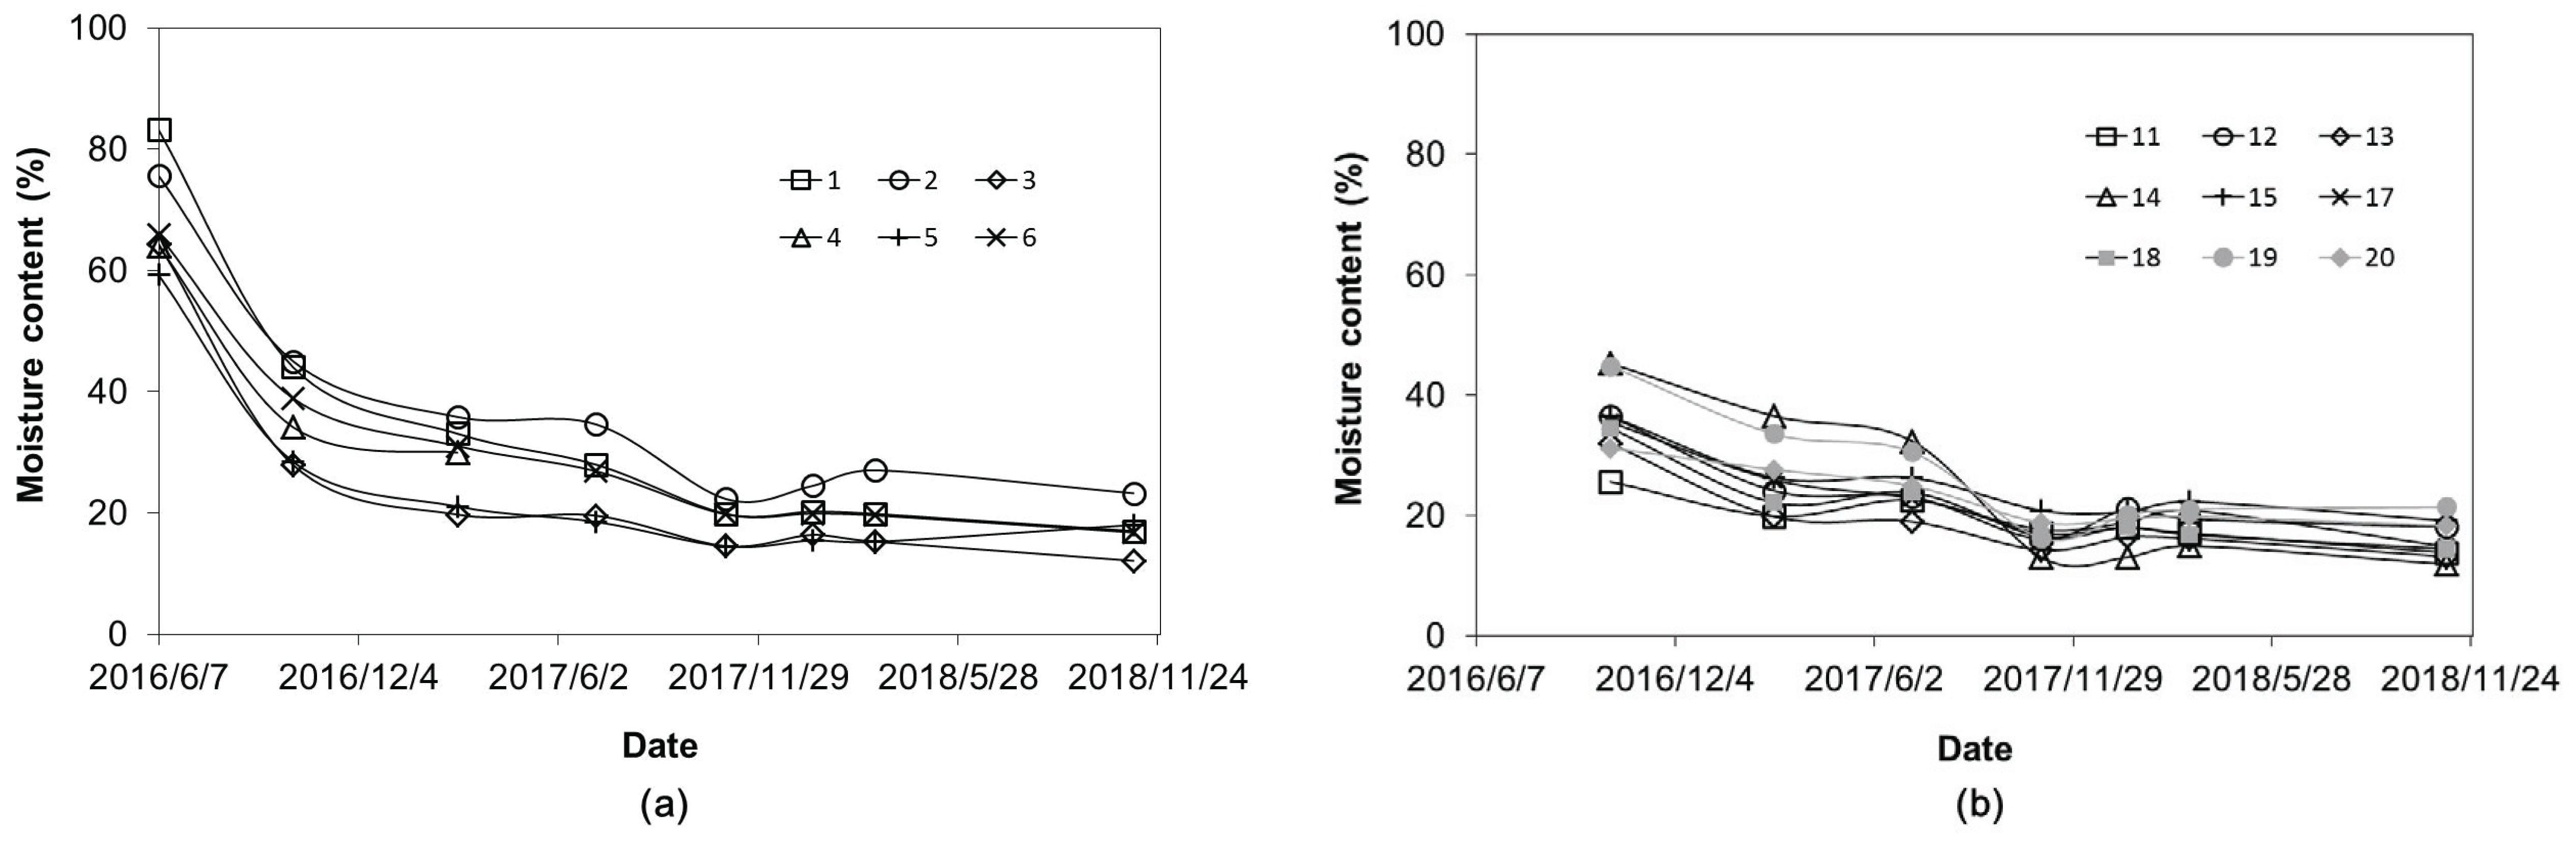
In Figs. 3(a), the average drying rates of six logs are shown after air drying began; 0.267%/day in summer (June-October 16), 0.054%/day in winter (October 16-March-17), 0.024%/day in spring (March 17-July), 0.063%/day in summer (July-October 17), ‒0.009%/day in winter (October 17-Mar March 18), and 0.008%/day in spring and summer (March‒November 18), showing differences according to seasons. In Fig. 3(b), the average drying rates of 9 logs are shown after air drying began; 0.076%/day in winter (October 16-March 17), ‒0.005%/day in spring (March 17-July), summer (July 17-October) 0.071%/day, winter season (October 17-March 18) ‒0.015%/day, spring and summer (March 18-November 18), 0.011%/day. The drying rates of 2 conditions showed the highest value at the beginning of drying when the MC of logs were higher than the fiber saturation point, and the drying rates gradually decreased as time passed. In artificial drying, the drying speed gradually slows down as the MC decreases, whereas in air drying, there is a big difference in drying speed between summer and winter, which seems to be due to the difference in weather conditions for each season. In spring and winter, after the MC of the test specimen decreased below the fiber saturation point, drying of the test specimen did not continue and there was almost no MC decrease and in the summer, the MC tended to decrease.

3.2. Prediction of changes in moisture content of Korean red pine logs during air drying
3.2.1. Regression analysis on air dyring test results

Table 2 shows the MC decreased during air drying according to top diameter, temperature, relative humidity, and wind speed. The MC of logs was measured from October 2016 to October 2017, with a measurement interval of 117 to 148 days (average 128 days). Temperature, relative humidity, and wind speed values are the averages over four months in the Seoul areas. The tendency was, the higher initial MC, smaller top diameter, and higher temperature, the higher the decrease in MC during air drying of Korean red pine logs.

Table 2. MC loss during air-drying for Korean red pine with various initial MC, diameter, temperature, relative humidity, and wind speed conditions
Initial MC (%) Diameter (mm) Temperature (°C) Relative humidity (%) Wind speed (m/s) MC loss (%)
Above FSP 39.3 309 4.4 57.4 2.2 12.7
39.6 320 4.4 57.4 2.2 18.6
39.3 408 4.4 57.4 2.2 10.5
48.3 319 4.4 57.4 2.2 20.4
33.6 319 22.8 66.3 2.1 14.7
60.1 432 25.2 66.3 2.1 35.5
64.0 432 25.2 66.3 2.1 29.8
34.1 432 4.4 57.4 2.2 4.2
65.8 475 25.2 66.3 2.1 26.9
38.9 475 4.4 57.4 2.2 7.9
31.0 475 15.8 52.3 2.5 4.2
31.1 47. 4.4 57.4 2.2 9.3
75.6 513 25.2 66.3 2.1 30.6
45.0 513 4.4 57.4 2.2 9.2
35.8 513 15.8 52.3 2.5 1.2
34.6 513 22.8 66.3 2.1 12.3
59.2 385 25.2 66.3 2.1 30.8
34.4 395 4.4 57.4 2.2 12.3
30.2 320 4.4 57.7 2.2 12.0
33.8 447 15.8 52.3 2.5 6.6
83.2 438 25.2 66.3 2.1 39.1
44.0 438 4.4 57.4 2.2 11.0
33.1 438 15.8 52.3 2.5 5.1
Below FSP 26.7 309 15.8 52.3 2.5 1.0
25.6 309 22.8 66.3 2.1 7.2
27.2 320 22.8 66.3 2.1 18.6
28.9 408 22.8 66.3 2.1 5.6
24.6 432 4.4 57.4 2.2 8.0
16.6 432 15.8 52.3 2.5 0.2
16.4 432 22.8 66.3 2.1 4.9
26.9 475 22.8 66.3 2.1 7.1
24.5 460 22.8 66.3 2.1 5.6
21.8 473 15.8 52.3 2.5 2.9
18.9 473 22.8 66.3 2.1 5.0
28.4 385 4.4 57.4 2.2 7.4
21.1 385 15.8 52.3 2.5 2.5
18.5 385 22.8 66.3 2.1 4.1
22.1 395 15.8 52.3 2.5 0.9
21.2 395 22.8 66.3 2.1 4.8
19.8 320 22.8 66.3 2.1 7.4
27.2 447 22.8 66.3 2.1 6.2
28.0 438 22.8 66.3 2.1 8.1
Download Excel Table

Multiple regression was run on initial MC, top diameter, temperature, relative humidity, wind speed, and MC reduction during air drying of Korean red pine logs and the results are shown in Table 3. The regression model is Y = 0.350 × X1 ‒ 0.030 × X2 ‒ 1.38 × X3 + 8.84 × X4 + 272 × X5 ‒ 1100, and the coefficient of determination (R-squared) is 0.925, which indicates that prediction of the dependent variable by the independent variables can be done with 92.5% accuracy. Since the P-value ranges from 1.17 × 10⁻⁵ to 3.25 × 10⁻³, which is smaller than 0.05, the criterion for 95% statistical confidence, the regression model can be said to be adequate. The P-value for each independent variable increased in the order of initial MC, top diameter, relative humidity, wind speed, and temperature. This indicates that the initial MC and top diameter of logs have a greater effect on the MC reduction during air drying than the relative humidity, wind speed, and temperature, which are weather conditions.

Table 3. Multiple regression analysis on initial MC, diameter, temperature relative humidity, wind speed, and MC loss during air-drying
Dependent variable Independent variable R-squared Adjusted R-squared Constant t-statistic P-value
MC loss during air-drying Y-intercept 0.925 0.914 -1100 -3.21 2.27 × 10⁻³
Initial MC (X1) 0.350 5.08 1.17 × 10⁻⁵
Diameter (X2) -0.030 -3.95 3.51 × 10⁻⁴
Temperature (X3) -1.38 -3.05 4.23 × 10⁻³
Relative humidity (X4) 8.84 3.31 2.16 × 10⁻³
Wind speed (X5) 272 3.15 3.25 × 10⁻³
Download Excel Table

Multiple regression was run with three independent variables, initial MC, top diameter, and temperature of Korean red pine logs and one dependent variable, MC decrease during air drying. The results are shown in Table 4. There are two reasons for choosing only three independent variables. First, as shown in the results of Table 3, the properties of wood have a large effect on air drying. Second, temperature among the weather conditions has a larger variation during the measurement period. Under this condition, the regression model was Y = 0.573 × X1 ‒ 0.036 × X2 + 0.218 × X3 and the coefficient of determination was 0.874. The results showed that the coefficient of determination decreased compared to the case of five independent variables in Table 3, but the range of P-value was 4.72 × 10⁻¹⁸ to 3.05 × 10⁻³, which was statistically significant.

Table 4. Multiple regression analysis on initial MC, diameter, temperature and MC loss during air-drying
Dependent variable Independent variable R-squared Adjusted R-squared Constant t-statistic P-value
MC loss during air-drying Y-intercept 0.874 0.863 2.54 0.656 0.516
Initial MC (X1) 0.573 15.5 4.72 × 10⁻¹⁸
Diameter (X2) -0.036 -3.88 4.05 × 10⁻⁴
Temperature (X3) 0.218 -3.17 3.05 × 10⁻³
Download Excel Table
3.2.2. The prediction of moisture content change during air drying using the diffusion coefficient and surface emission coefficient of wood

Two-dimensional mass transfer analysis was used to predict changes in MC of Korean red pine logs during air drying. Two methods were used to determine the drying duration, diffusion coefficient, and surface emission coefficient that are associated with prediction of MC change. The first method is to apply the actual days from January to December of the year and the average weather conditions for each month to the calculation of diffusion coefficients and surface emission coefficients. The second method is to apply the effective air drying days of each month and weather conditions in the summer (June to August) to the calculation of diffusion coefficients and surface emission coefficients. To predict the changes in MC, the dimension and MC of two logs, whose internal MC during air drying was measured, were applied to the moisture transfer analysis model.

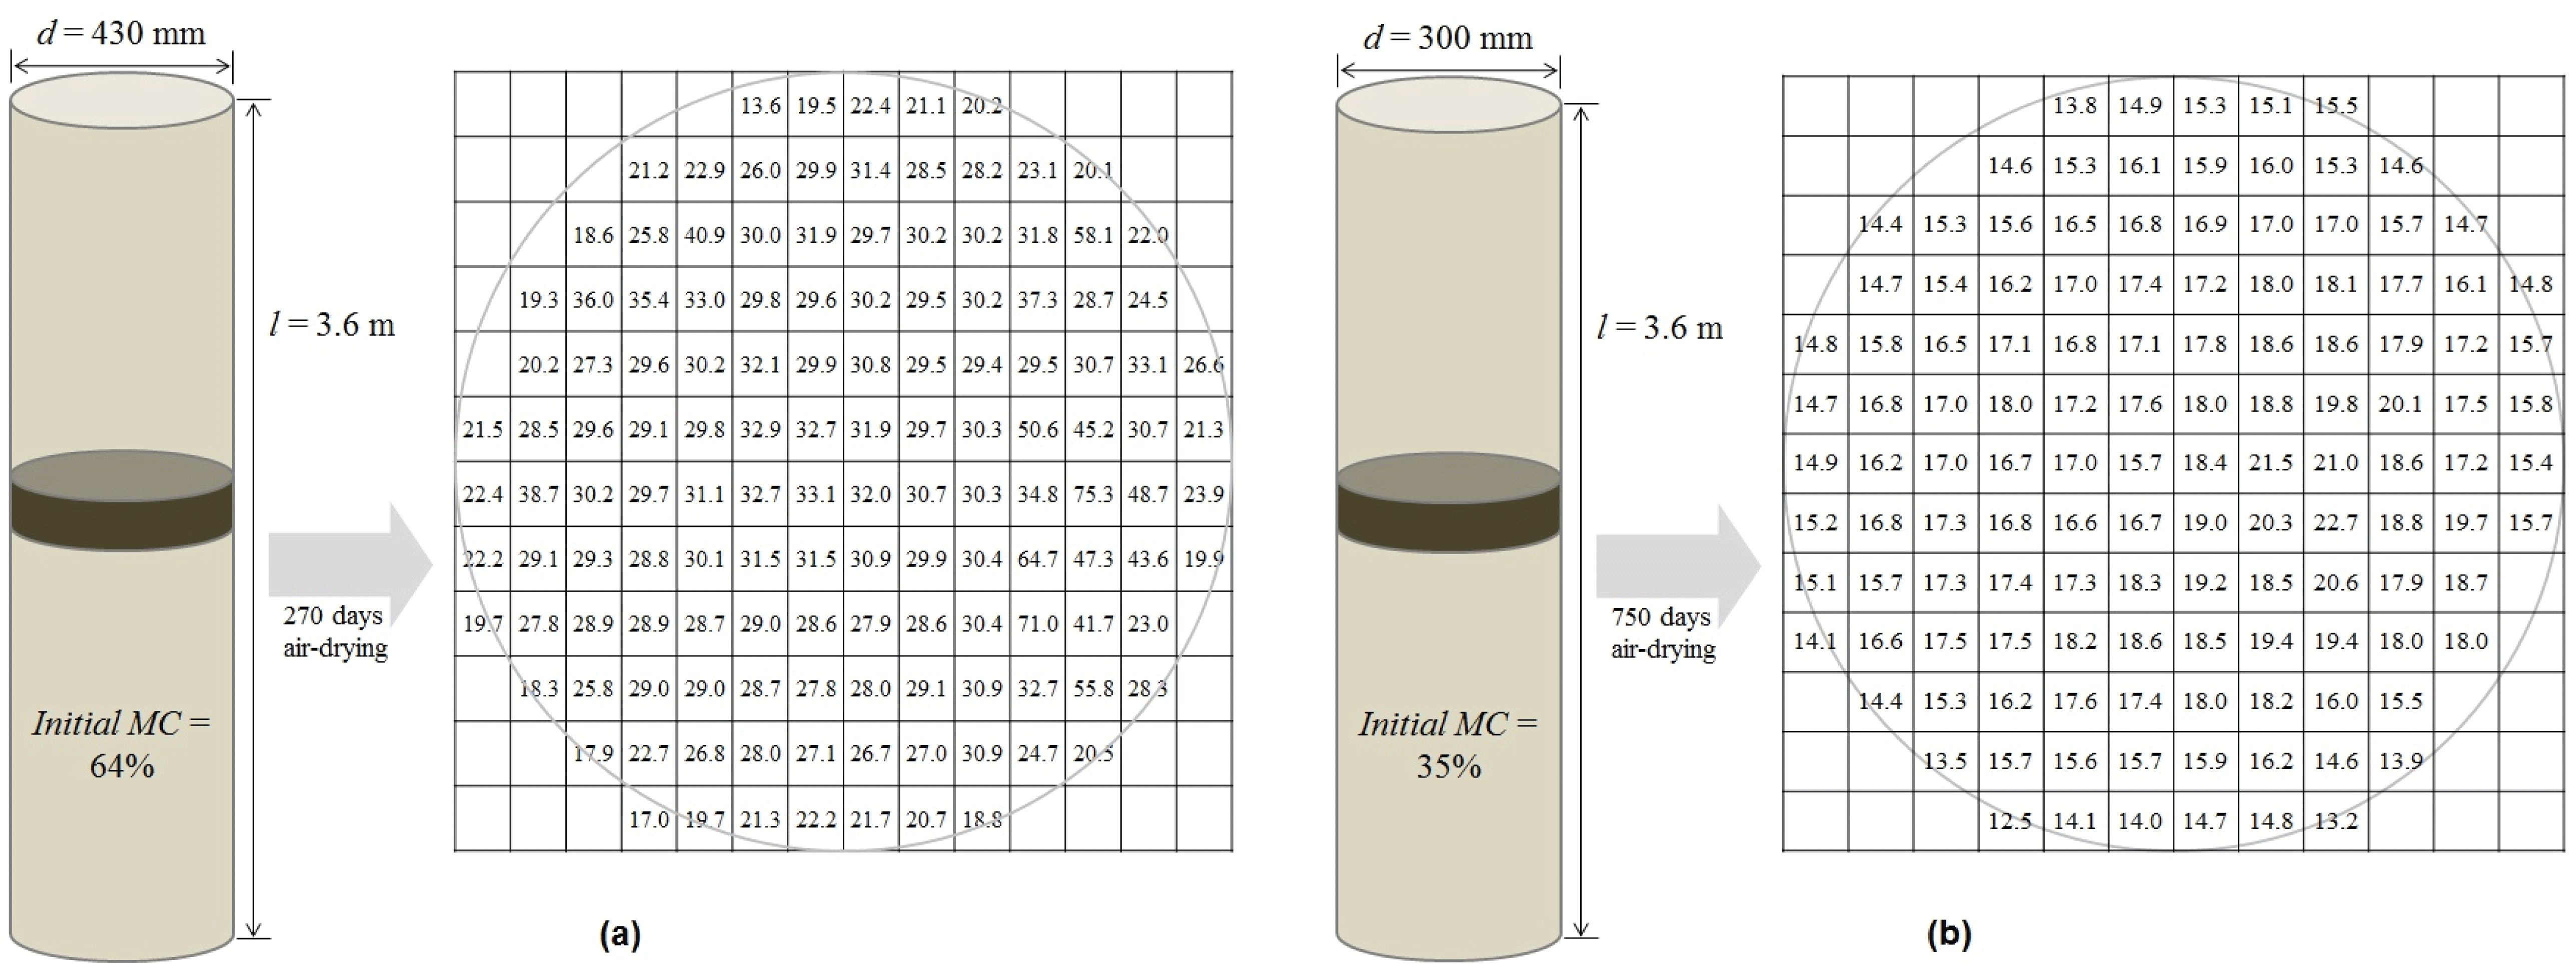
Fig. 4 shows the predicted changes in MC of the Korean red pine logs that were air-dired with an initial MC of 64%, a top diameter of 430 mm and a length of 3.6 m for 270 days from June 2016 to March 2017. Fig. 4(a) shows the results of actual air drying days and monthly average weather conditions, whereas Fig. 4(b) shows the results of using the effective air drying days of 190 days and weather conditions in summer.

wood-47-6-732_F4
Fig. 4. Predicted moisture content change of Korean red pine log with 64% of initial MC (430 mm-diameter × 3.6 m-length) during air-drying: (a) condition 1; application of diffusion coefficient (D) and surface emission coefficient (S) calculated from monthly average temperature (T) and relative humidity (RH) during actual air-drying, (b) condition 2; application of D and S calculated from average T and RH in summer.
Download Original Figure

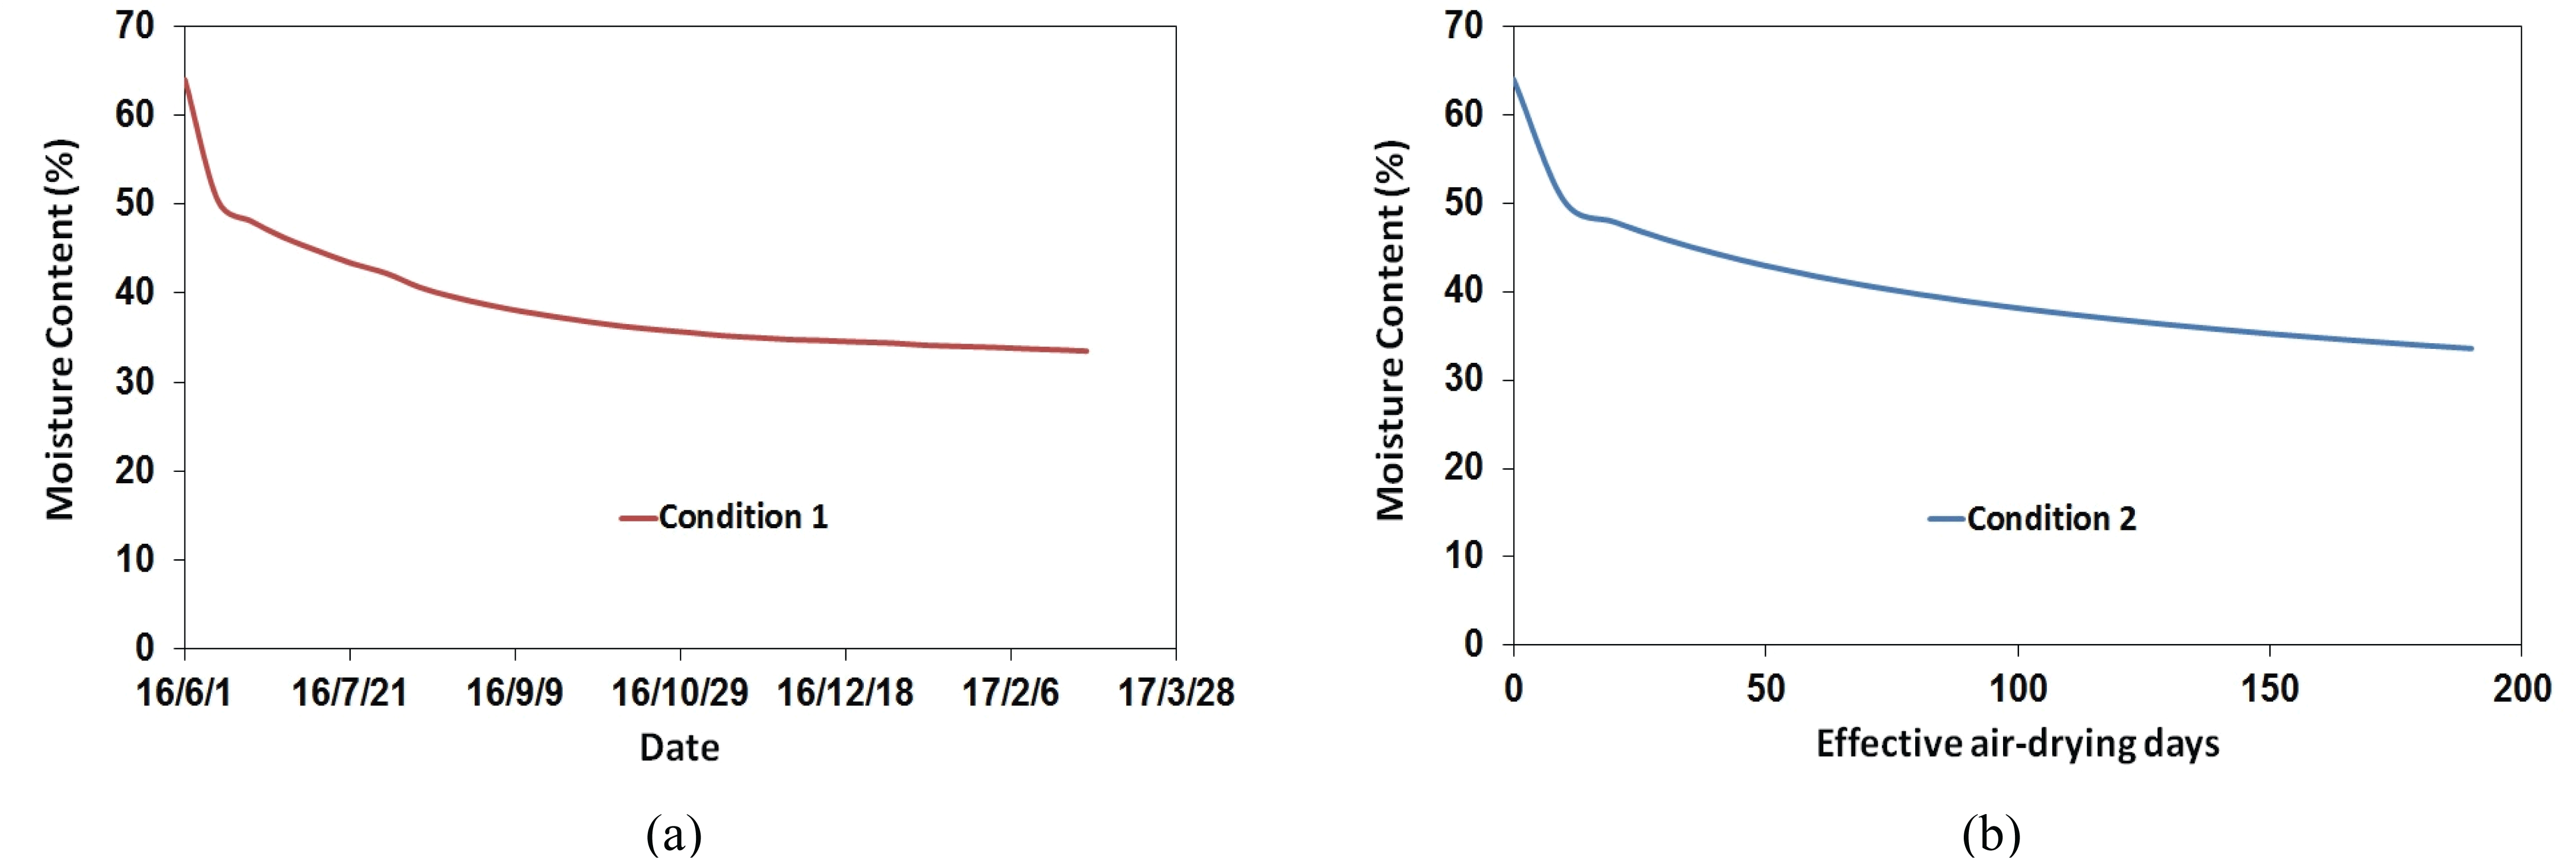
In Fig. 4(a), the MC of Korean red pine log was predicted to be 38.7% after 90 days of actual air drying, 34.8% after 180 days, and 33.5% after 270 days. In Fig. 4(b), the MC of logs was predicted to be 38.9% after 90 days of effective air drying, 34.8% after 160 days, and 33.6% after 190 days. The two methods of predicting the internal MC of the wood during air drying had an error of 0.1%. By applying the same prediction model during the same drying period to the data with MC range below the fiber saturation point, Korean red pine log with 35% initial MC, 300 mm top diameter and 3.6 m length that were dried for 750 days from October 2016 to October 2018 were used to predict changes in MC for air drying. As shown in Fig. 4, Fig. 5(a) shows the results of the actual air drying days and monthly average weather conditions, whereas Fig. 5(b) shows the results of effective air drying days of 490 days and weather conditions in summer.

As shown in Fig. 5(a), the MC of Korean red pine log was predicted to be 29.5% after 150 days of air drying, 26.7% after 300 days, 23.4% after 450 days, 22.1% after 600 days, and 19.7% after 750 days. As shown in Fig. 4(b), the MC of log was estimated to be 26.3% after 150 days of effective air drying, 22.3% after 300 days, and 18.9% after 490 days. The two methods of predicting the internal MC of log during air drying had an error of 0.8%. The reason for the large error compared to that of the prediction of MC change above fiber saturation point (Fig. 4) is as follows. When the average weather conditions for each month were applied, the MC of Korean red pine log increased in March, July, and April 2018, as shown in Fig. 5(a). However, when summer weather conditions were applied, as shown in Fig. 5(b), the MC decreases constantly. To verify the prediction model of MC changes measured under two conditions during air drying of Korean red pine logs, the internal MC of two different condition of logs was presented. One is the log with 64% initial MC, 430 mm in top diameter and 3.6 m in length that was dried for 270 days from June 2016 to March 2017 (Fig. 6(a)), and the other one is the log with 35% initial MC, 300 mm in top diameter and 3.6 m in length that was dried for 750 days from October 2016 to October 2018 (Fig. 6(b)). The average MC of test samples collected in the middle of 3.6m of pine logs was 30.0% and 16.7%, respectively. The difference in MC changes between measured and predicted values ranged from 3.5% to 3.6% above the fiber saturation point and 2.2 to 3.0% below the fiber saturation point. It means that about 3% error between the measured and predicted MC change takes about 120-140 air-drying days for log with 20% MC.

wood-47-6-732_F5
Fig. 5. Predicted moisture content change of Korean red pine log with 35% of initial MC (300 mm-diameter × 3.6 m-length) during air-drying: (a) condition 1; application of diffusion coefficient (D) and surface emission coefficient (S) calculated from monthly average temperature (T) and relative humidity (RH) during actual air-drying, (b) condition 2; application of D and S calculated from average T and RH in summer.
Download Original Figure
wood-47-6-732_F6
Fig. 6. Moisture content distribution of Korean red pine log during air-drying: (a) log with 64% of initial MC (430 mm-diameter × 3.6 m-length) during 270 days air-drying, (b) log with 35% of initial MC (300 mm-diameter × 3.6 m-length) during 750 days air-drying.
Download Original Figure

One of the ways to reduce the error rates in the prediction model seems to be measuring the internal MC during air drying of woods with various initial MCs and top diameters, and calculating the moisture transfer coefficient in wood for each weather condition.

4. CONCLUSION

In this study, Korean red pine logs were air-dried to analyze the changes in internal MC of wood during air drying. Multiple regression was run on air drying test results for 15 logs with weather variables. In order to predict the changes in internal MC during air drying of Korean red pine logs, we used moisture diffusion coefficients and surface emission coefficients calculated based on effective air drying days along with weather data from Seoul. This led to the following conclusions.

  1. The test subjects were six Korean red pine logs for which drying started in summer and continued for about 880 days and nine logs for which drying started in autumn and continued for about 760 days. Their average final MC was 17.4% and 16.0%, respectively. The drying rate was the fastest at MC above the fiber saturation point after the start of drying, and then gradually decreased. Due to the difference in the initial MC, it was not possible to directly compare the drying rates according to season. However, it was confirmed that drying did not continue at a MC below the fiber saturation point in spring and winter.

  2. Multiple regression was run and the dependent variable was the reduced MC during air drying, while the independent variables included the initial MC, top diameter, temperature, relative humidity and wind speed of pine logs. The regression model was “reduced MC (%) = 0.350 × initial MC (%) ‒ 0.030 × top diameter (mm) ‒ 1.38 × temperature (°C) + 8.84 × relative humidity (%) + 272 × wind speed (m/s) ‒ 1100” with a coefficient of determination of 0.925. Regression analysis showed that the initial MC and top diameter of the Korean red pine logs had a greater effect on MC reduction during air drying than the weather conditions such as temperature, relative humidity and wind speed.

  3. Two-dimensional mass transfer analysis was used to predict the MC distribution and its changes during air drying. Two different methods of analysis were used; one was to apply the actual drying days and the average weather conditions for each month, and the other to apply the effective air drying days and summer weather conditions. The errors in the two methods ranged from 0.1 to 0.8% and the difference in the measured values ranged from 2.2 to 3.6%.

Two methods are available to possibly reduce the error rate of the prediction model. One is to measure the internal MC of Korean red pine logs with variety of initial MCs and top diameter during air drying, and the other is to calculate the moisture transfer coefficient in wood for each weather condition.

Appendices

APPENDIX (Korean Version)
소나무 원목의 천연건조 중 함수율 변화: II. 소나무 원목의 천연건조 중 함수율 변화 예측

초록 : 천연건조 중 목재의 함수율 변화 예측모형을 제시하기 위하여 15본의 소나무 원목에 대한 천연건조를 수행하였다. 초기함수율이 68.7%인 6본의 소나무 원목에 대하여 여름철에 천연건조를 시작한 후 약 880일이 경과한 후의 최종함수율은 17.4%이었다. 초기함수율이 35.8%인 9본의 소나무 원목에 대하여 겨울철에 천연건조를 시작한 후 약 760일이 경과한 후의 최종함수율은 16.0%이었다. 소나무 원목의 말구지름, 온도, 상대습도, 풍속을 독립변수로 결정하고, 천연건조 중 감소한 함수율 을 종속변수로 다중회귀분석을 진행한 결과, 결정계수 0.925의 회귀모형을 얻을 수 있었다. 소나무 원목의 특성인 초기함수율과 말구지름이 기상조건인 온도, 상대습도, 풍속에 비하여 천연건조 중 함수율 감소에 미치는 영향이 더 크게 나타났다. 천연건조 중 내부함수율의 분포 및 함수율 변화를 예측하기 위하여 2차원 물질전달 해석을 수행하였다. 건조일수를 서로 다르게 적용하고, 수분확산계수 및 표면방사계수를 결정하는 기상조건을 다르게 적용한 2가지의 예측모형을 제시하였다. 2가지 적용 방법의 오차는 0.1 ‒ 0.8%의 범위였으며, 측정값과의 차이는 2.2 ‒ 3.6%의 범위였다. 다양한 초기함수율과 말구지름의 소나무 원목에 대한 천연건조 중 내부함수율을 측정하고, 각각의 기상조건에 대한 목재 내 수분이동계수를 산출하면 예측모형의 오차를 감소시 킬 수 있을 것으로 판단된다.

1. 서 론

목재의 천연건조(air drying; natural drying)에 소요되는 시간을 예측하는 것은 쉽지 않다. 천연건조 소요시간은 천연건조장의 지정학적 위치, 건조수종 및 두께 등의 영향을 받는다. 일반적으로 밀도가 작은 수종은 큰 수종에 비하여 건조속도가 빠르다고 할 수 있지만 기상조건의 변화를 고려하면 이러한 결과는 보다 복잡해진다. 건조속도에 영향을 미치는 온도와 상대습도 등의 기상인자는 해마다 변화한다. 특정지역의 기상조건을 결정하기 위한 최선의 방법은 수 년간의 기상인자에 대한 평균값을 활용하 는 것이다(Simpson and Hart, 2000). 봄철에 잔적된 목재는 건조기간 중 봄철과 여름철의 비율이 크기 때문에 상대적으로 빨리 건조되지만 반대로 늦여름 또는 초가을에 잔적된 목재는 겨울철의 비율이 크기 때문에 건조의 소요시간이 길어진다.

천연건조 중 목재의 함수율 변화 및 건조시간과 관련된 연구는 일반적으로 두께 50 mm 이하의 제재목에 대하여 수행되었다. 미국에서 두께 25 mm와 50 mm의 침엽수와 활엽수를 목표인 함수율 20%까지 천연건조시 소요되는 시간을 제시하기 위한 연구들이 수행되었다(Rietz and Page, 1971; McMillen and Wengert, 1978). 그러나 연구를 통해 제시된 천연건조 소요시간의 목록은 소요시간을 산정하기 위한 데이터의 부족으로 특정지역에서 특정시기에 잔적된 목재로 한정되고, 활엽수 등 수종에 대한 결과는 정밀하지 못하다(Simpson and Hart, 2000). 특정지역에서 얻어진 결과를 전국적으로 확대시키기 위하여 초기함수 율, 온도, 상대습도를 활용하여 수종별 회귀식을 제시하는 연구가 수행되었으며(Denig and Wengert, 1982), 실험을 통해 얻어진 수분확산계수 등을 적용한 수치해석 모델을 개발하고, 각각의 계수를 다른 지역의 기상자료를 통하여 변화시키는 방법이 제시되 었다(Hart, 1982). 임의의 재료 내 열전달과 물질전달을 분석하기 위하여 유한차분법이 제시되었으며(Holman, 1989), 유한차분 법을 이용하여 목재내부의 함수율 분포에 대한 1차원 해석(Sutherland et al., 1992)과 2차원 해석(Ranta-Maunus, 1994; Perré et al., 1993)이 수행되었다. 국내에서는 소나무 대단면재의 고온건조 중 함수율 변화를 예측(Kim et al. 2017)하고, 곰솔 원목의 열처리 중 온도분포를 예측(Han et al. 2016)하기 위하여 유한차분법이 사용되었다. 이 과정에서 목재건조 중 함수율 분포의 예측값과 실측값을 비교한 결과 확산계수와 표면방사계수의 적절한 선택이 매우 중요하였다(Kamke and Vaneck, 1994).

국내의 침엽수와 활엽수 제재목의 천연건조에 대한 연구에서 남양재 중 두께 25 mm와 50 mm의 타운(taun) 제재목이 함수율 20%에 도달하는데 각각 38일과 84일이 소요됨이 보고되었으며(Jung, 1985), 활엽수와 침엽수 제재목의 천연건조 속도변 화가 계절별로 분석되었다(Lee and Jung, 1989; Jung et al., 1997). 대단면재와 원목의 천연건조와 관련된 연구에서 소나무와 일본잎갈나무의 천연건조 시 함수율 18%에 도달하는데 소요되는 시간이 측정되었으며(Jung et al., 2003), 잣나무 대단면재의 고온저습건조를 위한 예비건조로써 천연건조의 효과를 분석한 연구가 수행되었다(Lee et al., 2014).

본 연구는 소나무 원목의 천연건조 중 함수율 변화를 분석하고, 목표에 도달하는 천연건조소요시간을 제시하기 위하여 수행되 었다. 서울 지역에 천연건조장을 설치하고, 소나무 원목의 천연건조 중 무게측정을 통해 함수율 변화를 평가하였다. 소나무 원목의 초기함수율, 말구지름, 전건비중 등의 목재관련 자료와 온도, 상대습도, 풍속 등의 기상관련 자료를 적용한 2차원 물질전 달 해석을 통해 원목의 내부함수율 분포를 예측하였다.

2. 재료 및 방법
2.1. 공시재료 및 소나무 원목의 천연건조

공시수종은 경상북도 울진군에서 벌채된 소나무(Pinus densiflora)이고, IV ‒ XI영급인 15본의 소나무 원목을 길이 3.6 m로 제재하였다. 생장추(L 300 mm × ø 10 mm; Haglof, Sweden)를 이용하여 측정된 원목의 초기함수율은 28 ‒ 83%의 범위이고, 말구지름은 310 ‒ 510 mm의 범위였다. 전건비중은 0.484 (0.30 SD)이었다. Table 1에 영급을 기준으로 소나무 원목을 구분하고, 말구지름, 초기함수율, 전건비중, 연륜폭을 제시하였다.

천연건조장은 서울특별시 동대문구 국립산림과학원 내에 간이로 설치하였으며, 천연건조를 위하여 소나무 원목의 수피를 제거한 후 횡단면 건조를 방지하기 위하여 우레탄 계열의 페인트로 엔드코팅을 실시하였다. 총 15본의 소나무 원목 중 6본은 초여름(2016년 6월)에 잔적한 후 건조를 시작하였으며, 9본은 늦가을(2016년 10월)에 잔적한 후 건조를 시작하였다. 천연건조 중 약 3‒6개월에 한번씩 매달림저울(W 230 mm × D 370 mm × H 474 mm; 1 ton; CAS, Korea)을 활용하여 원목의 무게를 측정하였다(Figure 1).

2.2. 천연건조 중 소나무 원목의 내부함수율 변화 예측 방법
2.2.1. 유한차분법을 이용한 2차원 물질전달 해석

2차원 물질전달에 대한 지배방정식은 식 (1)과 같이 표현할 수 있다.

D x 2 C x 2 + D y 2 C y 2 = C t
········· (1)

where, Dx = diffusion coefficient in x-direction (m2/s); Dy = diffusion coefficient in y-direction (m2/s); C = mass concentration (kg/m3); x and y = distance in the direction of flow (m); t = time (s).

2차원 물체가 x축과 y축 방향의 증분으로 분할되는 경우, 교점은 Fig. 2와 같이 설계된다. 그림에서 mx축 방향의 증분, ny축 방향의 증분을 의미하며, 농도경사는 식 (2) ‒ (4)와 같이 표현할 수 있다.

C x m + 1 2 , n C m + 1 , n C m , n Δ x
········· (2)
C x m 1 2 , n C m , n C m 1 , n Δ x
········· (3)
C y m , n + 1 2 C m , n + 1 C m , n Δ y
········· (4)
C y m , n 1 2 C m , n C m , n 1 Δ y
········· (5)

where, m and n = increment in the x- and y- direction.

Fig. 2(a)와 같은 목재의 내측절점 (m, n)에서 2차 부분도함수를 표현하면 식 (6)과 (7)로 표현할 수 있다.

2 C x 2 m , n C x m + 1 2 , n C x m 1 2 , n Δ x C m + 1 , n + C m 1 , n 2 C m , n Δ x 2
········· (6)
2 C y 2 m , n C y m , n + 1 2 C y m , n 1 2 Δ y C m , n + 1 + C m , n 1 2 C m , n Δ y 2
········· (7)

The change in concentration per unit time at nodal point (m, n) can be expressed as equation (8) using time increment p.

C t C m , n p + 1 C m , n p Δ t
········· (8)

where, p = time increment.

식 (8)을 유한차분의 형태로 정리하면 식 (9)와 같다. 이와 동일한 방법으로 대류를 겪는 외부표면(Fig. 2(b))과 모서리절점 (Fig. 2(c))은 각각 식 (10)과 (1)로 표현할 수 있다.

D x C m + 1 , n + C m 1 , n 2 C m , n Δ x 2 + D y C m , n + 1 + C m , n 1 2 C m , n Δ y 2 = C m , n p + 1 C m , n p Δ t
········ (9)
D x Δ y C m 1 , n p + 1 C m , n p + 1 Δ x + D y Δ x 2 C m , n 1 p + 1 C m , n p + 1 Δ y + D y Δ x 2 C m , n + 1 p + 1 C m , n p + 1 Δ y + S Δ y C e C m , n p + 1 = Δ x Δ y 2 C m , n p + 1 C m , n p Δ t
········ (10)
D x Δ y 2 C m 1 , n p + 1 C m , n p + 1 Δ x + D y Δ x 2 C m , n + 1 p + 1 C m , n p + 1 Δ y + S Δ x 2 C e C m , n p + 1 + S Δ y 2 C e C m , n p + 1 = Δ x Δ y 4 C m , n p + 1 C m , n p Δ t
········ (11)

where, S = surface emission coefficient (m/s); e = equilibrium state.

유한차분법을 이용한 임의의 재료내의 물질전달에 대한 보다 자세한 설명은 Hollman (1989)에 의해 제시되어 있다.

2.2.2. 소나무 원목의 확산계수 및 표면방사계수의 결정

유한차분법을 이용한 물질전달 해석을 위하여 목재내부의 수분이동률인 확산계수와 목재표면에서 대기로의 수분이동률인 표면방사계수의 결정이 필요하다. 확산계수는 단순화한 세포모형을 이용하여 만들어진 수분이동 모형(Siau, 1995)을 이용하여 결정하였다. 횡단방향의 확산계수 DT와 섬유방향의 확산계수 DL은 식 (12)와 (13)과 같이 표현할 수 있다.

D T = 1 1 a 2 D BT D V D BT + D V 1 a
········ (12)

where, DT = transverse bound water diffusion coefficient of wood (m2/s); DBT= transverse bound water diffusion coefficient of cell wall (m2/s) = 7 × 10⁻⁶ exp[ -(38500 - 290M) / RT]; M = moisture content (%); R = universal gas constant (8.314 J/mol K); T = temperature (K); DV= water vapor diffusion coefficient of air in the lumens based on the concentration of bound water in the cell wall (m2/s) = Da × ∂Ca / ∂Cw = (0.018 Dap0 / GMw ρwRT) × (∂H / ∂M); Da = coefficient of interdiffusion of water vapor in bulk air (m2/s); Ca = concentration of water vapor in the lumen in equilibrium with the cell wall (kg/m3); Cw= concentration of bound water in the cell wall in equilibrium with the air in the lumens (kg/m3); p0 = saturated vapor pressure (Pa); GMw = specific gravity of the cell wall at moisture content M; ρw = normal density of water (kg/m3); ∂H / ∂M = slope of the sorption isotherm; a = diameter of lumens = square root of porosity.

D L = a 2 1 a 2 D V D BL D BL + 0.01 1 a D V
········ (13)

where, DL = longitudinal bound water diffusion coefficient of wood (m2/s); DBL= diffusion coefficient of the cell wall in the longitudinal direction (m2/s) = 2.5 × DBT.

표면방사계수는 대류물질전달계수(convective mass transfer coefficient)로부터 전환시키는 방법(Yeo and Smith, 2005)을 이용하여 식 (14)와 같이 결정하였다.

S = h p p s p e G SMC ρ w SMC 100 G EMC ρ w EMC 100
········ (14)

where, S = surface emission coefficient (m/s); hp = convective mass transfer coefficient based on the potential of water vapor pressure (kg/m2sPa) = J / (ps - pe); J = moisture flux from surface to air (kg/m2s); ps = water vapor pressure in air adjacent to the wood surface (Pa); pe= water vapor pressure in ambient air at the dry-bulb temperature (Pa); SMC and EMC = surface and equilibrium moisture content (%); GSMC and GEMC = specific gravities of wood based on oven-dry weight and volume at SMC and EMC.

본 연구에서는 천연건조장이 설치된 서울지역의 월평균 온도, 상대습도, 풍속을 적용하여 확산계수와 표면방사계수를 결정하였다. 월평균 온도와 상대습도는 선행연구(Han et al., 2019)에서 조사된 기상청 국가기후데이터센터(Korea Meteorological Administration; http://data.kma.go.kr)의 자료를 원형대로 이용할 수 있는 반면에, 월평균 풍속은 잔적된 원목을 지나는 공기의 흐름에 비하여 매우 큰 값으로 임의의 조정이 필요하다. 풍속의 값은 북미지역 6수종에 대한 건조속도 예측에 이용된 것(Hart, 1982)과 같이 기상데이터의 25%를 적용하였다. 2016년 6월부터 2018년 10월까지의 기상자료를 통해 얻어진 횡단방향 확산계수는 3.48 × 10⁻¹¹‒1.55×10⁻¹⁰m2/s, 섬유방향 확산계수는 1.88 × 10⁻¹⁰‒1.64×10⁻⁹m2/s, 표면방사 계수는 3.80 × 10⁻⁷‒1.60×10⁻⁶m/s의 범위였다.

천연건조 중 소나무 원목의 함수율 변화는 1월 ‒ 12월까지의 실제일수에 각 달의 확산계수와 표면방사계수를 적용하는 방식과 각 달별로 산출된 유효천연건조일수에 여름철(6월 ‒ 8월)의 확산계수와 표면방사계수를 적용하는 2가지의 방식으로 산출하였다.

3. 결과 및 고찰
3.1. 소나무 원목의 천연건조 중 함수율 변화

여름철(2016년 6월)에 건조를 시작하여 약 880일이 경과한 6본의 소나무 원목과 가을철(2016년 10월)에 건조를 시작하여 약 760일이 경과한 9본의 소나무 원목에 대한 천연건조 중 함수율 변화를 Fig. 3(a)와 (b)에 제시하였다. 여름철에 건조를 시작한 6본의 소나무 원목의 초기함수율은 68.7% (±8.9)이고 최종함수율은 17.4%(±4.0), 겨울철에 건조를 시작한 9본의 소나무 원목의 초기함수율은 35.8%(±6.3)이고 최종함수율은 16.0%(±3.1)이었다. 계절변화에 따른 건조속도의 차이를 분석하기 위하여 서로 다른 계절에 천연건조를 시작하였으나 2조건의 초기함수율의 차이로 직접적인 비교는 어려웠다.

Fig. 3(a)에서 6본의 소나무 원목의 평균 건조속도는 천연건조가 시작된 후 여름철(´16년 6월‒10월)에 0.267 %/day, 겨울철 (´16년 10월‒´17년 3월)에 0.054 %/day, 봄철(´17년 3월‒7월)에 0.024 %/day, 여름철(´17년 7월‒10월)에 0.063 %/day, 겨울철 (´17년 10월‒´18년 3월)에 ‒0.009 %/day, 봄·여름(´18년 3월‒´18년 11월)에 0.008 %/day로 계절에 따라 변화하였다. Fig. 3(b)에 서 9본의 소나무 원목의 평균 건조속도는 건조 시작 후 겨울철(´16년 10월‒´17년 3월)에 0.076 %/day, 봄철(´17년 3월‒7월)에 ‒0.005 %/day, 여름철(´17년 7월‒10월)에 0.071 %/day, 겨울철(´17년 10월‒´18년 3월)에 ‒0.015 %/day, 봄·여름(´18년 3월‒´18 년 11월)에 0.011 %/day이었다. 2조건의 건조속도는 시험재의 함수율이 섬유포화점 이상인 건조초기에 제일 큰 값을 나타내었으 며, 건조가 진행됨에 따라 점차 건조속도가 감소하였다. 인공건조에서 건조속도가 함수율의 감소에 따라 점차 느려지는 것과 달리 천연건조는 각 계절별 기상조건의 차이로 여름철과 겨울철의 건조속도에서 차이가 큰 것으로 판단된다. 시험재의 함수율이 섬유포화점 이하로 감소한 후, 봄철과 겨울철에는 시험재의 건조가 진행되지 않아 함수율 감소가 거의 없었으며 여름철에 함수율이 감소하는 경향을 나타냈다.

3.2. 소나무 원목의 천연건조 중 함수율 변화 예측
3.2.1. 천연건조 시험결과를 이용한 회귀분석

Table 2에 소나무 원목의 말구지름, 온도, 상대습도, 풍속에 따른 천연건조 중 감소한 함수율을 제시하였다. 함수율을 측정한 기간은 2016년 10월부터 2017년 10월로 측정간격은 117일에서 148일(평균 128일)이었다. 온도, 상대습도, 풍속은 서울지역의 약 4개월간의 평균값이다. 소나무 원목의 천연건조 중 함수율 감소는 일반적으로 초기함수율이 높고, 말구지름이 작고, 온도가 높을수록 큰 경향을 나타냈다. 상대습도와 풍속은 측정기간 별로 변이가 크지 않았다.

소나무 원목의 초기함수율, 말구지름, 온도, 상대습도, 풍속과 천연건조 중 함수율 감소에 대한 다중회귀분석을 수행하면 Table 3과 같은 결과를 얻는다. 회귀모형은 Y = 0.350 × X1‒0.030×X2‒1.38×X3+8.84×X4+272×X5‒1100이고, 결정계수 (R-squared)는 0.925로 각 독립변수에 따른 종속변수의 회귀모형은 92.5%의 정확성으로 예측 가능하다고 볼 수 있다. P-값 (P-value)의 범위는 1.17 × 10⁻⁵‒3.25×10⁻³의 범위로 95% 신뢰도의 기준인 0.05보다 작기 때문에 회귀모형은 적합하다고 판단할 수 있다. 독립변수별 P값은 초기함수율, 말구지름, 상대습도, 풍속, 온도의 순서로 증가하여, 소나무 원목의 특성인 함수율과 말구지름이 기상조건인 상대습도, 풍속, 온도에 비하여 천연건조 중 함수율 감소에 미치는 영향이 더 큰 것을 확인할 수 있다.

Table 4에 독립변수를 소나무 원목의 초기함수율, 말구지름, 온도 3가지로 설정하고, 종속변수인천연건조 중 함수율 감소에 대한 다중회귀분석 결과를 제시하였다. 독립변수를 3가지로 결정한 이유는 Table 3의 결과에 제시된 것과 같이 목재의 원목 특성이 천연건조에 미치는 영향이 크고, 기상조건 중 온도에서 측정기간 중 변이가 크기 때문이다. 이 조건에서 회귀모형은 회귀모형은 Y = 0.573 × X1‒0.036×X2+0.218×X3이고, 결정계수는 0.874이었다. 이 결과는 Table 3의 독립변수를 5가지로 설정한 것에 비하여 결정계수가 감소하였으나, P값의 범위는 4.72 × 10⁻¹⁸‒3.05×10⁻³이었으며 통계적으로 유의하였다.

3.2.2. 목재의 확산계수와 표면방사계수를 이용한 천연건조 중 함수율 변화 예측

천연건조 중 소나무 원목의 함수율 변화를 2차원 물질전달 해석을 이용하여 예측하였다. 함수율 변화의 예측을 위한 건조기간 과 확산계수 및 표면방사계수의 결정에 2가지 방법을 적용하여 비교하였다. 첫 번째는 1년 중 1월에서 12월까지의 실제일수와 각 달의 평균 기상조건을 적용한 확산계수와 표면방사계수를 이용하는 방법이고, 두 번째는 1년 중 각 달별 유효천연건조일수와 여름철(6월 ‒ 8월) 기상조건을 적용한 확산계수와 표면방사계수를 이용하는 방법이다.

천연건조 중 내부함수율을 측정한 2본의 소나무 원목의 크기와 함수율을 물질전달 해석모형에 적용하여 위의 2가지 방법으로 함수율 변화를 예측하였다. 초기함수율 64%, 말구지름 430 mm, 길이 3.6 m인 소나무 원목을 2016년 6월부터 2017년 3월까지 270일 동안 천연건조시 예측된 함수율 변화를 Fig. 4에 제시하였다. Fig. 4(a)는 실제천연건조일수와 월별 평균 기상조건을 이용한 결과이고, (b)는 190일의 유효천연건조일수와 여름철 기상조건을 이용한 결과이다.

Fig. 4(a)의 조건에서 소나무 원목의 함수율은 실제 천연건조일수 90일을 경과 후 38.7%, 180일을 경과 후 34.8%, 270일을 경과 후 33.5%로 예측되었다. Fig. 4(b)의 조건에서 소나무 원목의 함수율은 유효천연건조일수 90일 경과 후 38.9%, 160일 경과 후 34.8%, 190일 경과 후 33.6%로 예측되었다. 천연건조 중 원목의 내부함수율을 예측하는 2가지 방법의 오차는 0.1%였다. 동일한 천연건조 중 함수율 변화 예측모형을 섬유포화점 이하의 함수율 범위에 적용하기 위하여 Fig. 5에 초기함수율 35%, 말구지름 300 mm, 길이 3.6 m인 소나무 원목을 2016년 10월부터 2018년 10월까지 750일 동안 천연건조시 예측된 함수율 변화를 제시하였다. Fig. 4와 동일하게 Fig. 5(a)는 실제천연건조일수와 월별 평균 기상조건을 이용한 결과이고, Fig. 5(b)는 490일의 유효천연건조일수와 여름철 기상조건을 이용한 결과이다.

Fig. 5(a)의 조건에서 소나무 원목의 함수율은 실제 천연건조일수 150일을 경과 후 29.5%, 300일을 경과 후 26.7%, 450일을 경과 후 23.4%, 600일 경과 후 22.1%, 750일 경과 후 19.7%로 예측되었다. Fig. 4(b)의 조건에서 소나무 원목의 함수율은 유효천연건조일수 150일 경과 후 26.3%, 300일 경과 후 22.3%, 490일 경과 후 18.9%로 예측되었다. 천연건조 중 원목의 내부함수율을 예측하는 2가지 방법의 오차는 0.8%였다. 섬유포화점 이상의 함수율 변화 예측(Fig. 4)에 비하여 오차가 큰 이유는 각 월별 평균 기상조건을 적용한 경우, Figure 5(a)에 제시된 것과 같이 2017년 3월, 7월, 2018년 4월에서 소나무 원목의 함수율이 증가하는 것에 비하여 여름철 기상조건을 적용한 경우, Fig. 5(b)에 제시된 것과 같이 함수율이 일정하게 감소하기 때문으로 판단된다.

2가지 조건으로 예측된 소나무 원목의 천연건조 중 함수율 변화 예측모형을 검증하기 위하여 2016년 6월부터 2017년 3월까지 270일 동안 천연건조된 초기함수율 64%, 말구지름 430 mm, 길이 3.6 m인 소나무 원목의 내부함수율(Fig. 6(a))과 2016년 10월부터 2018년 10월까지 750일 동안 천연건된 초기함수율 35%, 말구지름 300 mm, 길이 3.6 m인 소나무 원목의 내부함수율 (Fig. 6(b)를 제시하였다. 소나무 원목의 재장 3.6 m의 중간에서 원판으로 채취된 시험재의 평균함수율은 각각 30.0%, 16.7%였 다. 천연건조 중 측정된 소나무 원목 내부의 함수율과 예측모형에 의해 예측된 함수율의 오차는 섬유포화점 이상 함수율에서 3.5 ‒ 3.6%의 범위이고, 섬유포화점 이하 함수율에서 2.2 ‒ 3.0%의 범위였다. 천연건조 중 실제 측정된 함수율과 예측모형으로 예측된 함수율의 오차율 약 3%는 함수율 20%를 기준으로 약 120‒140일의 차이를 의미한다. 다양한 초기함수율과 말구지름의 소나무 원목에 대한 천연건조 중 내부함수율을 측정하고, 각각의 기상조건에 대한 목재 내 수분이동계수를 산출하면 예측모형의 오차율을 감소시킬 수 있을 것으로 판단된다.

4. 결 론

본 연구에서는 천연건조 중 목재의 내부함수율 변화를 분석하기 위하여 소나무 원목의 천연건조를 수행하였다. 15본의 소나무 원목에 대한 천연건조 결과와 기상인자들의 다중회귀분석을 수행하였으며, 선행연구를 통한 유효천연건조일수와 서울지 역의 기상자료를 바탕으로 산출된 수분확산계수와 표면방사계수를 이용하여 소나무 원목의 천연건조 중 내부함수율 변화를 예측하였다. 이를 통해 다음과 같은 결론을 얻을 수 있었다.

  1. 여름철에 건조를 시작하여 약 880일이 경과한 6본의 소나무 원목과 가을철에 건조를 시작하여 약 760일이 경과한 9본의 소나무 원목의 평균 최종함수율은 각각 17.4%와 16.0%이었다. 건조 시작 후 섬유포화점 이상의 함수율에서 건조속도가 제일 빠르고 점차 감소하는 경향을 보였으며, 초기함수율의 차이로 계절에 따른 건조속도의 차이를 직접 비교할 수 없지만 봄철과 겨울철에 섬유포화점 이하의 함수율에서 건조가 거의 진행되지 않음을 확인할 수 있었다.

  2. 천연건조 중 감소한 함수율을 종속변수로 소나무 원목의 말구지름, 온도, 상대습도, 풍속을 독립변수로 다중회귀분석을 진행한 결과, 결정계수 0.925의 회귀모형 “함수율 감소(%) = 0.350 × 초기함수율(%) ‒ 0.030 × 말구지름(mm) ‒ 1.38 × 온도(°C) + 8.84 × 상대습도(%)+272×풍속(m/s) ‒ 1100”을 얻을 수 있었다. 다중회귀분석 결과, 소나무 원목의 특성인 초기함수율과 말구지름이 기상조건인 온도, 상대습도, 풍속에 비하여 천연건조 중 함수율 감소에 미치는 영향이 더 크게 나타났다.

  3. 천연건조 중 내부함수율의 분포 및 함수율 변화를 예측하기 위하여 2차원 물질전달 해석을 수행하였다. 실제건조일수와 각 달의 평균기상조건을 적용하는 방법과 유효천연건조일수와 여름철의 기상조전을 적용하는 서로 다른 2가지 방법을 적용한 결과, 2가지 방법의 오차는 0.1 ‒ 0.8%의 범위였으며, 측정값과의 차이는 2.2 ‒ 3.6%의 범위였다.

다양한 초기함수율과 말구지름의 소나무 원목에 대한 천연건조 중 내부함수율을 측정하고, 각각의 기상조건에 대한 목재 내 수분이동계수를 산출하면 예측모형의 오차율을 감소시킬 수 있을 것으로 판단된다.

References

1.

Denig J., Wengert E. Estimating air-drying moisture content loss for red oak and yellow-poplar lumber. Forest Products Journal. 1982; 32(2):26-31.

2.

Han Y., Seo Y.O., Jung S.C., Eom C.D. Prediction of heat-treatment time of black pine log damaged by pine wilt disease. Journal of the Korean Wood Science and Technology. 2016; 44(3):370-380.

3.

Han Y., Eom C.D., Lee S.M., Park Y. Moisture content change of Korean red pine logs during air drying: I. Effective air drying days in major regions in Korea. Journal of the Korean Wood Science and Technology. 2019; 47(6):721-731.

4.

Hart C.A. SIMSOR: A computer simulation of water sortpion in wood. Wood and Fiber. 1982; 13(1):46-71.

5.

Hollman J.P. Heat Transfer (SI metric ed.). 1989; Sydney, Australia: McGraw-Hill. p. 676.

6.

Jung H.S. Study on air-drying characteristics of Taun lumber and air-drying calendar (I). Journal of the Korean Wood Science and Technology. 1985; 13(3):27-33.

7.

Jung H.S., Lee N.H., Lee J.H., Kwon J.Y. Comparison of air-drying process in four seasons for some softwood lumbers. Journal of the Korean Wood Science and Technology. 1997; 25(1):28-36.

8.

Jung H.S., Lee C.H., Kang W., Eom C.D. Air-drying curve and moisture content distribution of softwood square timber. Journal of the Korean Wood Science and Technology. 2003; 31(1):27-31.

9.

Kamke F.A., Vaneck M. Comparison of wood drying models. 1994; In: Paper presented at the 4th IUFRO International Wood Drying Conference, Rotorua, New Zealand p. 1-21.

10.

Kim H.B., Han Y., Park Y., Yang S.Y., Chung H., Eom C.D., Lee H.M., Yeo H. Finite Difference Evaluation of Moisture Profile in Boxed-heart Large-cross-section Square Timber of Pinus densiflora during High Temperature Drying. Journal of the Korean Wood Science and Technology. 2017; 45(6):762-771.

11.

Korea Meteorological Administrationhttp://data.kma.go.kr

12.

Lee C.J., Lee N.H., Park M.J., Park J.S., Eom C.D. Effect of reserve air-drying of Korean pine heavy timbers on high-temperature and low-humidity drying characteristics. Journal of the Korean Wood Science and Technology. 2014; 42(1):49-57.

13.

Lee H.W., Jung H.S. The comparative analysis of drying-conditions, -rates, -defects and -yield, and heat-efficiency in solar-dehumidification-drying of oaks with those in conventional air-, semigreenhouse type solar-, and kiln-drying. Journal of the Korean Wood Science and Technology. 1989; 17:22-54.

14.

McMillen J.M., Wengert E.M. Drying eastern hardwood lumber. Agric. Handb. 528. 1978; Washington, DC: U.S. Department of Agriculture, Forest Service. p. 104.

15.

Perré P., Moser M., Martin M. Advances in transport phenomena during convective drying with superheated steam and moist air. Journal of Heat and Mass Transfer. 1993; 36(11):2725-2746.

16.

Ranta-Maunus A. Computation of moisture transport and drying stresses by a 2-D FE-programme. 1994; In: Paper presented at the 4th IUFRO International Wood Drying Conference, Rotorua, New Zealand p. 187-194.

17.

Rietz R.C., Page R.H. Air drying of lumber: A guide to industry practice. Agric. Handb. 402. 1971; Washington, DC: U.S. Department of Agriculture, Forest Service. p. 110.

18.

Simpson W.T., Hart C.A. Method for estimating air-drying times of lumber. Forest Products Journal. 2000; 51(11/12):56-63.

19.

Siau J.F. Wood: Influence of moisture on physical properties. 1995; Blacksburg, VA: Virginia Polytechnic Institute and State University. p. 227.

20.

Sutherland J.W., Turner I., Northway R.L. A theoretical and experimental investigation of the convective drying of Australian pinus radiata timber. 1992; In: Paper presented at the 3rd IUFRO International Wood Drying Conference, Vienna, Austria p. 145-155.

21.

Yeo H., Smith W.B. Development of a convective mass transfer coefficient conversion method. Wood Fiber Science. 2005; 37(1):3-13.