1. INTRODUCTION
Wood is one of the most familiar materials to human and it has been used as useful resource in various fields such as architecture, paper industries and even as functional food ingredients (Jung et al., 2018). To utilize wood as valuable materials, understanding of the wood physical/chemical properties is important. Wood is mainly comprised of cellulose, hemicellulose, lignin and extractives, and they are linked one another by various chemical bondings such as hydrogen and carbon-carbon. These chemical structures lead to quite different properties of woods because content and composition of wood components varies depending on wood species (Sjostrom, 1993; Stark et al., 2003). Therefore, classification of wood species and understanding of its physical/chemical properties have been recognized as important factors and various technical analysis has been done for those purposes. However, classification of wood species, which have high similarity in appearance, is not easy for non-experts. In addition, traditional methods such as anatomical method and wet chemistry are difficult and labor-intensive work for wood classification. To solve these problems, near-infrared (NIR) spectroscopy has been applied recently. NIR spectroscopy measures light absorbance caused by wood’s major components, it can be applied for rapid and nondestructive wood characterization (Kwon et al., 2017). Moreover, because each wood’s major components have different patterns of absorbance, it can be possible to predict its chemical composition and species (Schwanninger et al., 2011).
In our previous researches, we evaluated the possibility of five species of Korean softwood classification using NIR spectroscopy. (Park et al., 2017; Yang et al., 2017). These researches described that five wood species (Cryptomeria japonica (cedar)/Chamaecyparis obtuse (cypress), Pinus densiflora (red pine)/Pinus koraiensis (Korean pine), Larix kaempferi (Larch)) were divided into three distinguishable groups; (Chamaecyparis obtuse/Cryptomeria japonica, Pinus densiflora/Pinus koraiensis, and Larix kaempferi). However, factors which sort five Korean softwoods into three groups were not figured out in detail and further researches were required.
In this study, organic solvent extractives were acquired from each three distinguishable groups using alcohol-benzene extraction method. Qualitative analysis of organic solvent extractives were conducted by using a gas chromatography, and thin layer chromatography method. Based on chemical information of the extractives, the interpretation of NIR spectra of each species was conducted at specific wavelength in order to figure out the relationship between the organic solvent extractives and NIR spectra for wood classification more clearly.
2. MATERIALS and METHODS
For this study, five Korean softwoods, cedar (Cryptomeria japonica), cypress (Chamaecyparis obtuse), red pine (Pinus densiflora), Korean pine (Pinus koraiensis), and larch (Larix kaempferi), were purchased from the National Forestry Cooperative Federations in Republic of Korea. 50 rectangular lumber of each five softwood species was obtained (thickness × width × length = 50 × 100 × 600 mm). To minimize deviation caused by direction of wood, each rectangular lumber was stranded five times at 2 mm interval. The stranded sawdust was ground and sieved at 40 mesh size. Totally, 1,250 wood powders (sawdust) were prepared for each species.
In previous research, among total 1250 ground samples of five softwoods, representative 150 samples (Red pine: 29, Korean pine: 41, Larch: 29, Cypress:25, Cedar: 26) were selected based on obtained NIR spectra, principle component analysis (PCA), and Mahalanobis distance theory. Sample selection of the representative samples was prepared according to the our previous research (Park et al., 2018). Additionally, the quantitative analysis of extractives of each selected sample was also conducted according to Technical Association of the Pulp and Paper Industry (TAPPI) ethanol-benzene (1:2, v/v) solution method (Sluiter et al., 2005).
To analyze the effect of extractives on NIR spectra more clearly, 3 samples for each species were selected depending on its extractives content (high, middle, and low) from the selected samples. The samples which had the highest and lowest content of extractives were selected as high and low extractives content samples. The samples which had extractives content close to average value were selected as middle extractives content samples.
For qualitative analysis and NIR spectra analysis, extractives of selected samples and extractives removed sawdust were required. To acquire extractives of selected samples (total 15 samples) and their extractivesremoved sawdust, alcohol-benzene (1:2, v/v) solution method was used. 2 g of each sawdust was put into thimble filter (ADVANTEC, Japan) and extraction was conducted by TAPPI methods described in 2.2. After extraction, crude extract was evaporated and re-dissolved at 20 ml of ethanol. The solid residue (extractives-removed sawdust) of extraction was air-dried for 24 h.
NIR spectra of raw sawdust and extractives-removed sawdust were obtained using a SpectraStar 2600 XL instrument (Unity Scientific, Milord, MA, USA). Both raw sawdust and extractives-removed samples was put into a cup holder and light absorbance from 680 to 2600 nm wavelength was measured. OMNIC 9.2 software (Thermo Scientific, Waltham, MA, USA) was used as spectra analysis tool. To escape misinterpretation caused by overlapping of NIR absorbance peaks and analyze influence of extractives on NIR spectra more effectively, Savitsky-Golay 2nd derivative pretreatment method was used (polynomial order: 3, smoothing point: 21) and the spectra were compared each other (Park et al., 2017).
For qualitative analysis, GC/MS analysis for selected samples was conducted. To detect chemicals which are difficult to evaporate, trimethylsilylation reaction was carried out. Each 100 μl of extractives samples were reacted with 100 μl of pyridine anhydrous and 100 μl Sylon BFT solution (BSTFA + TMCS (99:1), SUPELCO) at 105°C for 2 h. After trimethylsilylation, the GC/MS analysis was carried out using Agilent DB-5 (25 m × 0.32 mm × 0.52 μl) column and He gas as carrier gas. For detecting various kinds of wood extractives, oven temperature was set widely from 50°C to 300°C for 3°C/min (Kim et al., 2017).
To figure out similarity of extractives between each groups visually, the TLC method was conducted. The silica gel 60 plate was used as stationary phase and hexane-ethyl acetate (2:1, v/v) solution was used as mobile phase. After the mobile phase moved completely, the images of extractives which were separated were acquired using ultraviolet light at 254 and 365 nm wavelength.
3. RESULTS and DISCUSSION
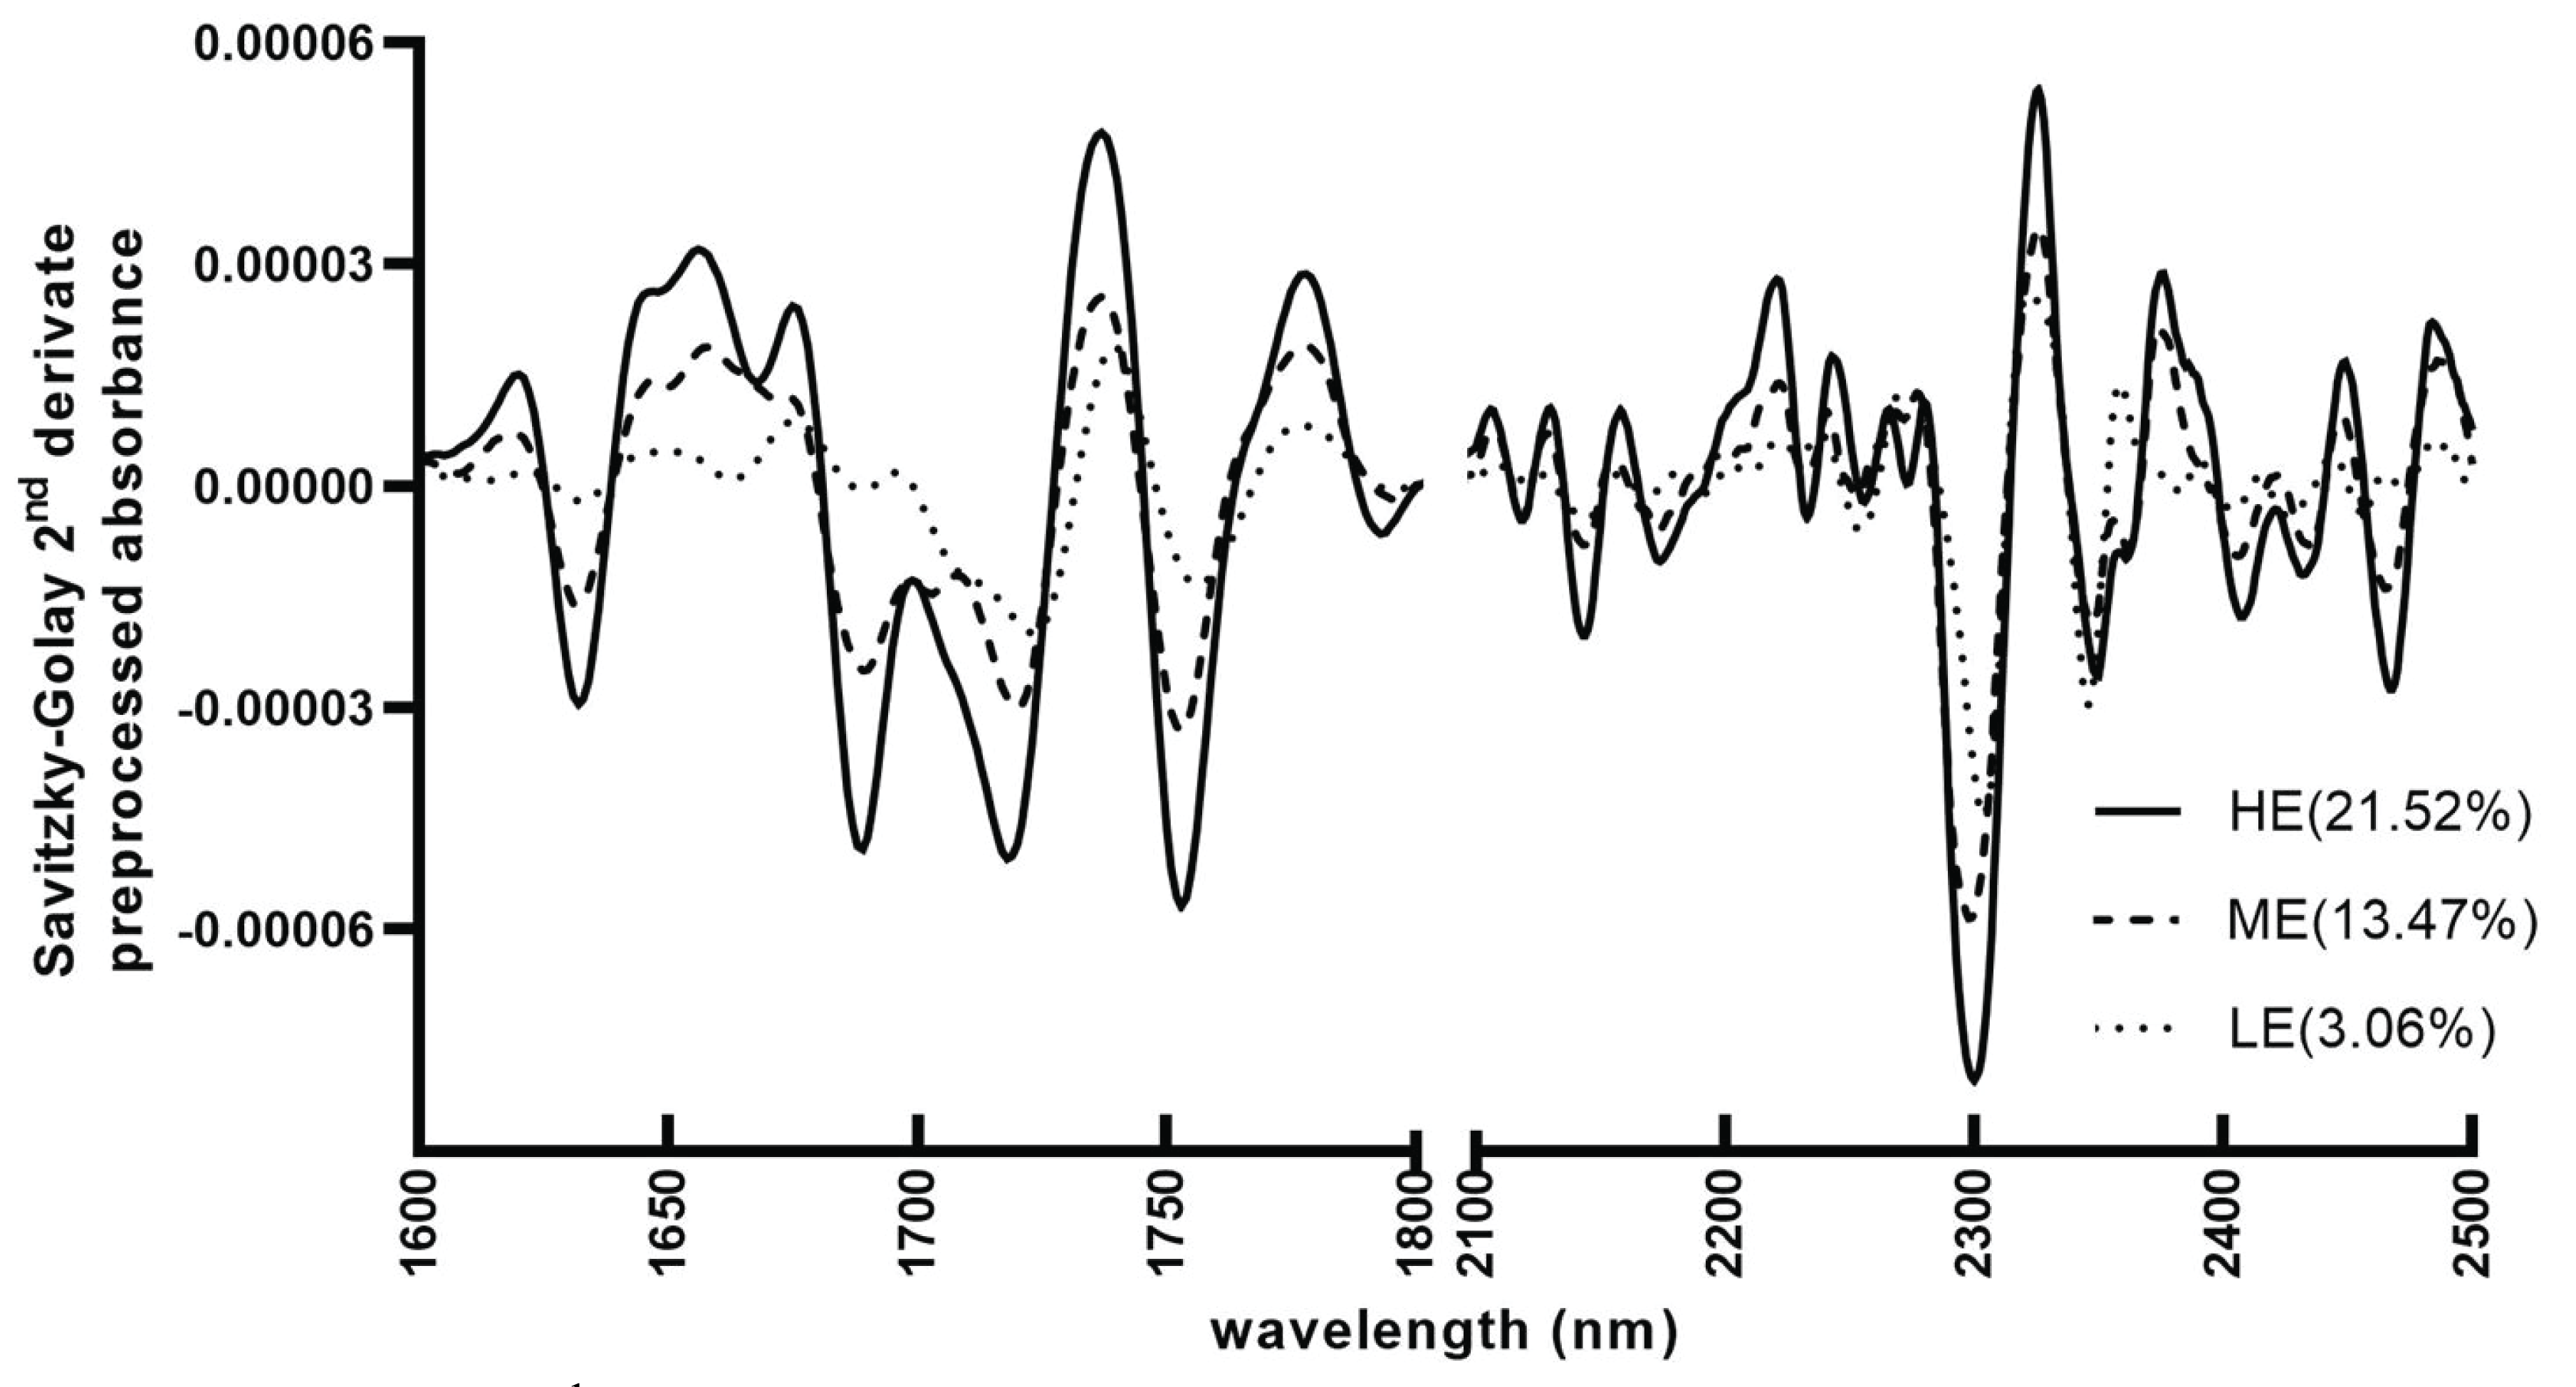
Content and chemical structure of wood extractives could influence NIR spectra and it was observed in 2nd derivative spectra of each wood species. Fig. 1 and Table 1 showed the 2nd derivative NIR spectra change of red pine caused by removing extractives from raw sawdust samples and organic solvent extractives content of each sample. Except wavelength region which is influenced by water content, change of NIR spectra after removing extractives was observed especially at 1600~1800 nm and 2100~2500 nm. At Fig. 1, three samples have different extractives content, but they showed similar tendency of change at same wavelength. The amount of change increased in proportion to extractives content. High-extractives content sample (HE) showed the most bigger change and Low-extractives content sample (LE) showed mild change. From these results, it could be expected that content of organic solvent extractives and NIR spectra change had significant correlation.

Fig. 2 showed 2nd derivative NIR spectra of raw sawdust and extractives-removed sawdust (high-extractives content sample of each wood species). All five species showed change of the 2nd derivative NIR spectra. Cedar, cypress, and larch had relatively low extractives content and showed small spectra change compared to red pine and Korean pine (Table 1), but specific wavelength which the change was occurred were quite different depending on wood species. Cedar and cypress group showed spectra change at 1695, 1724, 2291 nm. Red pine and Korean pine not only showed spectra change at 1695, 1724, 2291 nm which were observed at cedar and cypress group but also showed spectra change at 1616, 1681, 1705, 1731, 1765, and 1780 nm which were not observed at cedar and cypress. Larch showed almost no change in 2nd derivative NIR spectra between raw sawdust and extractives-removed sample.

In previous researches, score plot of the five Korean gymnosperm samples by principal component analysis (PCA) showed three groups; cedar/cypress, red pine/ Korean pine, and larix. Similarly, the change of 2nd derivative NIR spectra after removing extractives also showed same three groups which have high similarity in their NIR spectra change pattern (Chamaecyparis obtuse/Cryptomeria japonica, Pinus densiflora/Pinus koraiensis, Larix kaempferi) at specific wavelength. Therefore, it was expected that the organic solvent extractives of each wood species and their NIR spectra have significant correlation and extractives could be influence factor in wood classification using NIR spectroscopy.
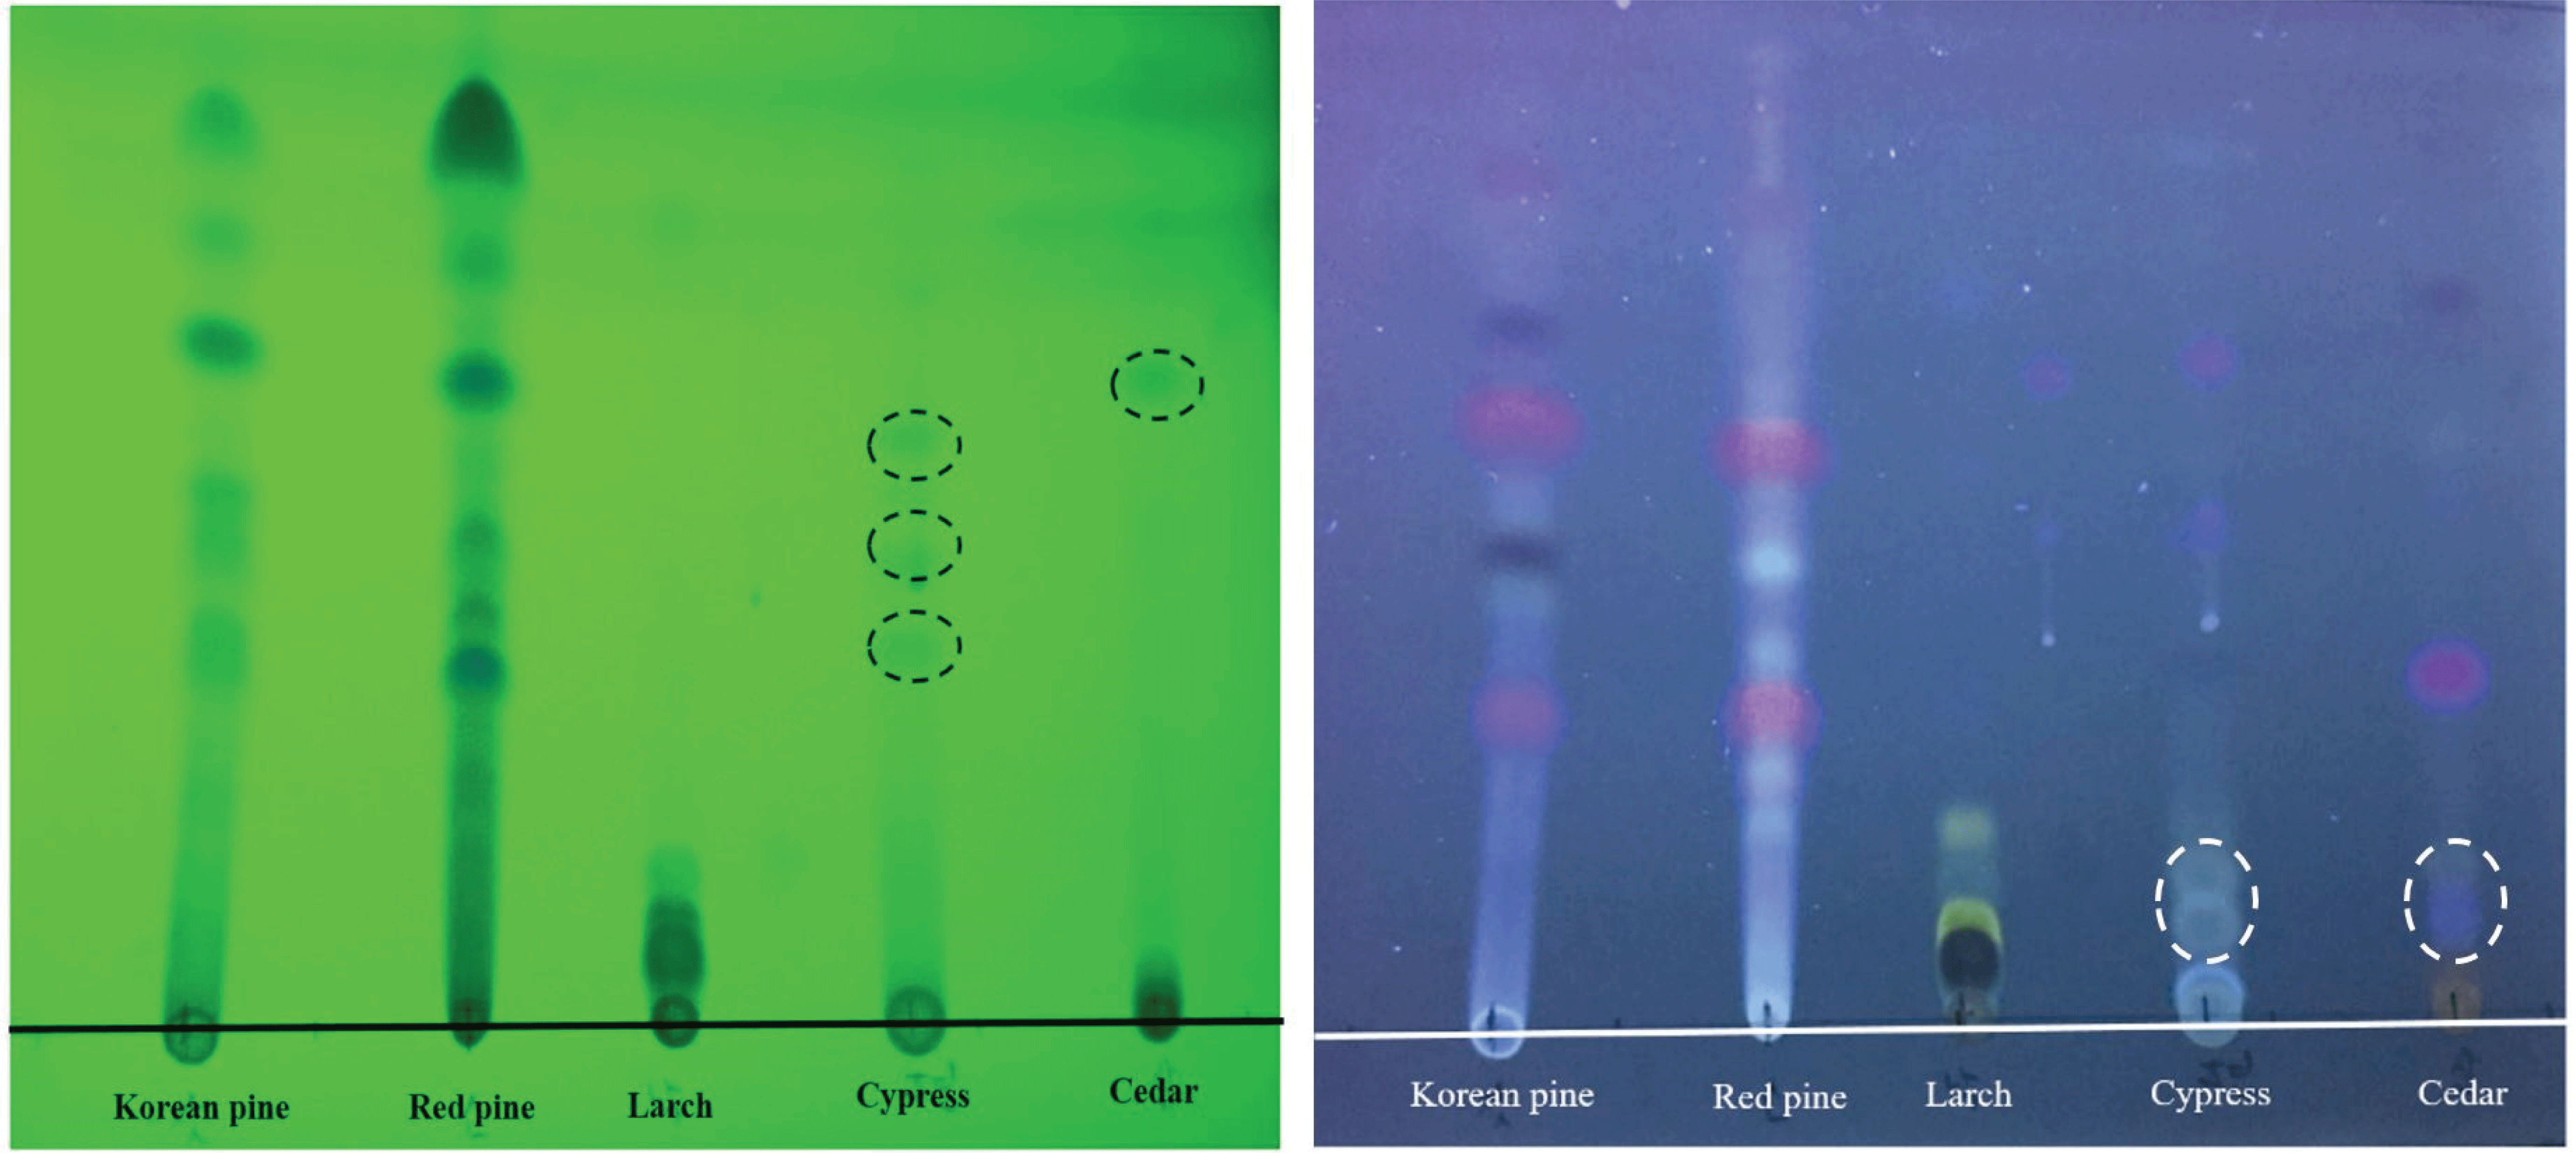
Fig. 3 showed result of GC/MS analysis of five Korean softwood extractives (chemicals which have the highest probability). Crytomeria japonica (cedar) showed sharp and high intensity peak of D-pinitol around 50~55 min. Androstane and ferruginol were also detected around 60~65 min. Chamaecyparis obtuse (cypress) had eremophilene peak, but the signal was relatively weak. In this research, these extractives which were detected by GC/MS showed high consistency with band assignment of NIR spectra. At Fig. 2, cedar and cypress group showed NIR spectra change at 1695, 1724, 2291 nm by removing extractives. 1695 nm was assigned to CH3 groups (Schimleck and Evans, 2004) and 1724 nm was assigned to pyranose/furanose (Tsuchikawa, 2007). A band at 2291 nm was combination region of C-O stretching/O-H stretching or C-H2 bend/C-H2 stretching (Michell, 1996). Because D-pinitol has six C-H groups, one CH3 groups, and five O-H groups, it was expected D-pinitol could contribute to change of NIR spectra at 1695, 1724, 2291 nm. Small amount of ferruginol which is kinds of diterpenoids also could contribute to change at that wavelength. D-pinitol and ferruginol did not have aliphatic double bond. Therefore, cedar and cypress did not show the change of NIR spectra at band assignment of double bond (such as 1616 nm). In GC/MS analysis, cedar and cypress seemed to have no similarity, but TLC analysis images at Fig. 4 showed cedar and cypress had spots which were located at same position. It seemed that some extractives were not detected by GC/MS, but it was expected that extractives of cedar and cypress have some similarity in their structures.

Pinus densiflora (red pine) showed sharp and high intensity peaks of fatty acid and diterpenoids which have carboxylic groups and aliphatic double bonds. Oleic acid was detected as fatty acid and pimaric acid, isopimaric acid, callitrisic acid, and abietic acid were detected as diterpenoids. Pinus Koraiensis (Korean pine) also showed sharp and high intensity peaks of diterpenoids such as isopimaric acid, callitrisic acid, abietic acid. Red pine and Korean pine showed high similarity in their extractives components in GC/MS analysis. The red pine and Korean pine group also showed high correlation between extractives and band assignment of NIR spectra. At Fig. 2, the 2nd derivative spectra change of red pine and Korean pine groups showed different patterns with cedar and cypress group at 1616, 1681, 1705, 1731, 1765, and 1780 nm. 1616 nm was assigned to =CH2 groups (Baillères et al., 2002) and 1681 nm was assigned to acetyl, carboxylic, and carbonyl groups (Günzler et al., 1996). 1705, 1731, 1765, and 1780 nm were assigned to -CH2 groups (Burns and Ciurczak, 2007; Weyer and Workman Jr, 2007). In GC/MS analysis (Fig. 3), fatty acid and diterpenoids which have carboxyl group, carbon-carbon double bond (not in cedar and cypress group) were detected at extractives of red pine and Korean pine. Oleic acid has one carboxyl group, one double bond, and fourteen –CH2 groups. Diterpenoids such as pimaric acid, callitrisic acid, abietic acid also have carboxyl group, much –CH2 groups, and double bond (except aromatic bond of callitrisic acid). These functional groups could contribute to change of NIR spectra at 1616, 1681, 1705, 1731, 1765, 1780 nm and made difference with cedar and cypress group. In addition, red pine and Korean pine showed relatively high amount of change in every wavelength because red pine and Korean pine had relatively higher extractives content than other species (cedar : 8.85%, cypress : 7.16%, red pine : 21.52%, Korean pine : 15.47%, larch : 6.15%). In case of Larix kaempferi (larch), high and intensive catechin peak was detected and larch showed change of spectra at 1668 nm and 1674 nm which were referred to aromatic bond assignment (Barton et al., 1992). However, 2nd derivative NIR spectra showed almost no change. It was expected that sensitivity of aromatic bond was very low in NIR region. Although the 1668 and 1674 nm are known as band assignment of aromatic C-H bond, this region is also affected by 1st overtone of O-H stretching. Therefore, in case of NIR measurement using sawdust, other major components of woods such as cellulose and hemi-cellulose could influence detection of aromatic extractives.
In TLC analysis (Fig. 4), red pine and Korean pine also showed almost same pattern and it meant that extractives of two pines have chemically similar structure. In the case of cedar and cypress, the similarity was not shown at 254 nm, but similar two spots were observed at 365 nm. The organic solvent extractives of larch showed quite different pattern with cedar/ cypress group and red pine/Korean pine. Extractives of larch had very low retention factor. It seemed that catechin which was detected at larch is relative polar extractives and mobile phase was quite non-polar solvent.

4. CONCLUSION
This study analyzed the effect of organic solvent extractives on wood species classification using NIR spectroscopy. Extractives of each species were acquired by alcohol-benzene method and those extractives were analyzed using GC/MS and TLC method. NIR spectra of raw sawdust and extractives-removed sawdust were measured and NIR spectra was analyzed in terms of chemical structure of extractives and its band assignment.
Cedar/cypress showed NIR spectra change at similar wavelength and the change was seemed to be caused by extractives which had aliphatic –CH, –CH3 groups such as D-pinitol and ferruginol. However, Red pine/Korean pine showed quite different spectra change pattern with cedar/cypress. Fatty acids and diterpenoids which had carboxylic groups and double bonds were detected in extractives of both red pine and Korean pine. Because these extractives could influence aliphatic double bond and carbonyl group region, it was expected that red pine/Korean pine group showed different pattern with cedar/cypress group. Larch which had catechin as extractives showed only small change at NIR spectra. It was expected that aromatic bond had low sensitivity when the NIR measurement was conducted using wood sawdust because of other major components of woods. In this study, the factors which sort five Korean soft woods into three groups in previous researches were analyzed more detail in terms of extractives and its band assignment. The chemical structure of extractives influenced NIR spectra patterns. Therefore, it could be concluded that kinds of extractives as well as content of extractives could affect classification of Korean softwood species using NIR spectroscopy.
