
1. INTRODUCTION
In Korea, there are many wooden cultural heritages that use timbers. Among them, Hanok, means a construction made with traditional methods in Korea. More modern Hanok construction is expected as large-scale Hanok district promotion projects.
According to statistics of 2016 provided by the National Hanok Center, an average of 1,533 Hanok was built annually, with steady demand. The area with the most Hanoks built from 2007 to 2010 was Jeolla Namdo (Southern Jeolla) with 1,549 new houses, followed by Seoul city with 486 houses. During the 3 years the survey had been conducted, about 3,000 new Hanoks were built, and roughly the same number of Hanoks had gone through maintenance. Modern Hanok and wooden cultural heritage, unlike general wooden construction, require consistent maintenance, management and repair, as they use structural size members (Kim et al., 2015; Kim, 2012b). Statistics provided from the National Hanok Center indeed shows the necessity of systematic maintenance, management and repair. Moreover, as innovative cities being built across different provinces and districts actively attract residential population, trend shows that consumers clearly prefer wooden houses especially in single residential sites, as interest for eco-friendly living has increased. This led to an increased number of constructions of light frame buildings. Table 1.
| year | 2011 | 2012 | 2013 | 2014 | 2015 | 2016 |
|---|---|---|---|---|---|---|
| Wooden construction | 10,037 | 10,369 | 10,339 | 11,493 | 13,595 | 14,945 |
This study aims to build a database through an outdoor exposure test for a more accurate safety evaluation of wooden construction (Kim, 2017a; Kim, 2017b). A 3-year outdoor exposure test of small wooden test pieces is underway, in which basic physical properties are measured monthly by test piece samples (Kim, 2012a). This study was conducted to evaluate the test pieces that have completed on year test. Utilizing the database on remaining life acquired from this study will interact with local characteristics and bring beneficial insights including management of structural size members in the traditional point of view, and increase of demand of wooden houses by securing safety of wooden houses in the modern point of view (Kim and Park, 2015a).
2. MATERIALS and METHODS
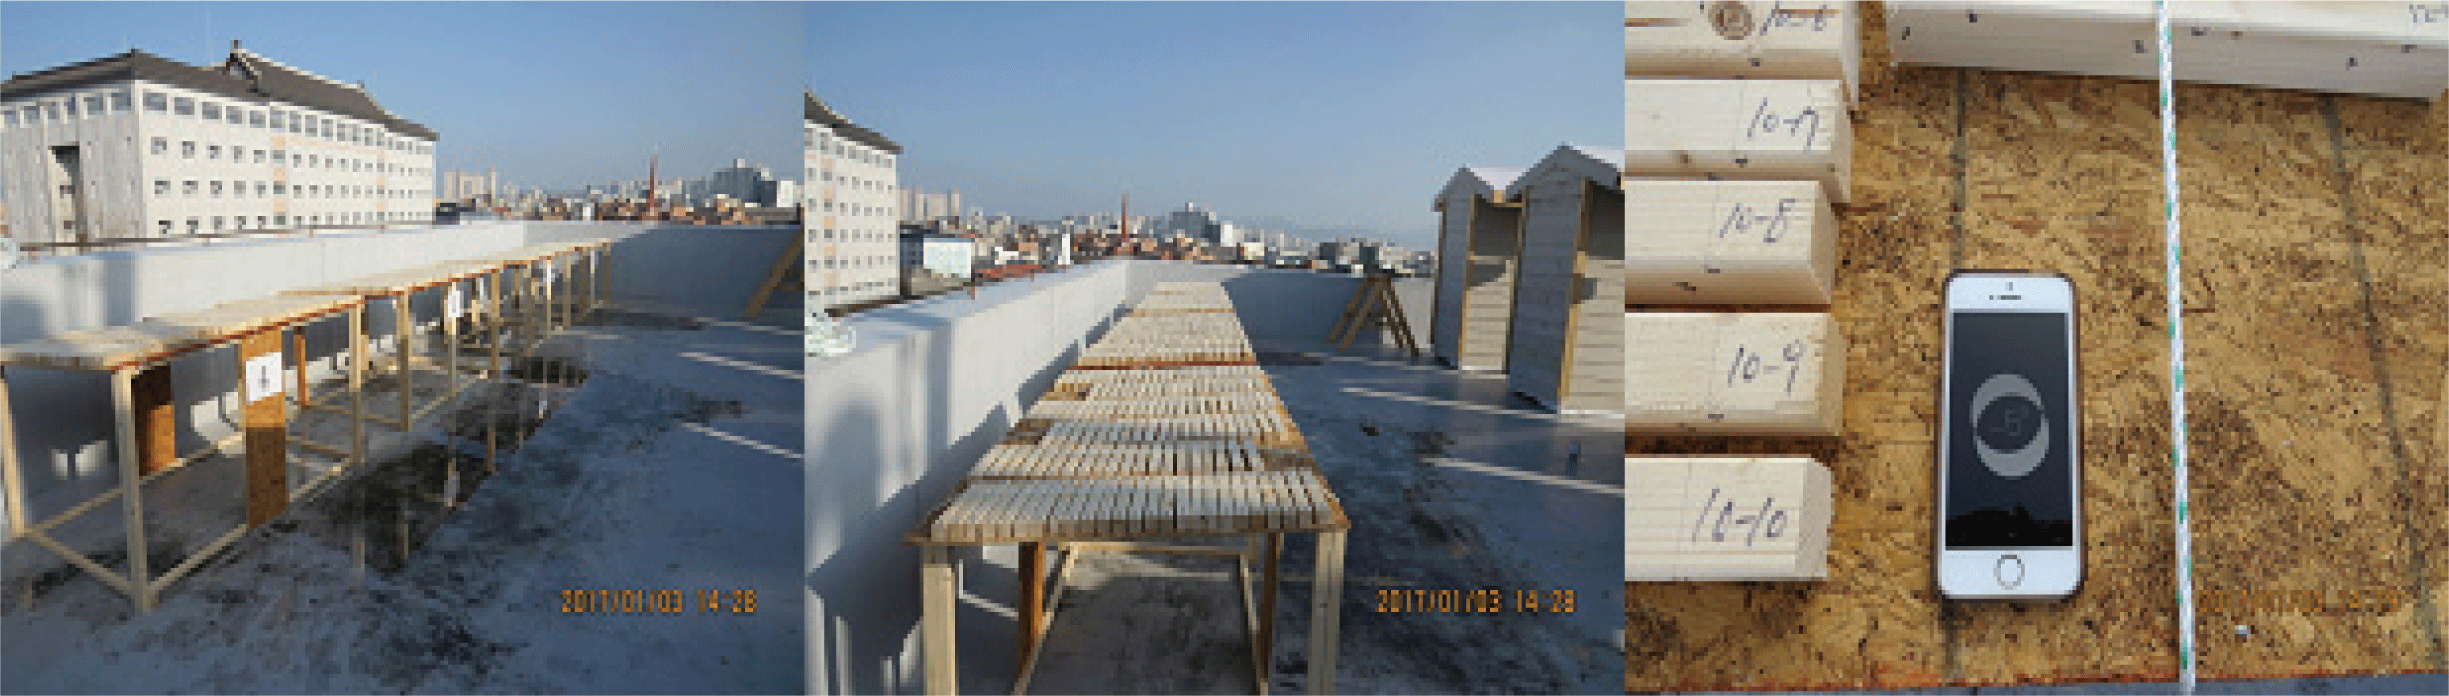
The official tree species used in this study is an SPF (Spruce-Picea jezoensis, Pine-Pinus densiflora, and Fir-Abies holophylla) artificially dried under 18 percent moisture content, those is used frequently in Korean wooden constructions. The test pieces were prepared in the size of 38×38×300 mm with a miter saw. Although wooden cultural heritage and heavy timber construction employs members of structural size, the complete absence of related research data required this study to establish the concept first, thus the samples processed as small test pieces. The number of test pieces was a total of 120 units, which are ten units per month for a period of twelve month. Among these, the collecting 10 specimens tested per month. And the control group (20 specimens) was tested separately. The physical properties of the specimen were measured monthly before and after the test (Kim et al., 2009; Kim and Matsumura, 2013). Fig. 1.
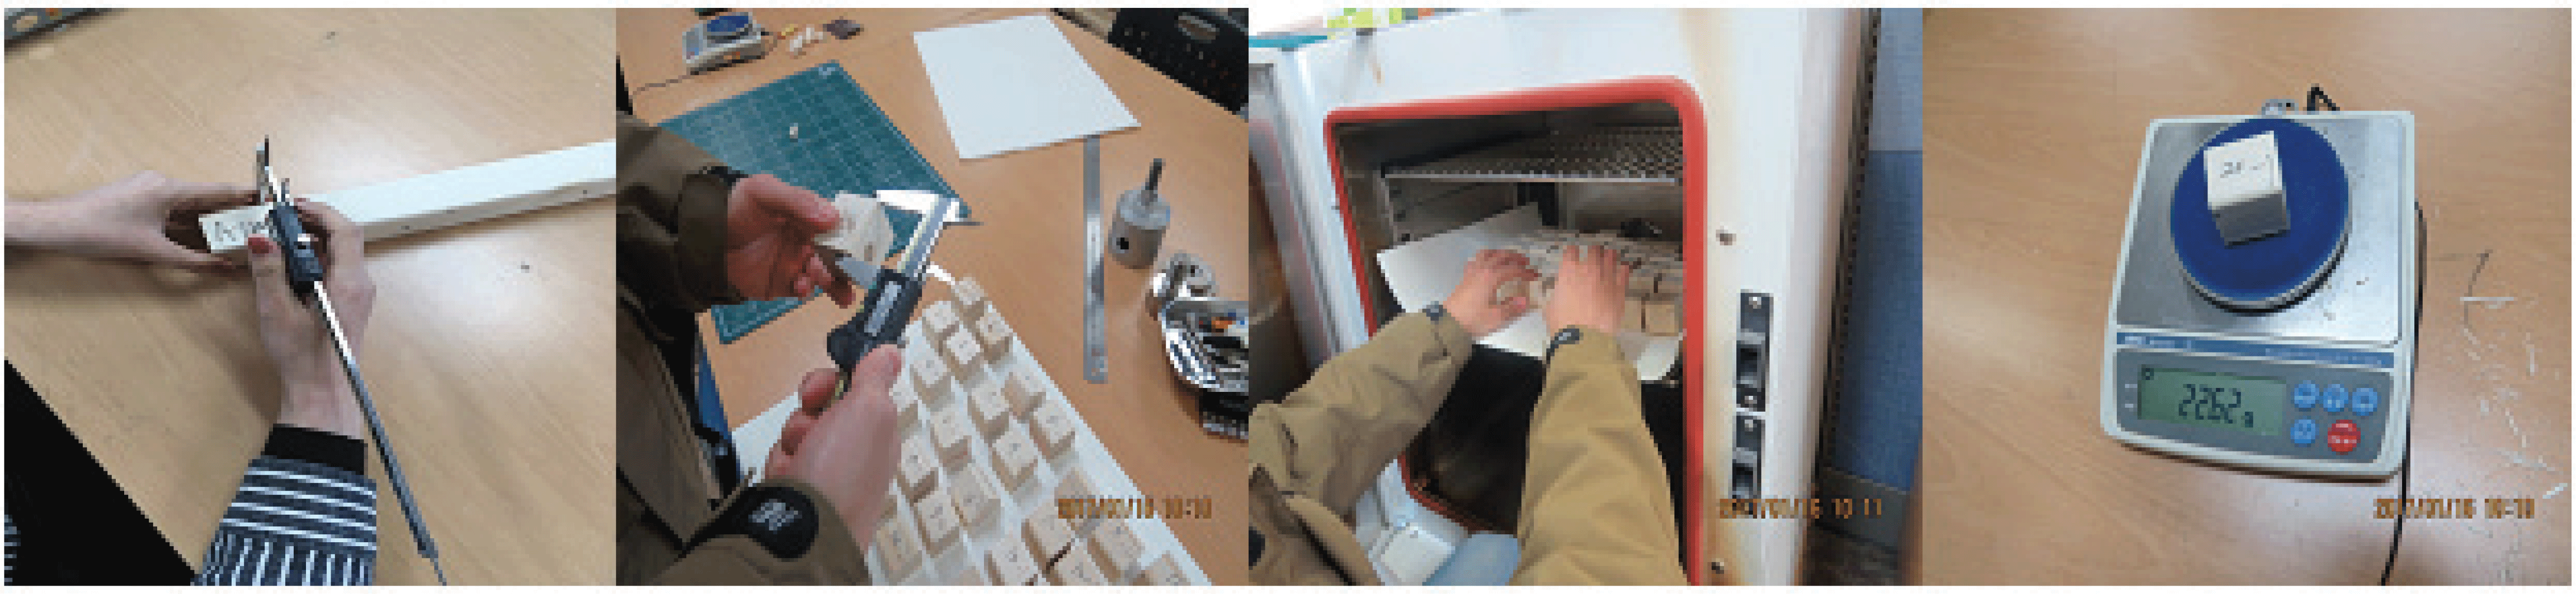
The weight loss was obtained by equation 1. A.W (After weight) is the test group’s weight, and B.W (Before Weight) is a control group’s weight. The weight loss was analyzed for comparison of physical properties. The weight of cutting specimens for moisture content’s test was used. Table 2.
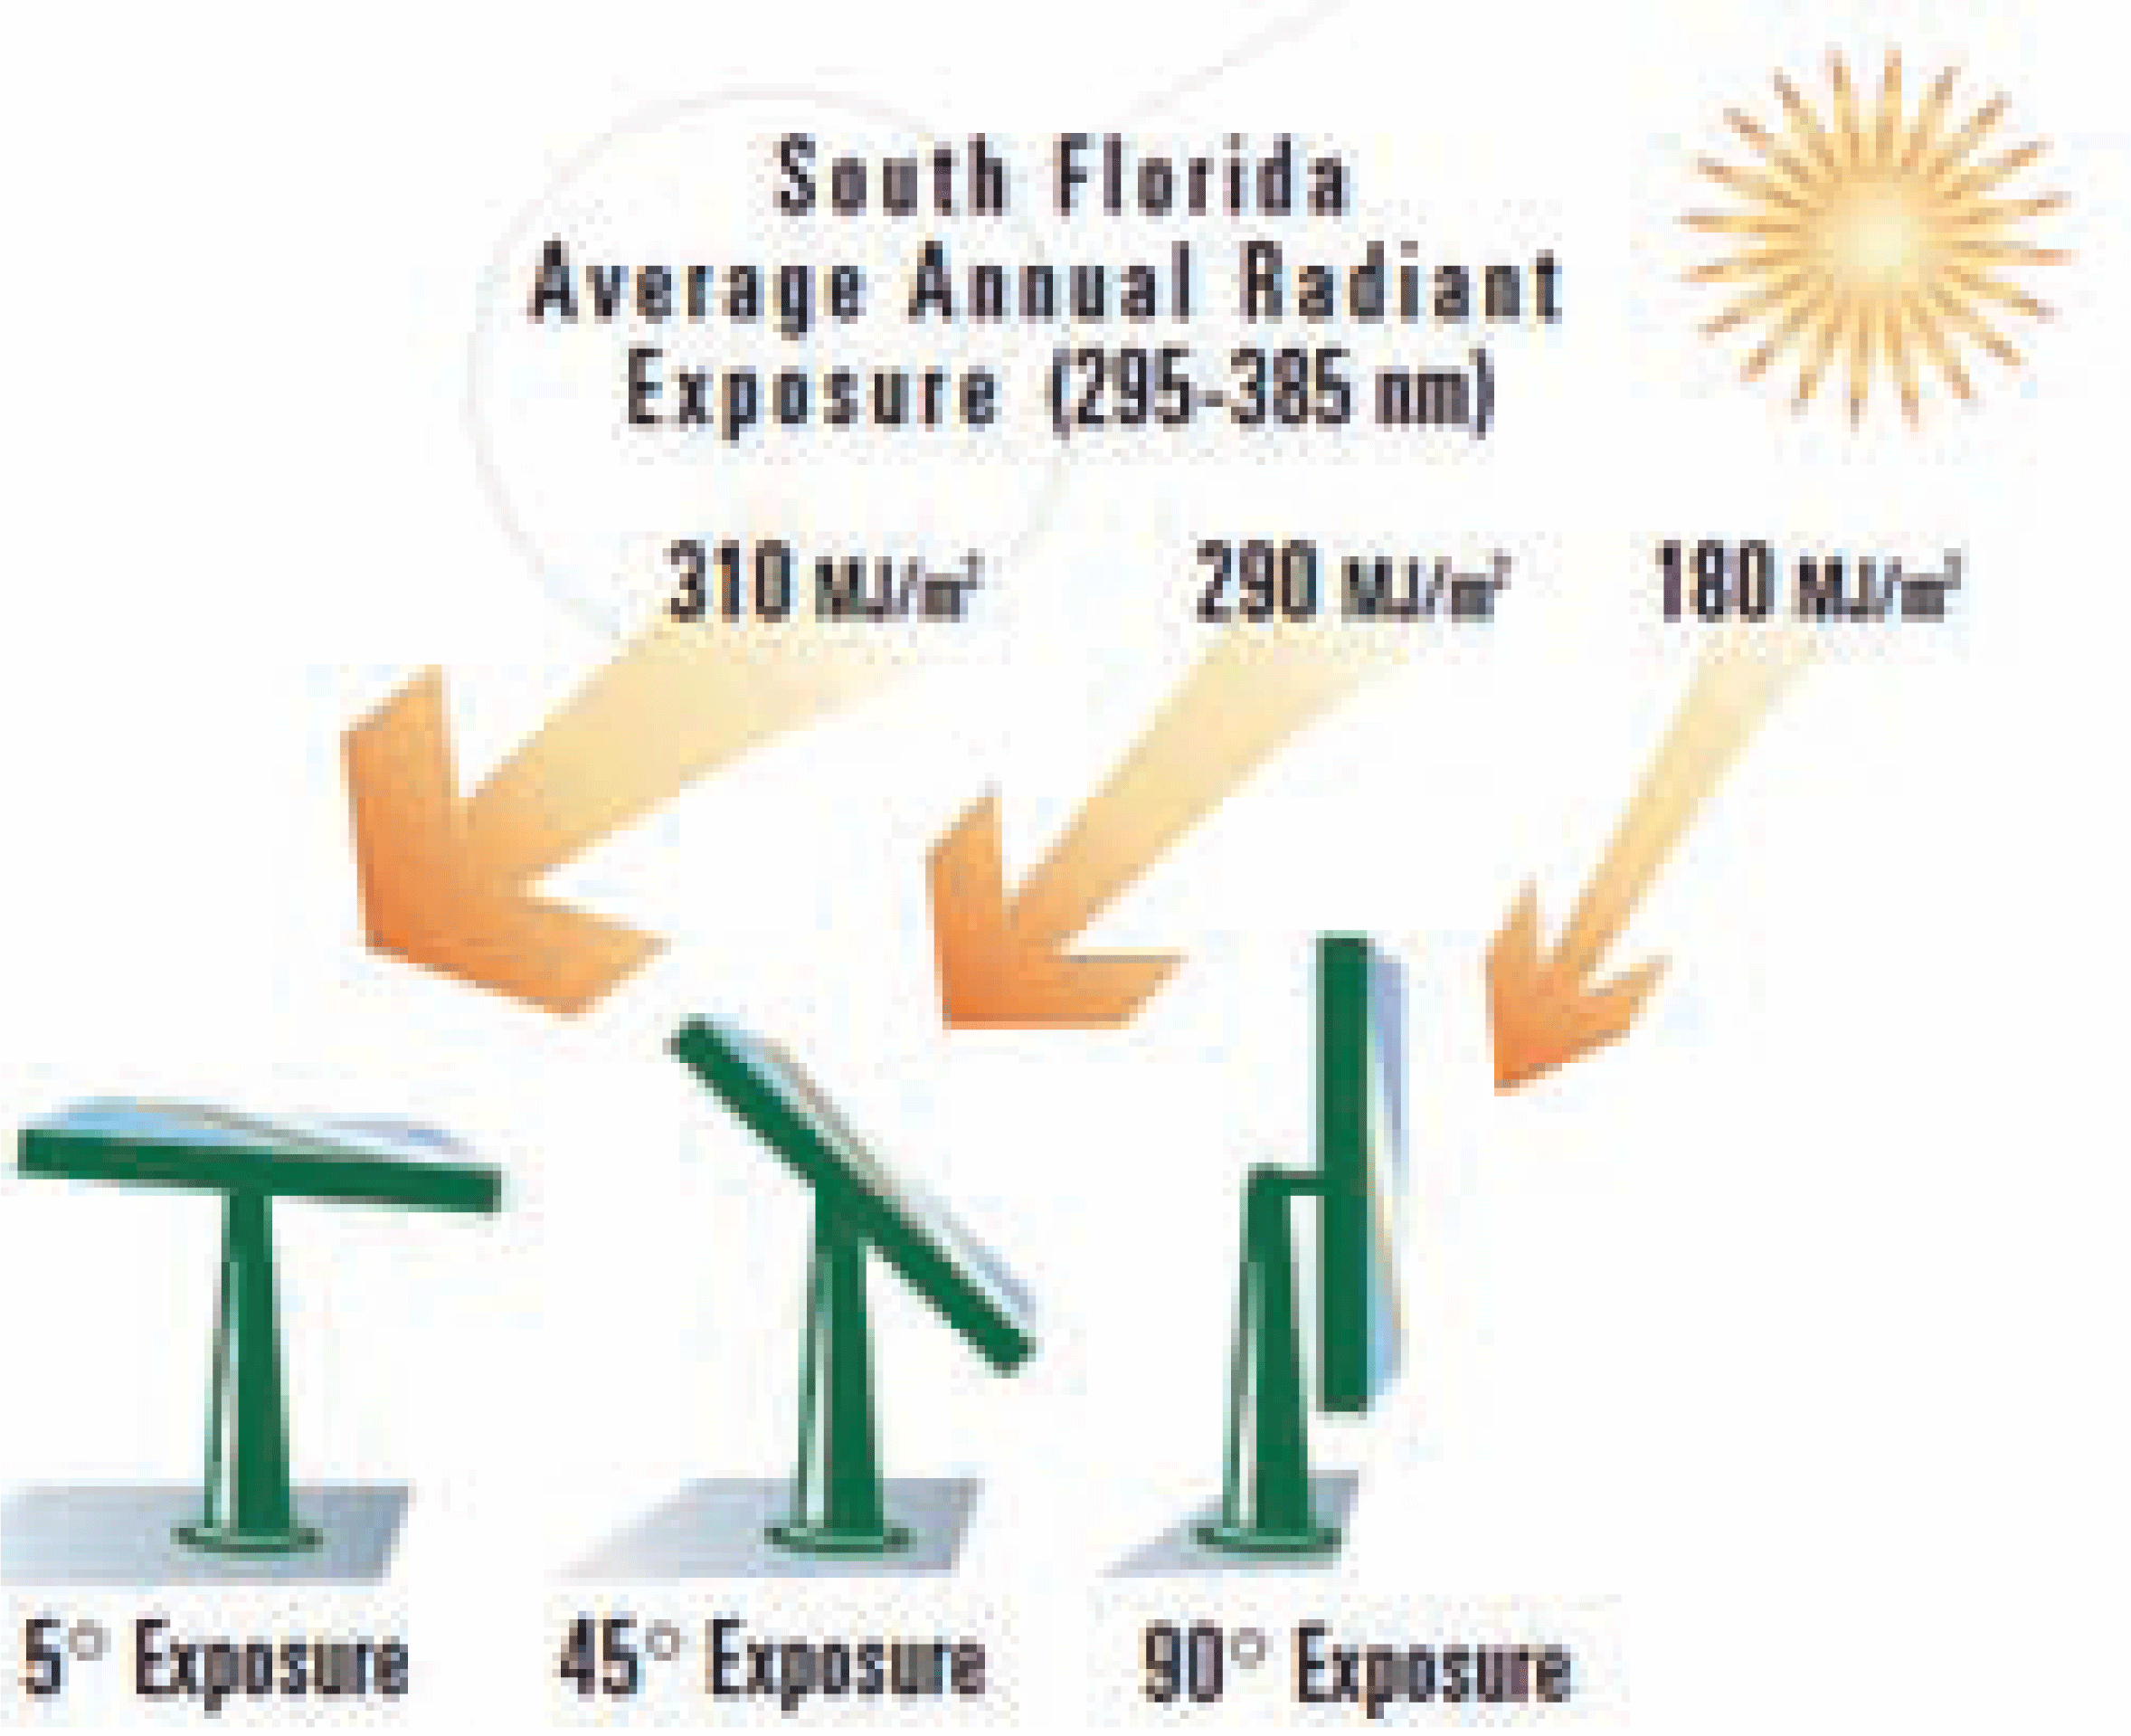
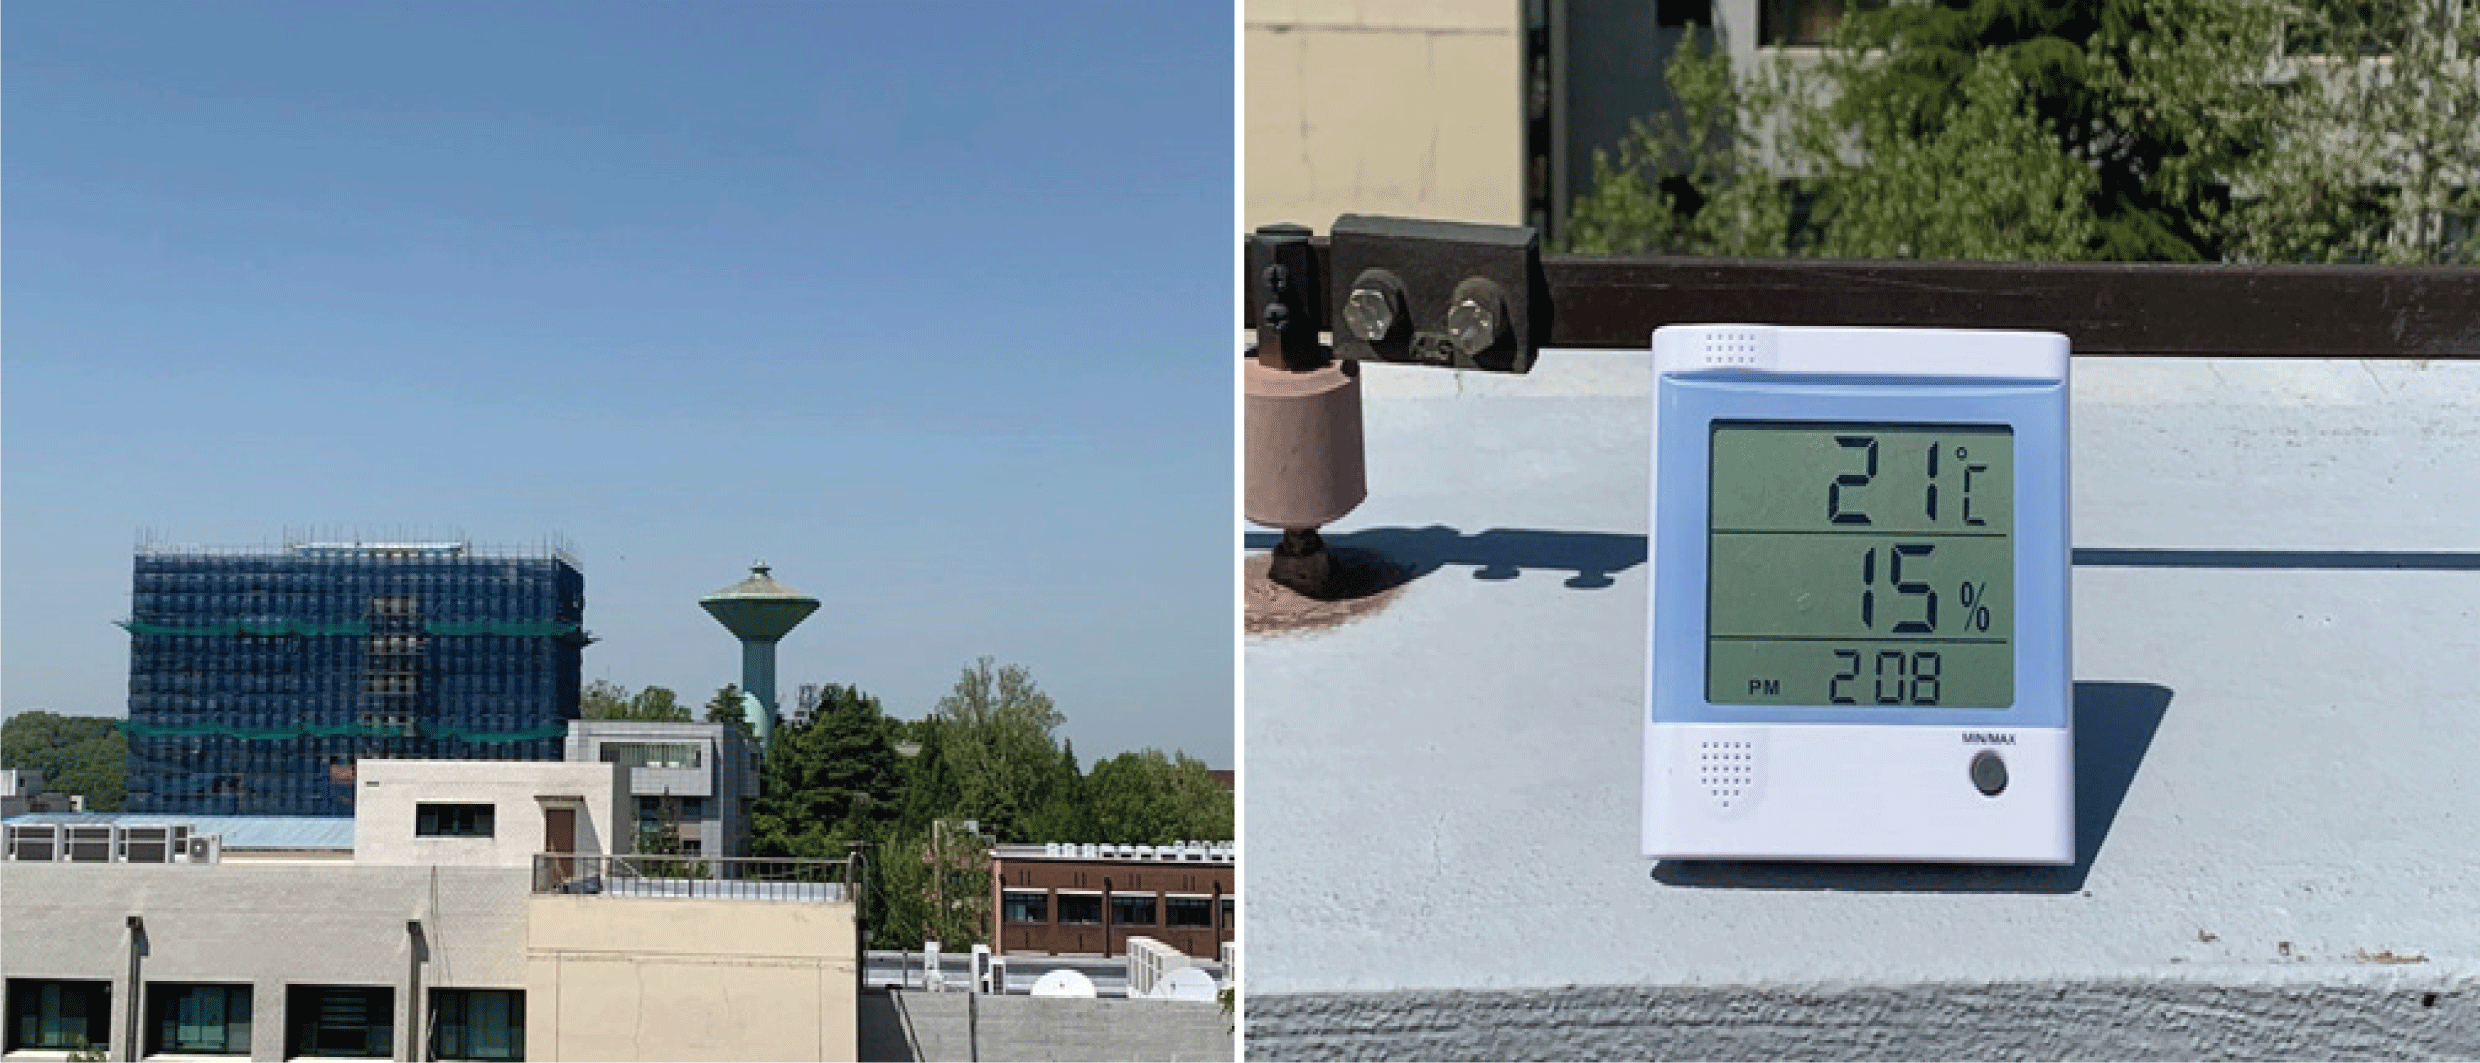
The outdoor exposure test was conducted on the rooftop of the Chonbuk National University, College of Human Ecology located in Deogjin-dong, Jeonju city, Northern Jeolla province. 10 test pieces were collected per month to measure physical properties. Daily weather indexes including the highest and lowest temperatures, humidity and ultraviolet ray amount were collected through the K-weather web-site, the online National Weather Service. In order to enhance confidence, an on-site measurement took place once every day at 2:00 PM. The testing bench for the outdoor exposure experiment consulted the Weathering Testing Guidebook published by the US company Atlas Electric Devices Company, and was tilted at -5 degrees from level, in order to maximize reception of solar radiation through reflection and direct rays at the testing (rooftop) environment with waterproof flooring (ASTM G 90, 2005; Raberg et al., 2005). In order to ensure all sides of the test pieces was evenly exposed to ultraviolet rays, all sides were turned over at a designated time once a week (ASTM G7/G7M-13, 2013).
Fig. 2 shows the angle at which solar radiation exposure could be maximized, according to the Weathering Testing Guidebook, and used the average radiant quantities of South Florida as the standard. Latitude is necessary when examining the difference between temperature and sun radiant quantities. However, the radiant quantities were not adapted because of little difference between the latitudes of Florida (31°) and Jeonju (35°). Fig. 3, 4 and 5.
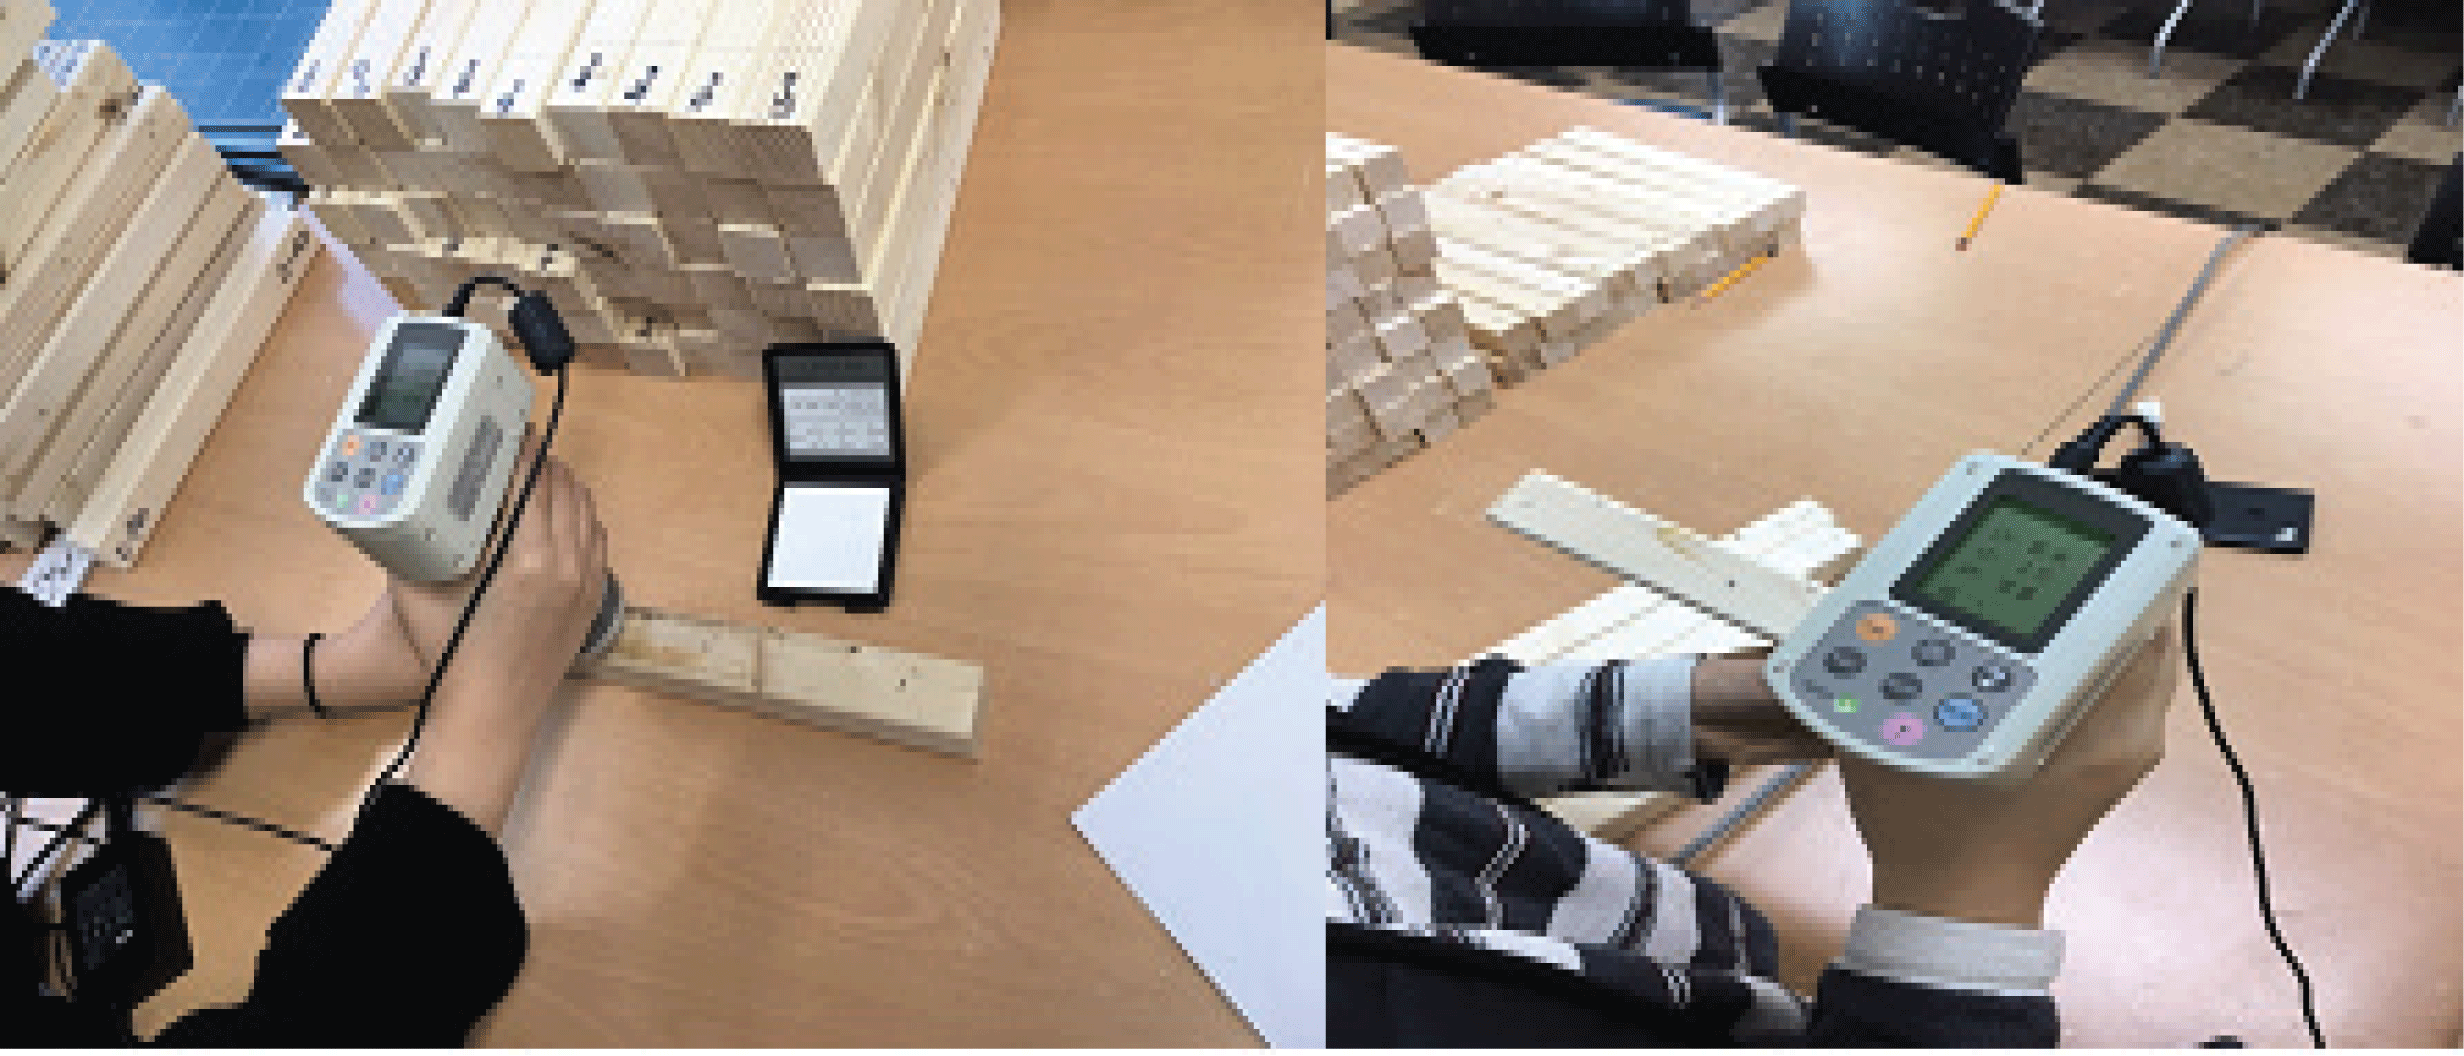
For the color difference test, 3 parts per test piece before and after outdoor exposure tests were measured using the color difference measurement device (model: CR-400). The color difference was observed for changes, categorized by L*, a* and b* and the degree of color change was obtained by solving for color difference value ΔE (Kim, 2012a; Lee et al., 2009).
3. RESULTS and DISCUSSION
Table 3 shows the physical properties of test pieces exposed to outdoor in one year. The length, thickness, weight, moisture content and density were measured and the averages data of test pieces per test groups were recorded (Park and Kim, 2014). The length, width and thickness of all test pieces showed almost no difference before and after the test. Alike other physical property indexes, density also showed little difference among test groups with an average of 0.42g/cm3(±0.04). Weight and moisture content showed large difference among test groups, and this is thought to be caused by the sensitivity to changes in daily range and rainfall (Feist and Hon, 1984; Feist, 1989). The average post-test moisture content of all test pieces was 14.00%(±3.70), which increased approximately 30% from the moisture content of the control group of 10.86%(±0.23). The months that showed the most difference in moisture content were May (8.59 %(±0.31)), and June (20.72% (±2.04)).
Table 4 shows the weight loss of test groups. May which shows the greatest weight loss, was measured the lowest moisture content. This is assumed to be the reason the dry atmosphere caused by the low rainfall, and the highest daily range led to the moisture of the wood to escape easily. Except for the beginning of an experiment, moisture content was the second highest in July when the weight loss was the lowest. (In June and July, there is not a large difference in moisture content by about 1%) In contrast to May, this is thought the wet atmosphere caused by the highest rainfall, and the lowest daily range made it difficult to move moisture inside the wood. As a result, it can be said that the weight loss and the moisture content are inversely proportional.
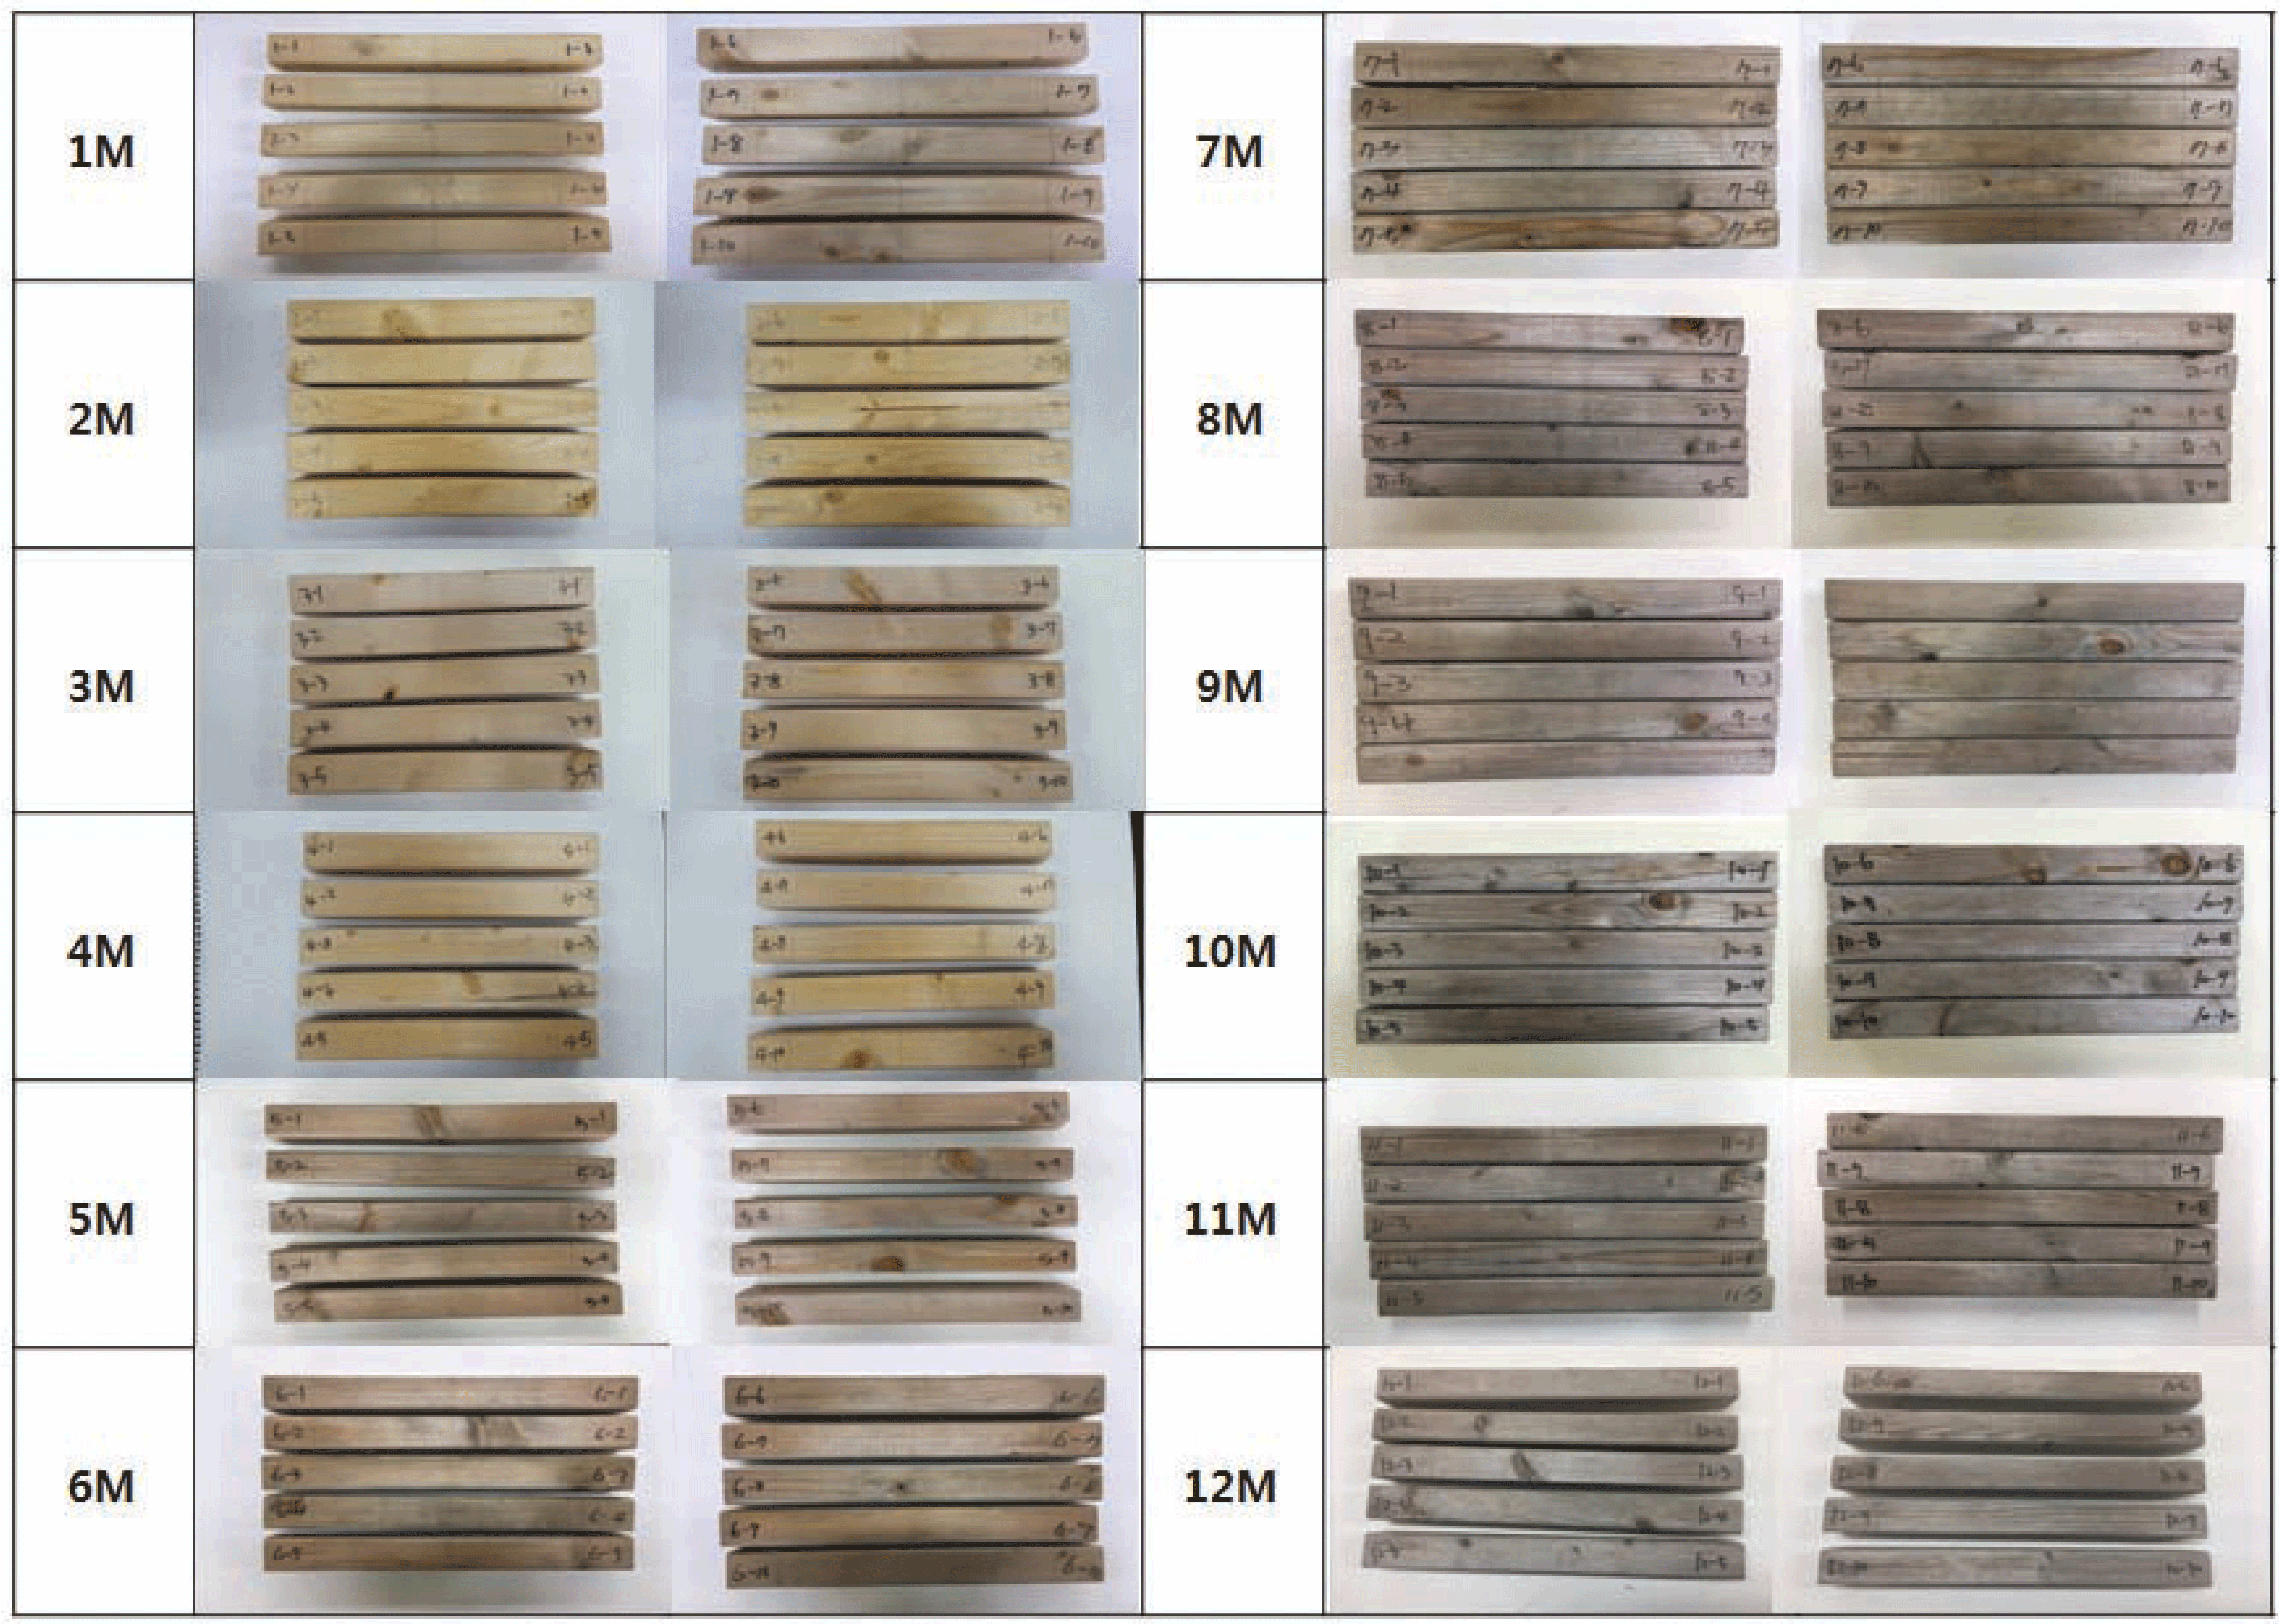
Fig. 6 shows the change in the appearance of test pieces according to outdoor exposure time, and Table 5 shows the average value of L*, a*, and b* values according to outdoor exposure time. In terms of appearance change, the original brown color of the test piece lightened into a greyish white after a year-long exposure (Chang et al., 2000). This change is likely due to the constant breakdown of lignin, a brown colored wood component, by ultraviolet ray exposure (Park et al., 2016; Derbyshire and Miller, 1981; Evans, 1989). The L* value that represents whiteness decreased by 25% post-test, and the a*, and b* values that represent redness and yellowness decreased by respectively 40% and 70%, causing the general color of the test piece to darken (Hidayat et al., 2017). The degree of decrease in the L* and b* values actually diminished with time (Hon and Minemura, 1991). This can be attributed to the diminished amount of lignin being broken down (Evans et al., 2000), compared to the initial stages, and is expected to decrease even more with more exposure time (Evans et al., 2008).
The color difference value was obtained by equation (2) using the difference of whiteness, redness, and yellowness measured pre and post outdoor exposure test.
L*1, a*1 and b*1 are initial values before the test, and L*2, a*2 and b*2 are values that had changed after the tests. All color difference values showed a general increase with the progression of the test, as shown in Table 6. According to the N.B.S (National Bureau of Standard) that show the degree of perception according to color difference value, only the value measured during the first month into the test, 10.85, was included in the categorized item and showed considerable color change (Hon et al., 1986). Measurements taken after the initial month were no less than 12; they were not categorized but one could see that very much color change took place. In terms of the degree of monthly difference in color difference value, the two months between May and July were measured around 9, which mean the degree of change was larger than that of other months. We explored the cause through virtual data analysis.
| ΔE | |
|---|---|
| 1M | 10.85(±1.70) |
| 2M | 14.89(±5.07) |
| 3M | 17.54(±1.82) |
| 4M | 17.27(±1.94) |
| 5M | 18.77(±2.75) |
| 6M | 25.3(±4.27) |
| 7M | 27.23(±2.35) |
| 8M | 25.21(±2.18) |
| 9M | 26.7(±5.51) |
| 10M | 24(±9.48) |
| 11M | 22.81(±10.29) |
| 12M | 29.43(±9.60) |
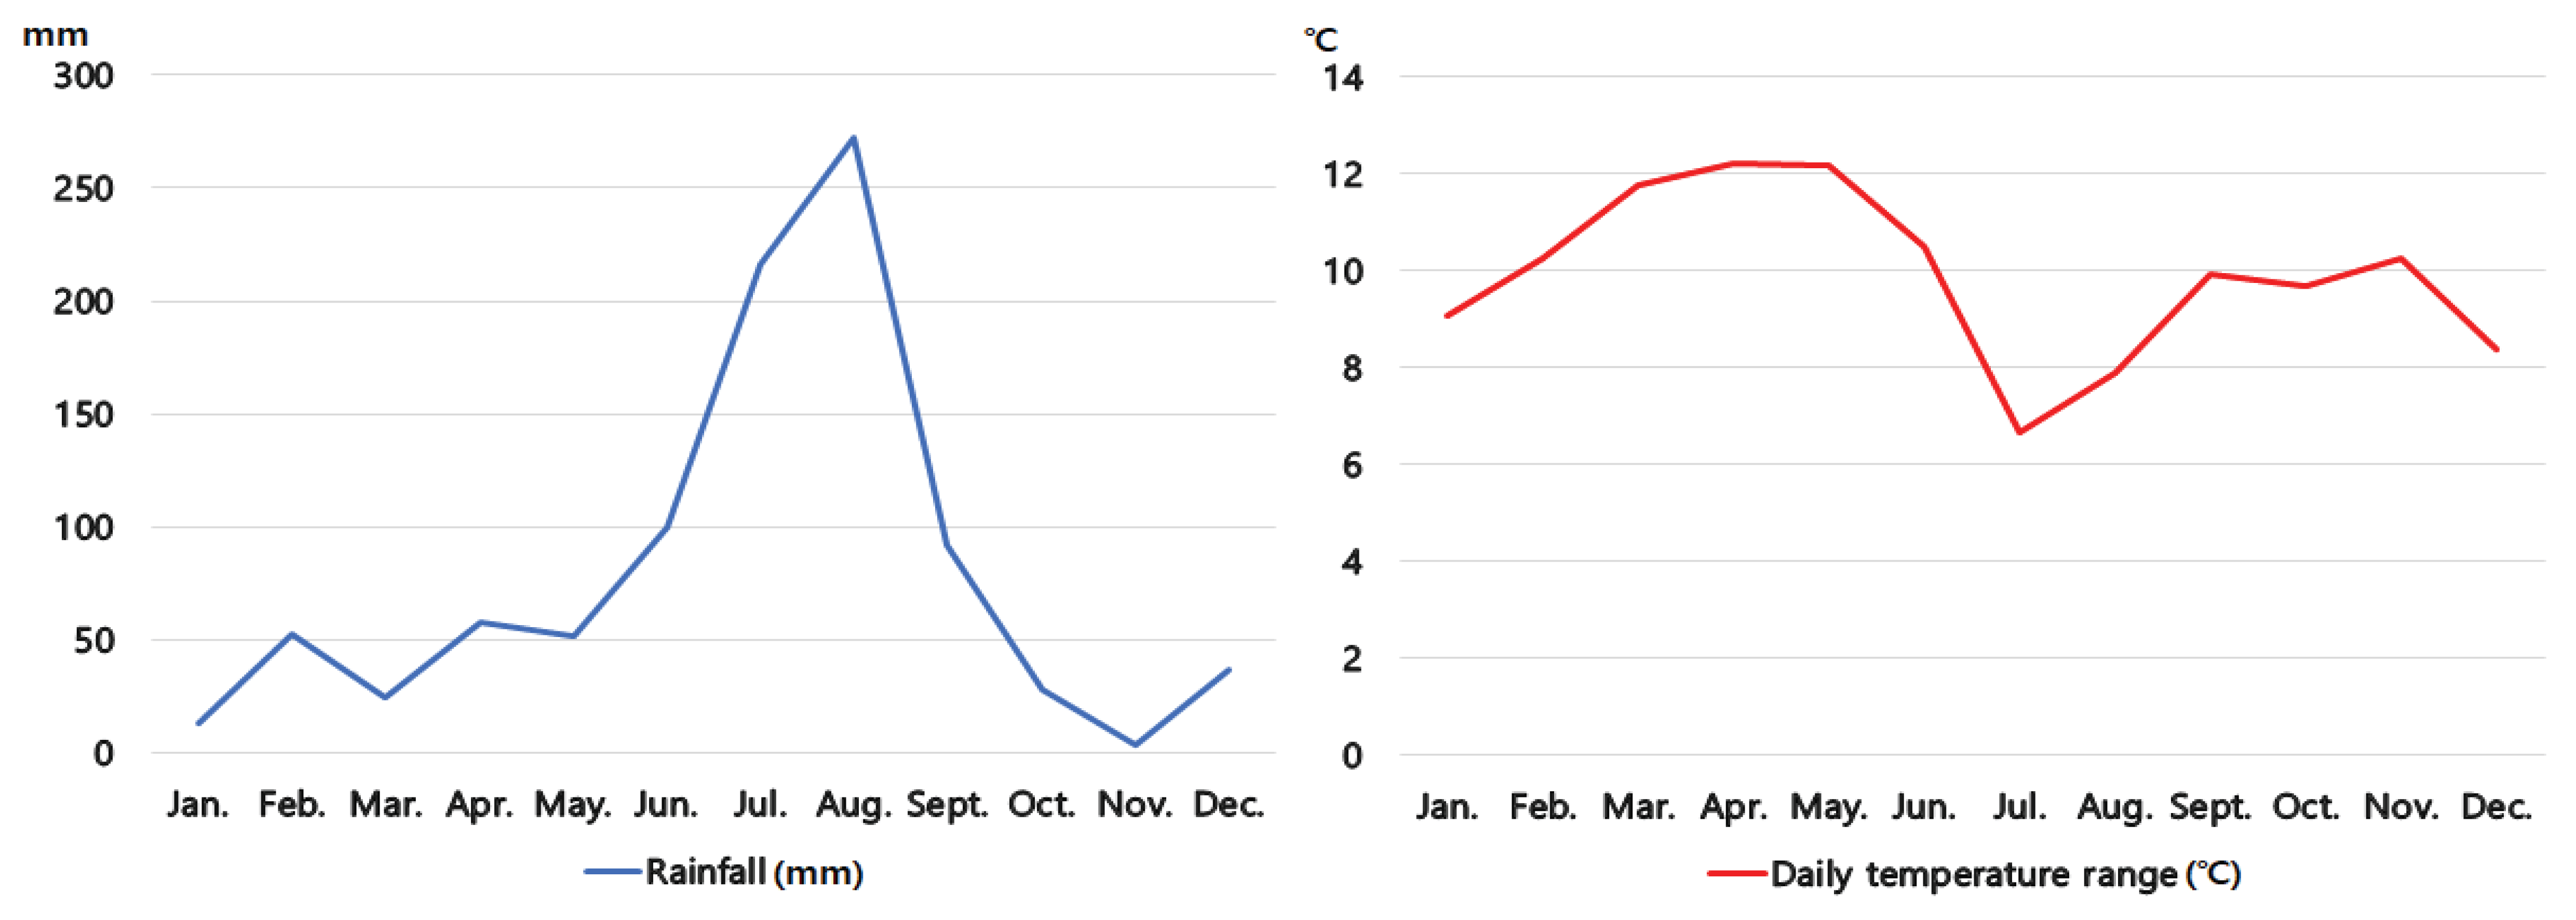
Fig. 7 is a graph that shows the average daily range and rainfall during the year of the experiment (Son et al., 2016; Ra, 2018). It can be seen that during the two months with the most color difference value difference, the line graph fluctuates drastically, with rapid increase and decreases. Months between May and July are summer in the Korean peninsula, and a period where many weather characteristics such as monsoons and tropical nights take place. The daily range graph shows that July is the month with the least daily range throughout the year. July is also the hottest month of the year, the average temperature being 27.1°C. In other words, it was hot all day and all night, steadily maintaining high temperature across hours. Exposure to higher temperatures can lead to degradation and change of hemicelluloses, and even cellulose, that affect (mainly deleteriously) the properties of the cell wall and the wood (Hills, 1984). And the lignin is mainly degraded due to its capacity to absorb light in short wavelength with a peak at 280 nm (Cogulet et al., 2016). It is therefore inferred that the high temperature activated molecular activity of the wood and the long daytime hours resulted in longer exposure to ultra violet rays, accelerating the speed of lignin breakdown (Miniutti, 1967; Evans et al., 1993; Evans et al., 1996). Moreover, the loss of decomposed lignin on the surface is accelerated during the rainy season, contributing to even larger differences of color difference value. Table 7.
| Sensitive expression of color difference | |
|---|---|
| 0.0 ~ 0.5 | Trace |
| 0.5 ~ 1.5 | Slight |
| 1.5 ~ 3.5 | Noticeable |
| 3.0 ~ 6.0 | Appreciable |
| 6.0 ~ 12.0 | Much |
| 12.0 ~ d | Very much |
An F-test was conducted in order to verify the significance of the measured color difference value (Kim and Park, 2015a; Kim and Park, 2015b). As there were a total of 12 test pieces tested, an analysis of variance was conducted in order to compare the averages of more than two groups (Kim and Kim, 2016). Table 8.
A significant verification took place, in order to verify change among 12 test groups tested in the same location but with different outdoor exposure time. Results revealed a significant change, as the F value exceeded its critical, rejecting null hypothesis and the P value was considerably smaller than 0.05. This indicates that the experiment was appropriate, as changes existed among test groups of different exposure time. In other words, outdoor exposure time has a great impact on the color difference value of each test group.
The factor that was thought to have deteriorated from weather and have a big influence on the color difference value of the outdoor exposure test was the lignin in the wood. As lignin is a brownish substance in wood, this study assumed a relationship with the a* value that shows redness, and conducted a multiple regression analysis between a* value, daily range, rainfall and ultraviolet index.
Table 9 shows the result of the multiple regression analysis. The M.R2 was 0.57, producing a regression model with a fair amount of explanation power. The significant F was 0.01, smaller than 0.05, indicating that among various independent variables including daily range, rainfall and ultraviolet index, there exists a variable that affects the a* value, the dependent variable. Table 9 shows that among the three independent variables, only the P value of daily range is smaller than 0.05, having a significant impact on the dependent variable, the a* value. In other words, daily range has a statistically greater effect on a* value that shows redness, compared to other weather factors. After the multiple regression analysis, a simple regression analysis was carried out between the significant independent variable of daily range and the dependent variable of a* value.
| REGRESSION ANALYSIS STATISTIC | |
|---|---|
| MCC | 0.83 |
| R2 | 0.69 |
| M.R2 | 0.57 |
| SE | 0.75 |
| COUNT | 12 |
| ANOVA | |||||
|---|---|---|---|---|---|
| df | SS | MS | F | Significant F | |
| Regression | 3 | 10.26 | 33.42 | 6.03 | 0.01 |
| Within groups | 8 | 4.53 | 0.56 | ||
| 11 | 14.79 | ||||
Table 10 shows the result of the simple regression analysis, in which the M.R2 is 0.58, indicating a fair amount of explanation power like the multiple regression analysis. The P value is smaller than when other independent variables are present, which shows a greater influence on the dependent variable. Estimation of the regression equation through simple regression analysis is as the following.
| REGRESSION ANALYSIS STATISTIC | |
|---|---|
| MCC | 0.79 |
| R2 | 0.62 |
| M.R2 | 0.58 |
| SE | 0.74 |
| COUNT | 12 |
| ANOVA | |||||
|---|---|---|---|---|---|
| df | SS | MS | F | Significant F | |
| Regression | 1 | 9.26 | 9.26 | 16.77 | 0.002 |
| Within groups | 10 | 5.52 | 0.55 | ||
| 11 | 14.79 | ||||
| C | SE | t | P-value | Low rank 95% | High rank 95% | Low rank 95.0% | High rank 95.0% | |
|---|---|---|---|---|---|---|---|---|
| Y (a*) | -1.44 | 1.31 | -1.10 | 0.29 | -4.37 | 1.48 | -4.37 | 1.48 |
| Daily temperature range (°C) | 0.53 | 0.13 | 4.09 | 0.002 | 0.24 | 0.82 | 0.24 | 0.82 |
In the estimated regression equation, the x value represents daily range, the independent variable. According to regression equation 3, the value, the dependent variable and x, the independent variable, are in a proportionate relationship, which means the a* value also increases as the x value increases. In other words, the larger the daily range, the larger the redness. As the months between March and June shows the greatest daily range throughout the year, the a* value in the same period is much as three times higher than in other months (Ra et al., 2012). When compared with the estimated regression equation, it is thought that the breakdown of lignin accelerates during this period, causing the inner lignin to migrate to the surface and affect the a* value of redness.
Whereas this study was only able to take a yearlength outdoor exposure test for statistical analysis, changes are expected in types and influence of independent variables as longer outdoor exposure time amasses more data and the total lignin amount in the wood decrease.
4. CONCLUSION
This study derives its importance in securing a database on the little-studied remaining life of outdoor exposure wood, for the maintenance of full size wooden members in the traditional sense and for the increase in wooden constructions demand by securing safety in the modern sense.
This study presents the following conclusions.
The length, width and thickness of all test pieces showed insignificant changes pre and post-test, but the weight and moisture content, affected by daily range and rainfall, showed large differences across different test groups. Also, it can be showed that the weight loss and the moisture content are inversely proportional.
L*, a*, and b* values that represent color difference generally decreased post-test. The degree of decrease in L* and b* values tended to diminish with time, which is likely due to the decrease in total lignin amount compared to the initial stages of the test.
Color difference value was greatest between May and July. This period is when daily range and rainfall fluctuates the most. July is also the month with monsoon and the highest monthly average temperature, which accelerated the cycle of lignin breakdown and loss in the wood, causing the greatest color difference value.
A significance verification showed that outdoor exposure time and color difference value showed a statistically significant difference.
A multiple regression analysis between a value, a redness indicator that gauges the degree of the brownish lignin, daily range, rainfall and ultraviolet index showed that daily range had the biggest influence on redness. The daily range and redness in the estimated regression equation were in a proportionate relationship, confirming that the increase in daily range also meant an increase in redness value.
Changes are expected in types and influence of independent variables on color difference, as longer outdoor exposure time amasses more data and the total lignin amount in the wood decrease.