
1. INTRODUCTION
Charcoal is a fuel typically produced by carbonization of biomass under controlled conditions in an oxygen-poor closed space such as the charcoal brick kilns (FAO, 1987; de Carvalho et al., 2013; Chidumayo and Gumbo, 2013; Menemencioglu, 2013; Magnone et al., 2016). When this process is performed at high temperature, it produces solid (charcoal), liquid (water and organics), gas (CO, CO2, CH4, H2), carbonaceous aerosol pollutants (Organic Carbon or OC, Elemental Carbon or EC, etc.) and particular matters (PM2.5 and PM10) and those compositions are strongly dependent on the nature of feedstock, the process conditions, kiln types, carbonization temperature and the adopted technologies (FAO, 1987; Madani et al., 1992; Jo et al. 2005; Lee and Kim, 2010a; Lee and Kim, 2011; de Carvalho et al., 2013; Chidumayo and Gumbo, 2013; Jeong et al., 2016; Magnone et al., 2016; Yang et al., 2017; Kang et al., 2018).
In this work, we focus our attention on the in-situ analysis of carbonaceous aerosol emissions during the production process of the commercial charcoal kiln from common Korean oaks - also called Quercus spp (Lee and Kim, 2010b) - in different charcoal-making kilns commonly used in different areas of the Korean peninsula. In particular, the comparative analysis presented in this work is made between seven charcoal production sites (N=7) all specialized in the production of the charcoal kiln for a traditional Korean sauna. The work was focused on the investigation of these carbonaceous aerosol pollutant emissions because there is a potentially negative effect on charcoal workers (Kato et al., 2004; Kato et al., 2005; Naeher, 2007; de Carvalho et al., 2013; Menemencioglu, 2013) as well as on the environment (Chidumayo and Gumbo, 2013). Furthermore, this work is also an interesting example of a case study that focuses on a primary sector like woodbased production engineering (fuelwood and charcoal) in the South Korea context. As reported, the Statistics Division of Food and Agriculture Organization of the United Nations (FAO), the average national consumption of charcoal can be estimated to be around 3 kg per person per year. These data suggest that the information available about national production of carbonaceous aerosol emissions in a commercial charcoal kiln production context is not an abstract or academic question but a concrete one (Chidumayo and Gumbo, 2013; Menemencioglu, 2013; Kwon et al., 2018). A national political perspective, it can used to mitigated the damage of global warming (Lacaux et al., 1994; Jacobson, 2002) and, from a sociological perspective, it is an essential comparative tool for protecting healthcare charcoal workers (Madani et al., 1992; Kato et al., 2004; Kato et al., 2005; de Carvalho et al., 2013; Menemencioglu, 2013) as well as end users (Naeher et al., 2007; Pandey et al., 2009; Kabir et al., 2011). In particular, diseases like chronic obstructive pulmonary disease (Orozco-Levi, 2006), increasing respiratory symptoms and decreased pulmonary function (Tzanakis, 2001) is of great concern. These factors, climate change, and human health issues, gives us insight into the importance to determine the exact amount of carbonaceous aerosol pollutions generated from charcoal production.
Data on the carbonaceous aerosols generated from charcoal production plants in the South Korea context is yet to be fully understood. In this context, South Korea has been used as a case study with the aim of elucidating the potential impact of carbonaceous aerosol pollution emitted during the charcoal kiln manufacturing processes on the atmospheric environment. The emission factors for charcoal production have been studied in a number of previous investigations including in charcoal-making kilns commonly used in Turkey (Menemencioglu, 2013), Thailand (Smith et al., 1999), Kenya (Pennise et al., 2001), Zambia (Bertschi et al., 2003), Spain (Pastor-Villegas et al., 2006), Brazil (Pennise et al., 2001; de Carvalho et al., 2013), Rwanda (Nahayo et al., 2013), Burkina Faso (Yamamoto et al., 2014), Latvia (Klavina et al., 2016), Indonesia (Park et al., 2018), and so on. It can be noted here that none of these studies, however, have investigated in situ the carbonaceous aerosol emissions - defined here as organic carbon (OC) and elemental carbon (EC) concentrations as well as the PM2.5, PM10, CO, NO, and SO2 concentrations and consequently the calculated PM2.5 (gPM2.5/kg-oak), PM10 (gPM10/kg-oak), CO (gCO/kgoak), NO (gNO/kg-oak), SO2 (gSO2/kg-oak), OC (gOC/ kg-oak) and EC (gEC/kg-oak) emission factors - emitted from the charcoal-making sites. In this regard, the purpose of this study is (1) to investigate in situ the comparative importance of the carbonaceous aerosol pollution generated from seven Korean charcoal-making kilns on the atmospheric environment during the charcoal-making period. In the second section of this paper (2) we present the main results of this study regarding the PM2.5, PM10, CO, NO, SO2, OC and EC emission factors (i.e., grams - g - of a single compound emitted per kilogram - kg - of oak consumed to the aim to obtain the final charcoal) over Korean charcoal-making kiln cases (N=7).
2. MATERIALS and METHODS
The charcoal production process can be divided into several stages (Chidumayo and Gumbo, 2013). Fig. 1 shows the general production steps that are common to all charcoal production sites. According to the aim of this study we selected seven (N=7) charcoal sites as follows: traditional kiln characterized by an uncontrolled batch technology without any treatment of emissions and low oak weight per process (Gyeongsan Province, coded YC#1), traditional kiln that uses the wet scrubbing process for gaseous control and characterized by a high number of kilns in the same site (Gangwon province, coded HS#1), traditional kiln that uses the wet scrubbing process and characterized by a low number of kilns in the same site (Chungcheong, coded JC#1), traditional kiln that uses the wet scrubbing process and characterized by a low number of kilns in another province (Gyeonggi, coded YJ#1), traditional kiln that uses a process for treatment of emissions (Gyeonggi, coded YP#1), traditional kiln without any treatment of emissions and high oak weight per process (Gyeonggi, coded GP#1), and then a modern charcoal plant characterized by a gasification apparatus (Gyeonggi Province, coded HN#1). The charcoalmaking sites are selected from an open call, distribution across the country (i.e., province), technological factors (i.e., treatment of emissions, oak weight per process, number of kilns), and typologies (i.e., the end-use of the product in general), such that the selected sites are representative of the overall national productions. While there is certainly room for improvement, the validity of the proposed method appears acceptable for analytical and statistical purposes. Details of the technological characteristics of selected wood charcoal production sites are schematically shown in Table 1. For instance, oak weight stored into a single charcoal-making kiln displays values ranging between 1000 kg of YC#1 site with 4 kilns and HS#1 site characterized by very high oak weight per process (10500 kg) with 38 kilns. More specifically, from Table 1 it is clear that - apart from treatment of emissions - these there is a similarity between YC#1 and HN#1 associated with all variables (process, the number of kilns, oak weight per process, charcoal making period and final use of obtained charcoals). The traditional kiln located in Gyeongsan Province, and here coded as YC#1, has an inner diameter of about 3.0 m, a height of about 1.8 m and an internal volume of about 12.7 m3. However, without regard to the treatment of the emissions, the modern kiln located in Gyeonggi Province (HN#1) has an internal diameter of about 2.0 m, a height of about 2.0 m, and the interior volume of about 6.3 m3. The size of the room for the charcoal-making process in the YC#1 site is exactly two times smaller than the HN#1. The ignition times for old YC#1 and modern HN#1 are 4 and 2 hours, respectively. Six days (with a range from five to seven days) and three days are the time taken for the carbonization process to produce charcoal in the case of YC#1 and HN#1 sites, respectively. In this way, the sites coded YC#1 and HN#1 are selected as case studies in the last section of this work to demonstrate the different levels of emission factors of charcoal-making kilns.

In order to investigate the potential effect of physical and chemical characteristics of fuelled oak and obtained charcoal in and from above selected seven kilns, the calorie value (kcal/kg) and chemical compositions (C%, H%, N%, and O%) were determined before and after the charcoal-making kiln process based on the experiences in the previous studies (Magnone et al., 2016). Briefly, the calorific values were determined using the IKA-Kalorimeter system (IKA-C2000, Germany) controlled by software (C 5040 CalWin).
The air pollutant gases (like CO, NO, and SO2) emitted during the charcoal production process was monitored by an ENERAC Model 500 combustion analyser (ETR, 1980). The PM2.5 and PM10 cyclone (PM10 Cyclone package, USA, Clean DAE) were used as required by EPA's guidance (Hartman et al., 1989; EPA, 2010, Magnone et al., 2016).
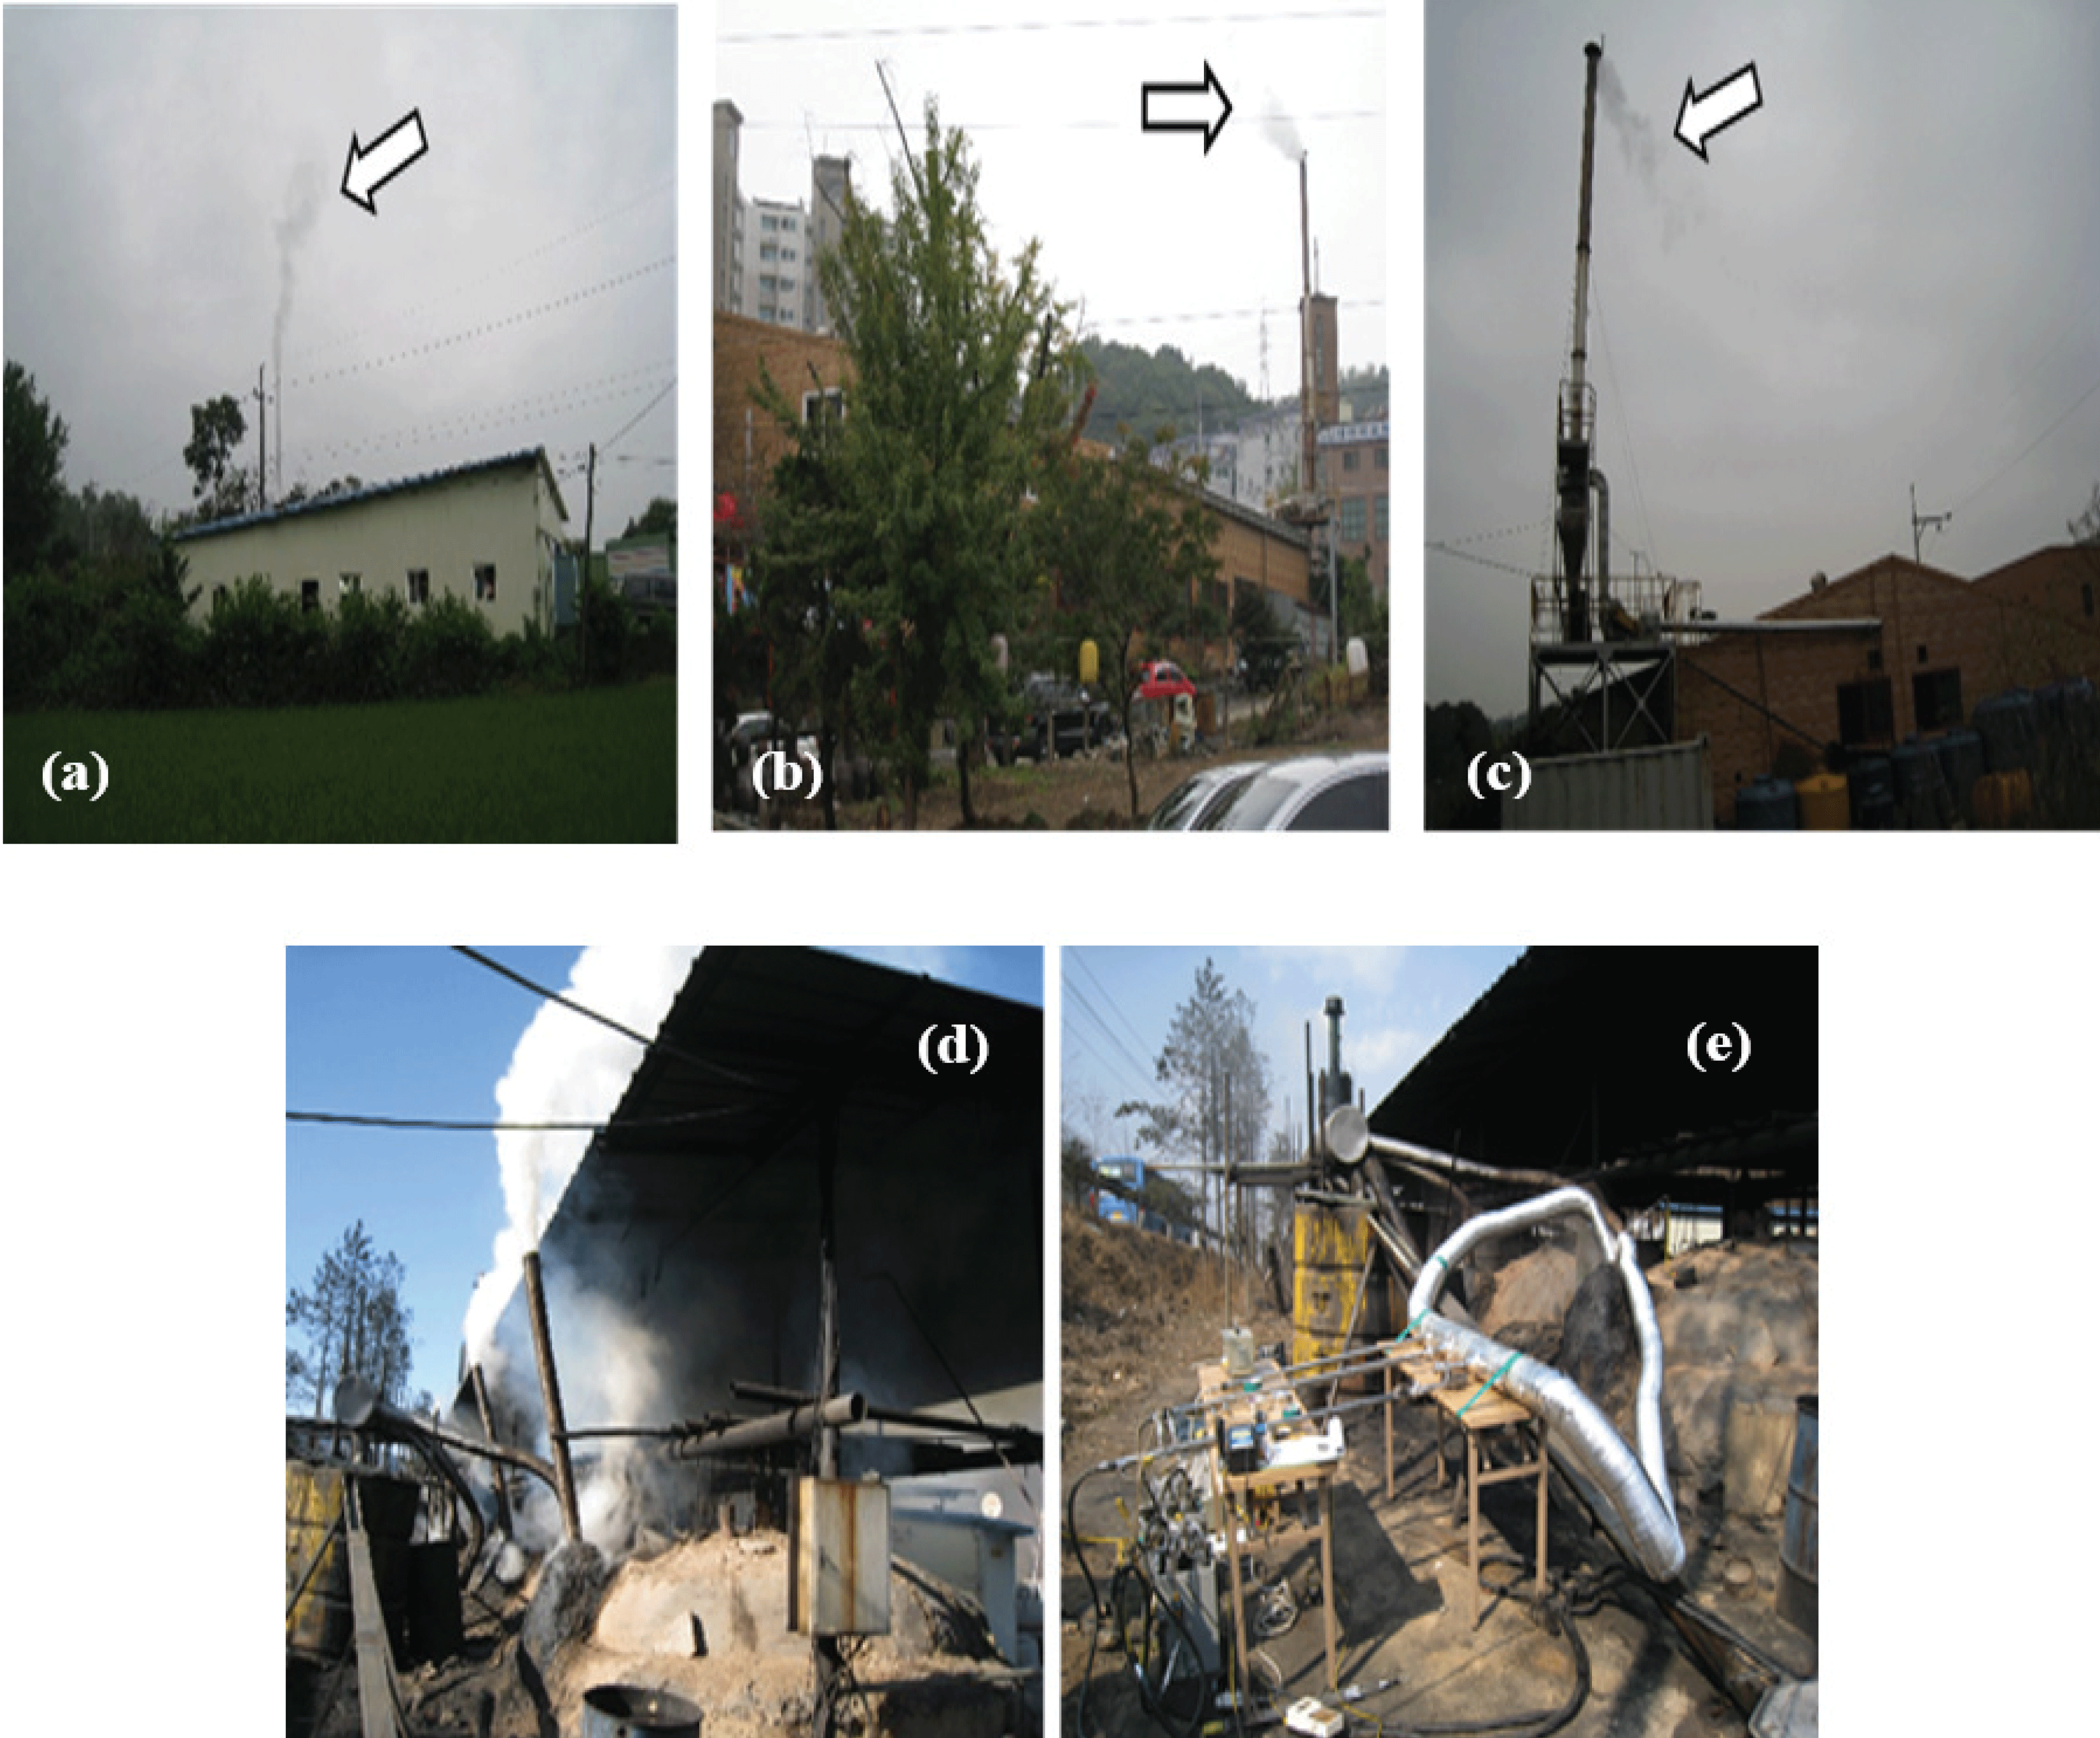
In this work, the emissions during a production period from selected seven charcoal-making kilns was collected in-situ by a total collection hood. Typical carbonaceous aerosol pollutions emitted from the charcoal-making kilns during a charcoal production period are shown in Fig. 2 (a, b, c). The detailed procedure, experimental equipment and set up for Method 5H without dilution ratios was described by U.S. Environmental Protection Agency (EPA) Test Mythology (Method 5G) (Hartman et al. 1989; EPA 2010) and in a previously published work (Magnone et al., 2016). An example of the difference between before and after the start of the collections and analysis of the emissions in the case of a traditional kiln during the charcoal production collocated in Gyeongsan Province (YC #1) with a total collection hood (Hartman et al., 1989; EPA, 2010; Magnone et al., 2016) is shown in Fig. 2 (d, e). The in situ analysis of organic carbon (OC, mg/m3) and elemental carbon (EC, mg/m3) constituents of atmospheric aerosols during the production process, including all emissions from start-up to shutdown step, was done using the DRI Model 2001 Thermal/Optical (TOR/TOT) analyser of Aerosol Filter Samples using the IMPROVE_A Method (DRI 2005). The gas sampling apparatus is positioned at about 5 meters in front of the exit of the kiln exhaust gas, where the temperature is between 50°C and 80°C. Specifically, the concentrations (mg/m3) are used to express the aerosol constituents in the filter cake obtained after combustion process in a given charcoal production plant considering the surface of the filter and the air volume. These concentrations - derived from the weight per surfaces of the filter (μgC/m2) - were determined by DRI measurements as already reported in the literature (Magnone et al., 2016). All calculated emission factors were standardized according to the grams of a given emission per kilogram of oak wood consumed (g/kg). The total carbon (TC, gTC/kg-oak) factor was calculated as the sum of the OC and EC components (Magnone et al., 2016).
3. RESULTS and DISCUSSION
Table 2 shows the physical characteristics of fuelled oak and obtained charcoal in and from the selected seven charcoal-making kilns. The calorie value of fuelled oak in Gyeongsan Province (YC#1) is lower than the value obtained from the wood used in Gyeonggi Province (HN#1). It could also be noted here that the calorific values of obtained charcoal in the selected plants are similar, with a difference between, for example, YC#1 and HN#1 of about 0.5%. For all selected sites, the mean calories values of fuelled wood and obtained charcoal were found to be 4185 kcal/kg with a standard deviation of 201 kcal/kg and 7039 kcal/kg with a standard deviation of 359 kcal/kg, respectively. This means that the calories value of fuelled woods is in good agreement with the experimental value recently obtained by Magnone et al. (2016). The chemical characteristics of both the oak (in) and the obtained charcoal (out) are also summarized in Table 2. The characteristics of oak samples were very similar between the selected sites with carbon contents that range from 41.66% (GP#1) to 46.39% (YJ#1). The average carbon value obtained from seven facilities is 44.9% (Er± = 1.59%). The average carbon content of the charcoal obtained was found to be 83.7% (Er± = 1.81%) in good agreement with the literature (Jo et al., 2005; Pastor-Villegas et al., 2006). The lowest percentage of hydrogen in the wood was 5.16 and the highest 5.79 with an average of 5.59% (Er± = 0.25%). After the wood samples were burned the average percentage of hydrogen was reduced to 0.66% in agreement with Lee and Kim (2010b).
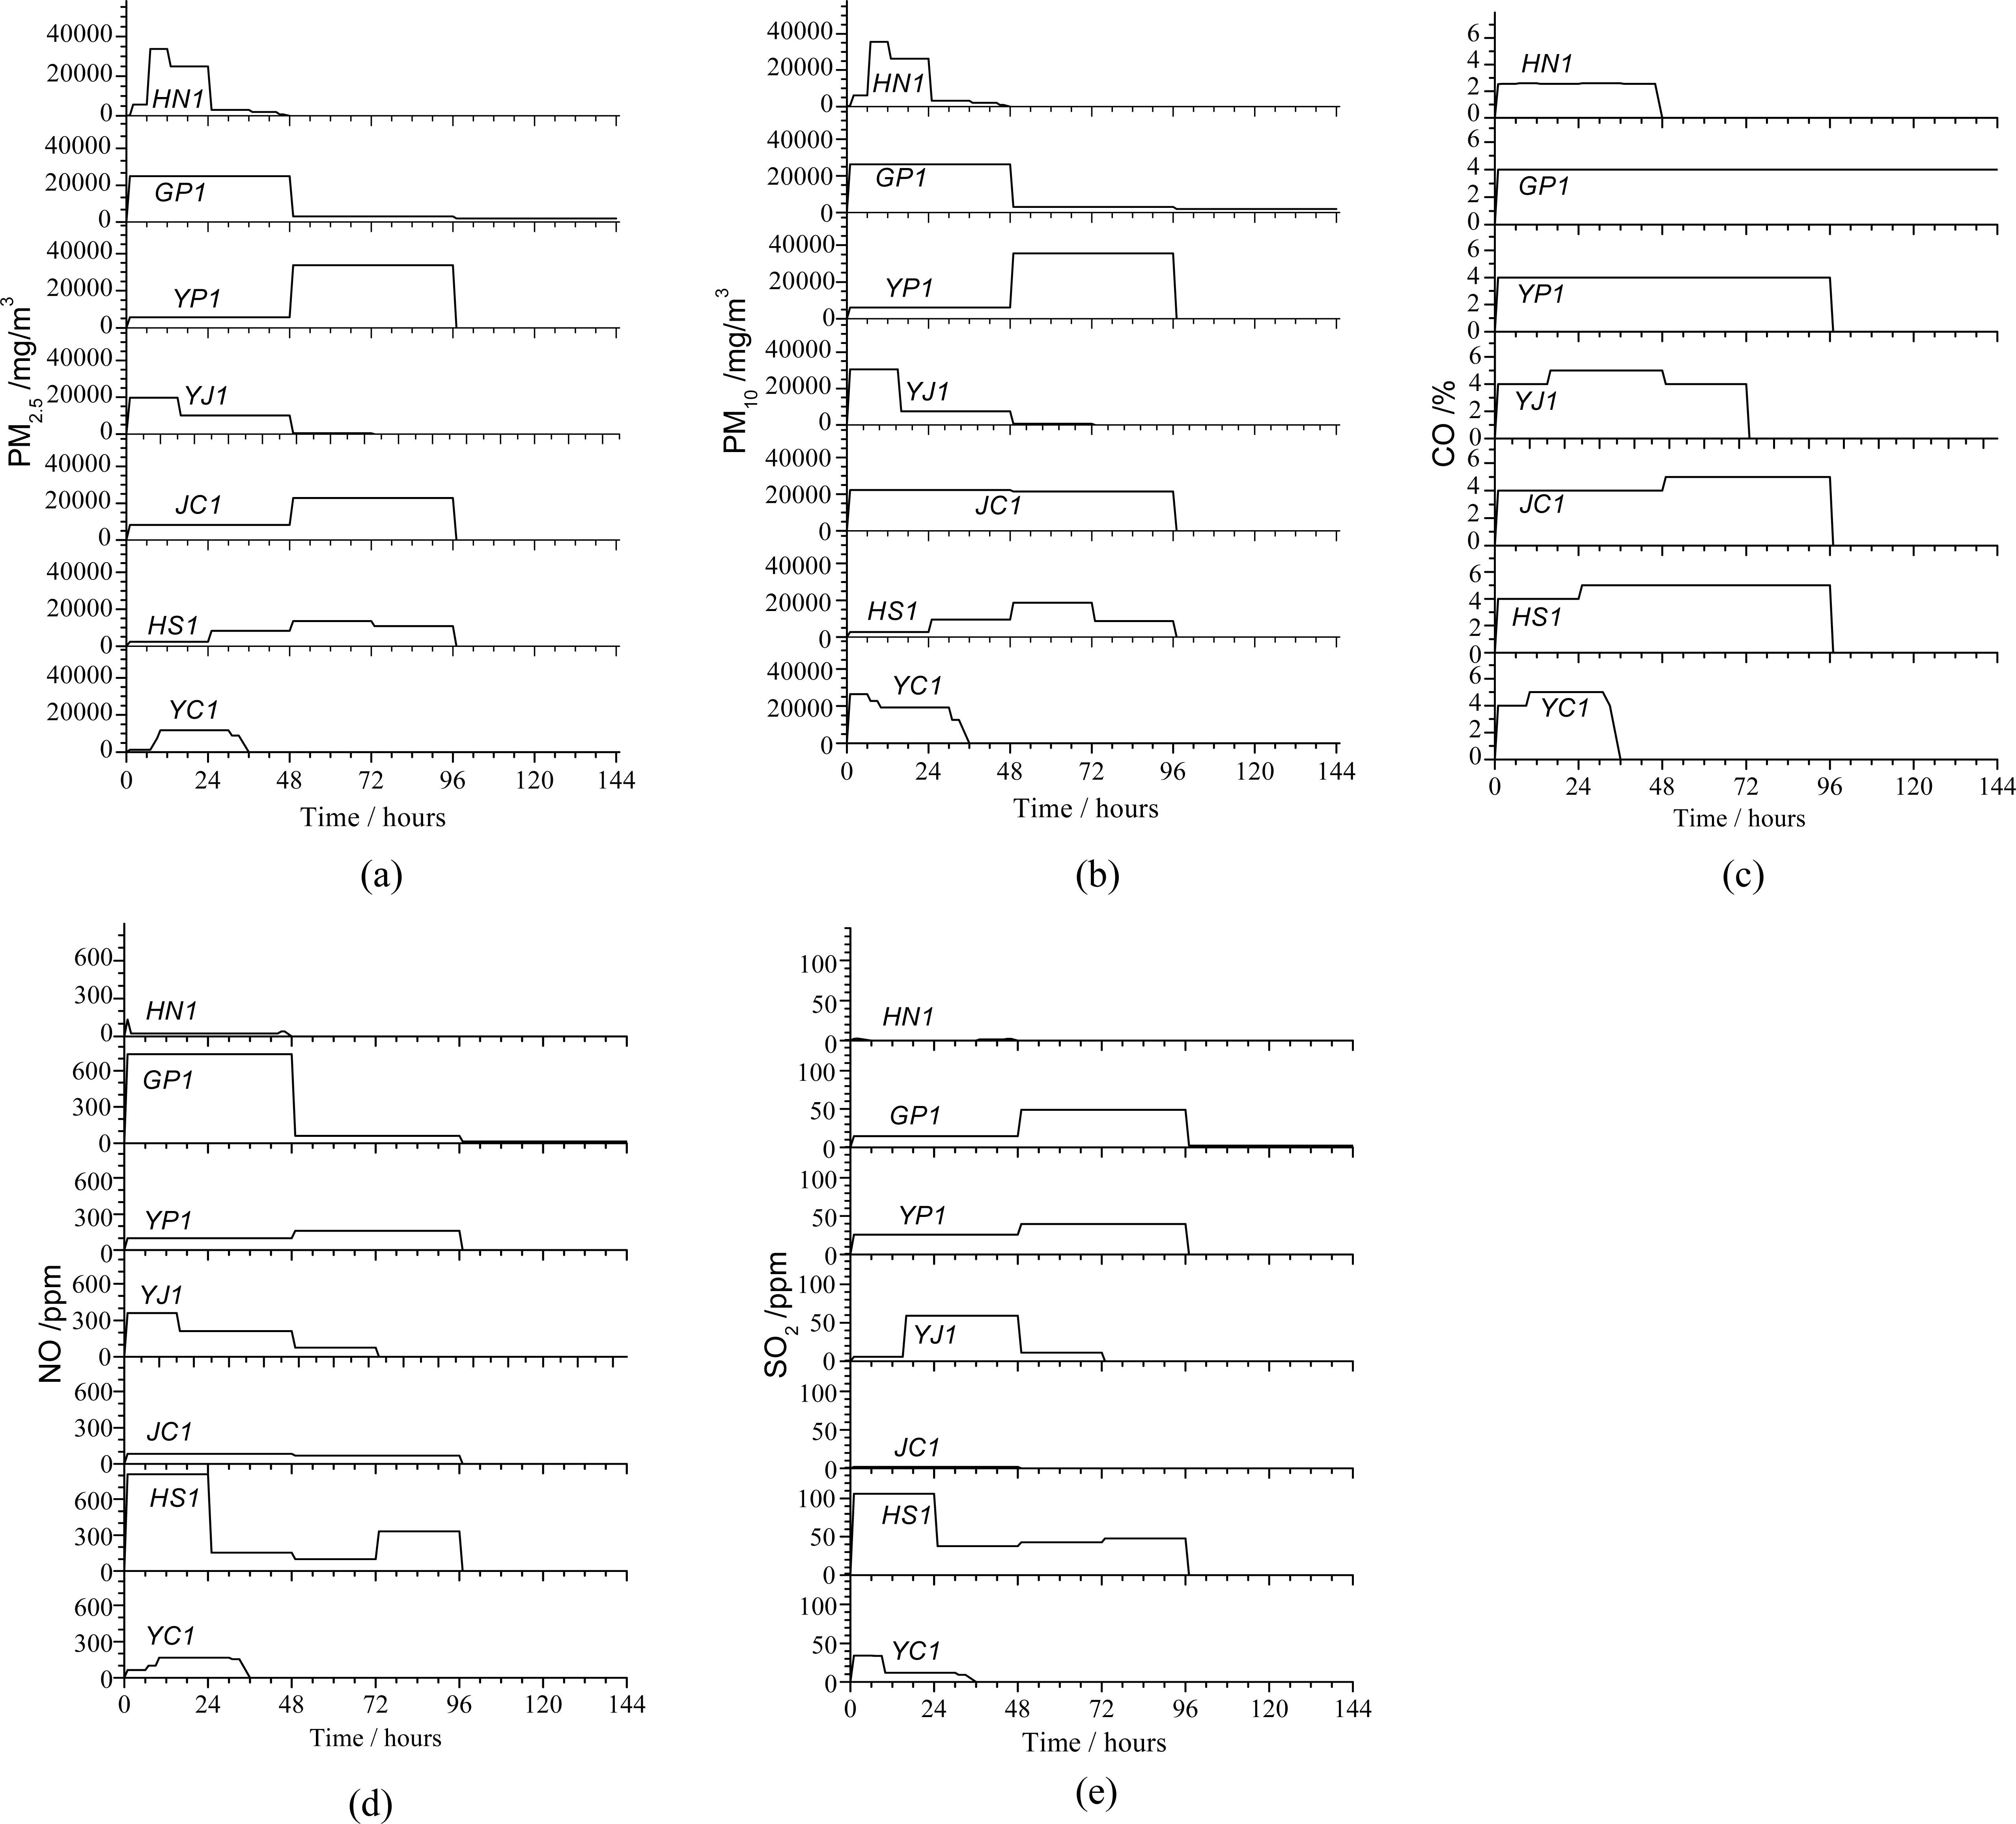
The in situ PM2.5 (mg/m3), PM10 (mg/m3), CO (%), NO (ppm) and SO2 (ppm) emissions by selected charcoal-making kilns are shown in Fig. 3. It can be seen that emissions are characterized by a strong variation in their value from a site to another and in function of time. When the charcoal-making process is started (time = 0), the graft parameters initially increase and then decline obviously after a peak value. For example, the PM2.5 emissions for YC#1 and HN#1 averaged 7845 and 12742 mg/m3, respectively. The PM10 emissions for YC#1 and HN#1 averaged 19080 and 13415 mg/m3, respectively. The maximum PM2.5 and PM10 emissions are registered between 7 and 11 hours in the case of a modern charcoal kiln, whereas the PM10 in the case of a traditional charcoal kiln exhibits one strong peak during the first hours (1-5 hrs) at the first step of process and then PM10 decreases to a constant value of about 20000 mg/m3. The WHO guideline for maximum exposure to ambient PM10 is 50 μg/m3 (WHO, 2005). The PM2.5 emitted by a traditional charcoal kiln exhibits a long plateau between 10 and 30 hours at 12000 mg/m3, which were in good agreement to data from an industrial experiment of charcoal production in the Republic of Latvia (Klavina et al., 2015). In comparison with PM2.5 and PM10, the CO emissions are more uniformly distributed within the charcoal-making kilns. From Fig. 3 can be seen that the measured average CO emissions were about 4% and 2.5% and for YC#1 and HN#1, respectively. The concentration of monitored SO2 gasses in the selected sites seemed to show a peak during the first hours of the carbonization process of oak in the case of HS#1 and YC#1. In all other cases, the SO2 emission peaks are shifted to the middle (i.e., YJ#1 site) and the end (i.e., GP#1, YP#1) of the charcoal-making process. The SO2 emission for YC#1 and HN#1 averaged 17 ppm and 2 ppm, respectively, where the WHO guideline for maximum exposure to ambient SO2 is 20 μg/m3 over 1 day and 500 μg/m3 over only 10 minutes (WHO, 2005). The NO emissions for YC#1 and HN#1 averaged 126 ppm and 56 ppm, respectively. In this last case, the WHO guideline on maximum exposure to NO2 is 40 μg/m3 over 1 year and 200 μg/m3 over 1 hour (WHO, 2005). However, as it is observed in Fig. 3, NO emission present the first-increase-and-then-decrease trend (with a maximum of 200 ppm after 12 hours of a process) in the case of the traditional kiln (YC#1). This behavior is the opposite of what was shown in the HS#1 site where the NO emission peaks are collocated at the start and at the end of a charcoal-making process. Overall, without considering the variance in average values of CO, NO, and SO2 constituents, the obtained in situ experimental emissions from a traditional kiln (YC#1) are significantly higher than emissions from the modern charcoal kiln (HN#1) during the entire period of observations. From another point of view, it can be concluded that the emissions from an HN#1 site with short charcoal making periods of two days are lower than the ones observed on other sites.
The OC (mg/m3) and EC (mg/m3) emissions are shown in Fig. 4. The measured average OC emissions were about 3350 and 5320 mg/m3 for YC#1 and HN#1, respectively. EC emissions for the site coded YC#1 and HN#1 averaged 1305 and 2075 mg/m3, respectively. As it is shown the average EC and OC emissions during the charcoal-making process in a modern charcoal plant (see HN#1) is much higher than that of traditional ones. From an total carbonaceous aerosol emissions point of view, during the overall process - the result shows that a modern plant characterized by a gasification apparatus (HN#1, 1631 kg Oak) in a short period of exercise (i.e., 2 days) is better than a site characterized by an uncontrolled batch technology (YC#1, 1000 kg Oak) as well as a large site (i.e., from 8500 kg for GP#1 to 10500 kg in the HS#1).
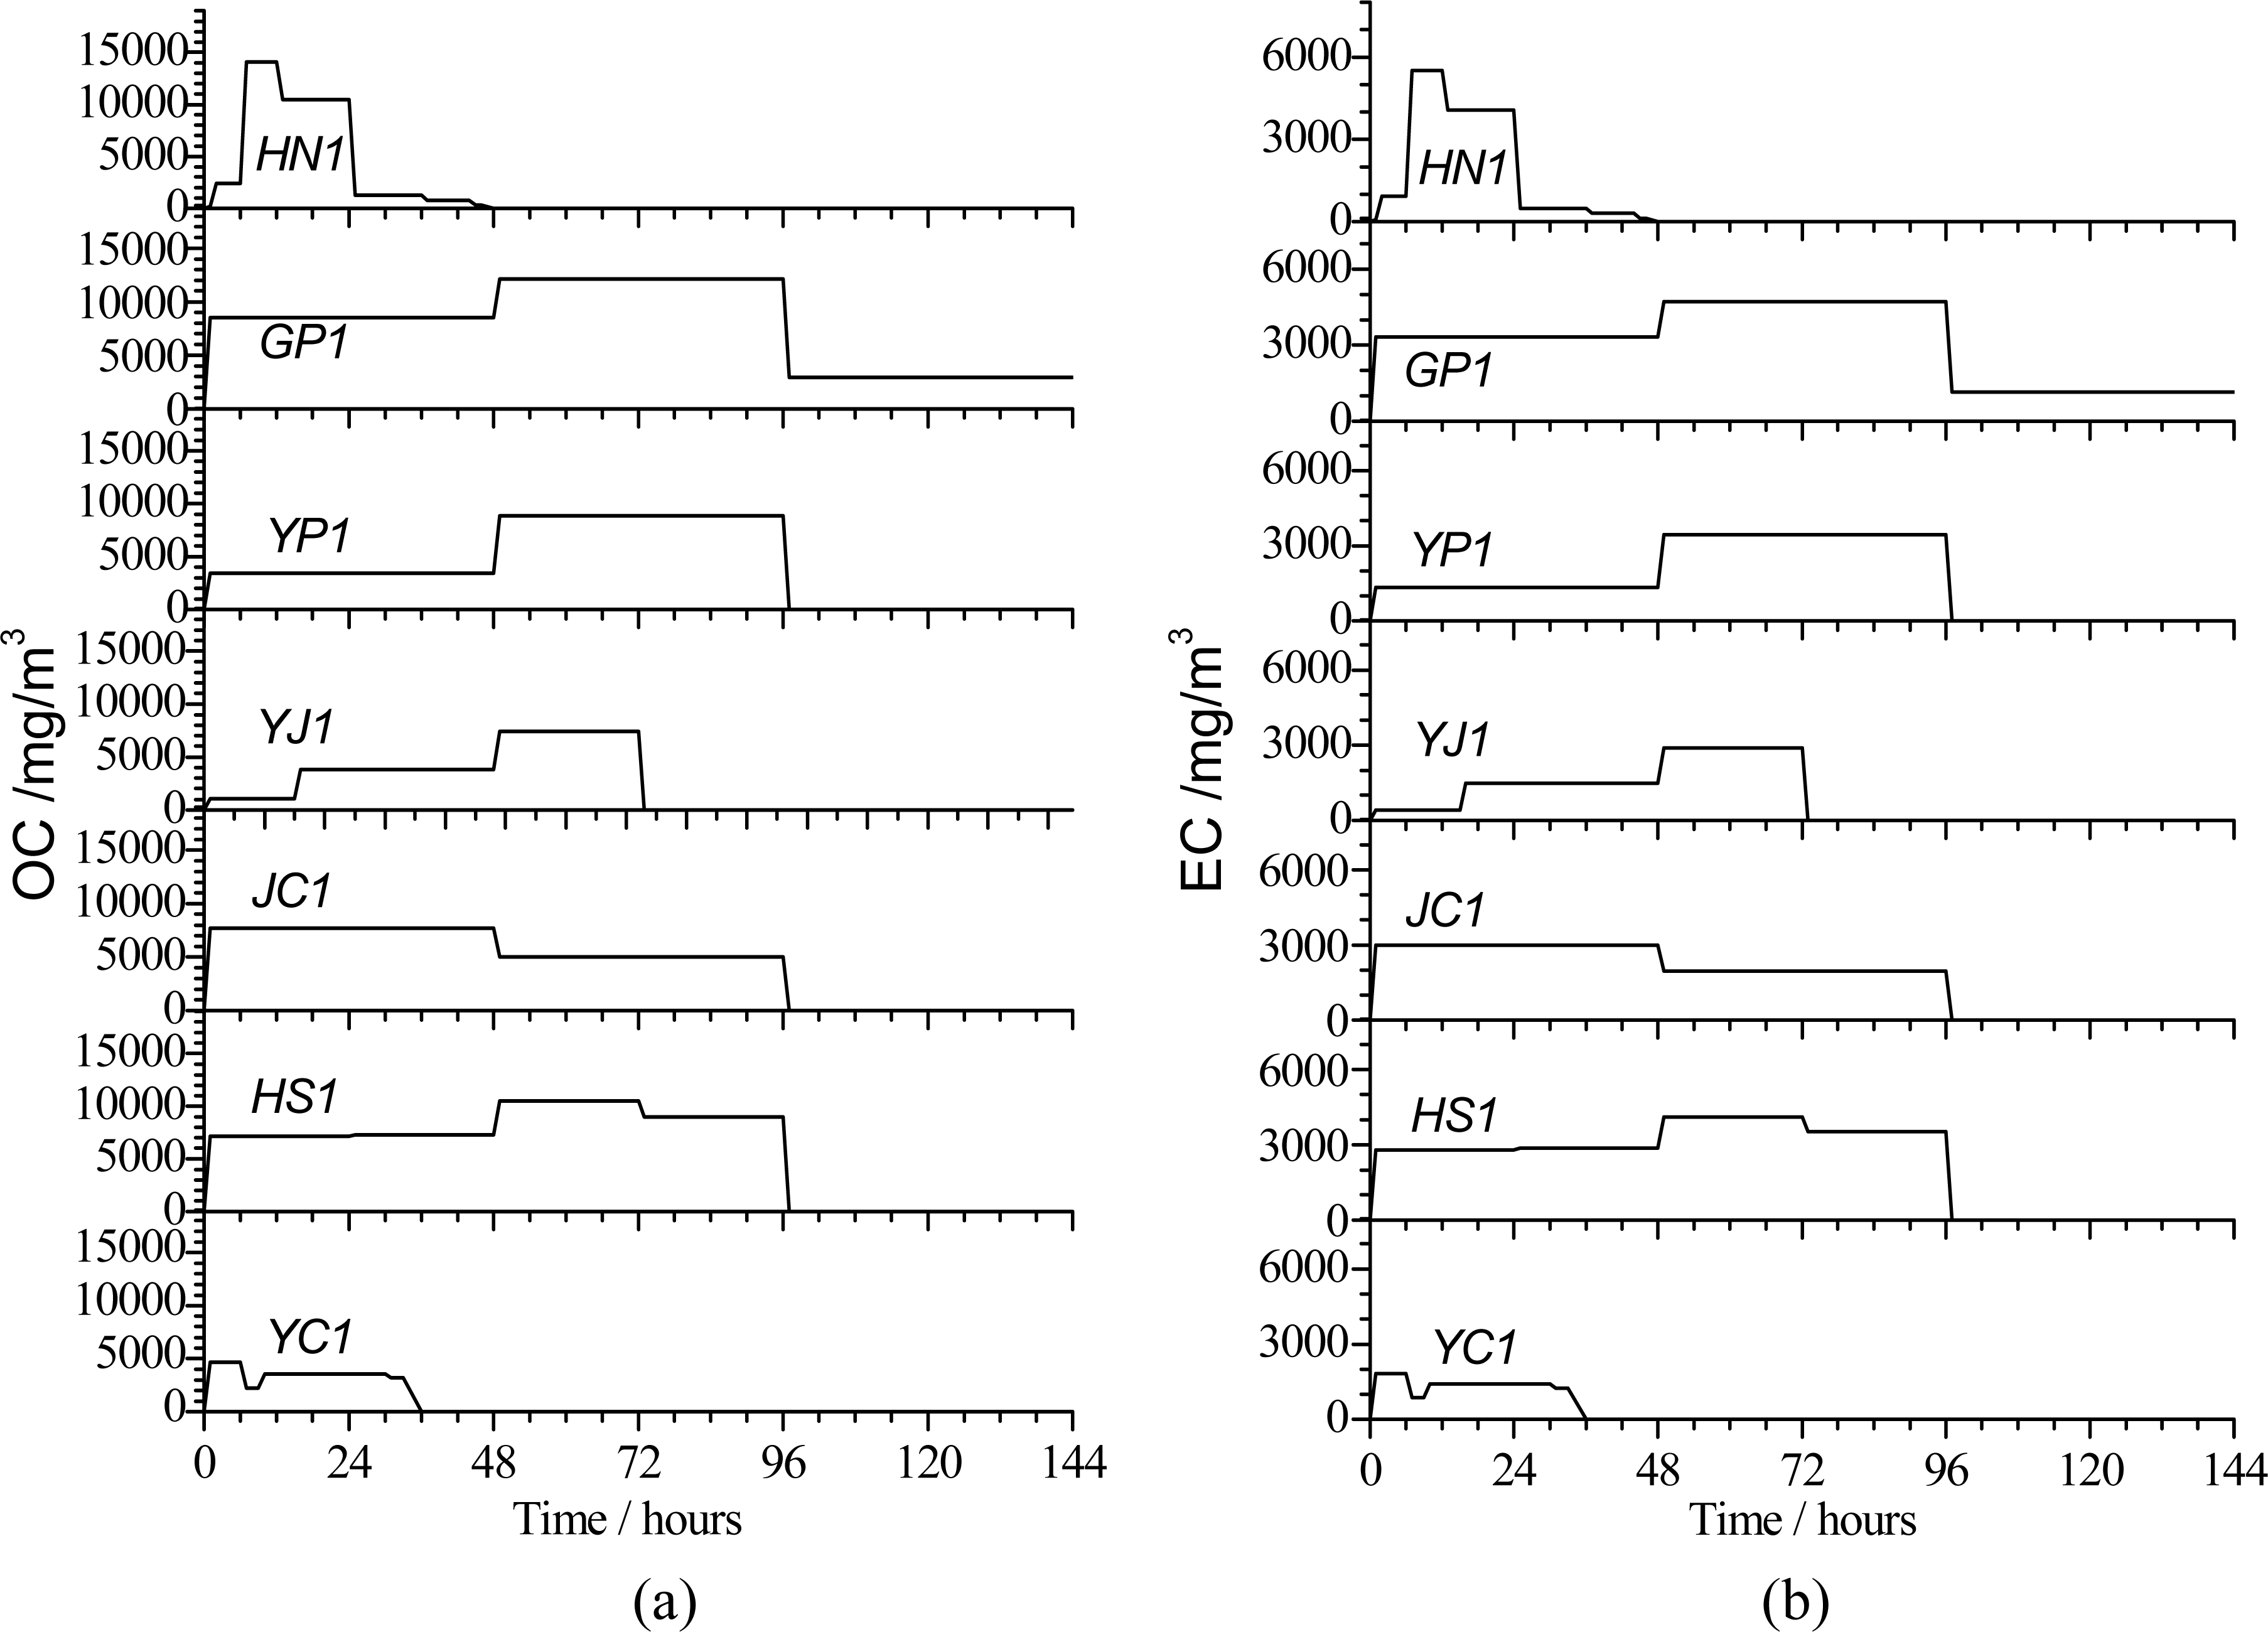
Fig. 5 presents the PM2.5, PM10, CO, NO, and SO2 emission factors normalized per one kilogram of oak wood. Firstly, it is important to note that the calculated emission factors during the whole combustion process are connected each other to the technology used and treatment technologies in agreement with Pastor-Villegas and colleagues (2006) where well explain that “the characteristics of the wood charcoals depend not only on the wood used, but also the carbonization system”. Secondly, it can generally also noted that, indifferent to the amount of oak weight per process. The total PM2.5 and PM10 emission factors for kilogram of used oak released from the traditional kiln characterized by the absence of any kind of gas treatment of emissions (see YC#1 and GP#1) were larger than both the traditional charcoal-making kilns use some kind of emission treatments (see HS#1, JC#1, YP#1, and YP#1) and, of course, the modern charcoal plant characterized by a gasification apparatus (HN#1). The overall average of PM10 emission factors emitted from the selected sites (N=7) was 58.88 gPM10/kg-oak with a deviation percentage of about 22%. The overall average of PM2.5 emission factors was 35.56 gPM2.5/ kg-oak with a deviation of about 37%. In comparison with PM2.5 and PM10, the CO emission factors are more uniformly distributed within selected charcoalmaking kilns except for YC#1. From Fig. 5 can be seen that the calculated CO emission factors range from 110 to 393 gCO/kg-oak for the YC#1 and HN#1 cases, respectively. It was strongly depend on the absence or presence of the gas emission reduction system, which is in good agreement with previous experimental observations in Thailand (Smith et al., 1999) and Kenya (Pennise et al., 2001) where the emission factors, expressed as grams of pollutant per kilogram of charcoal produced, ranged from 110 to 340 and 143 to 373 for CO, respectively.
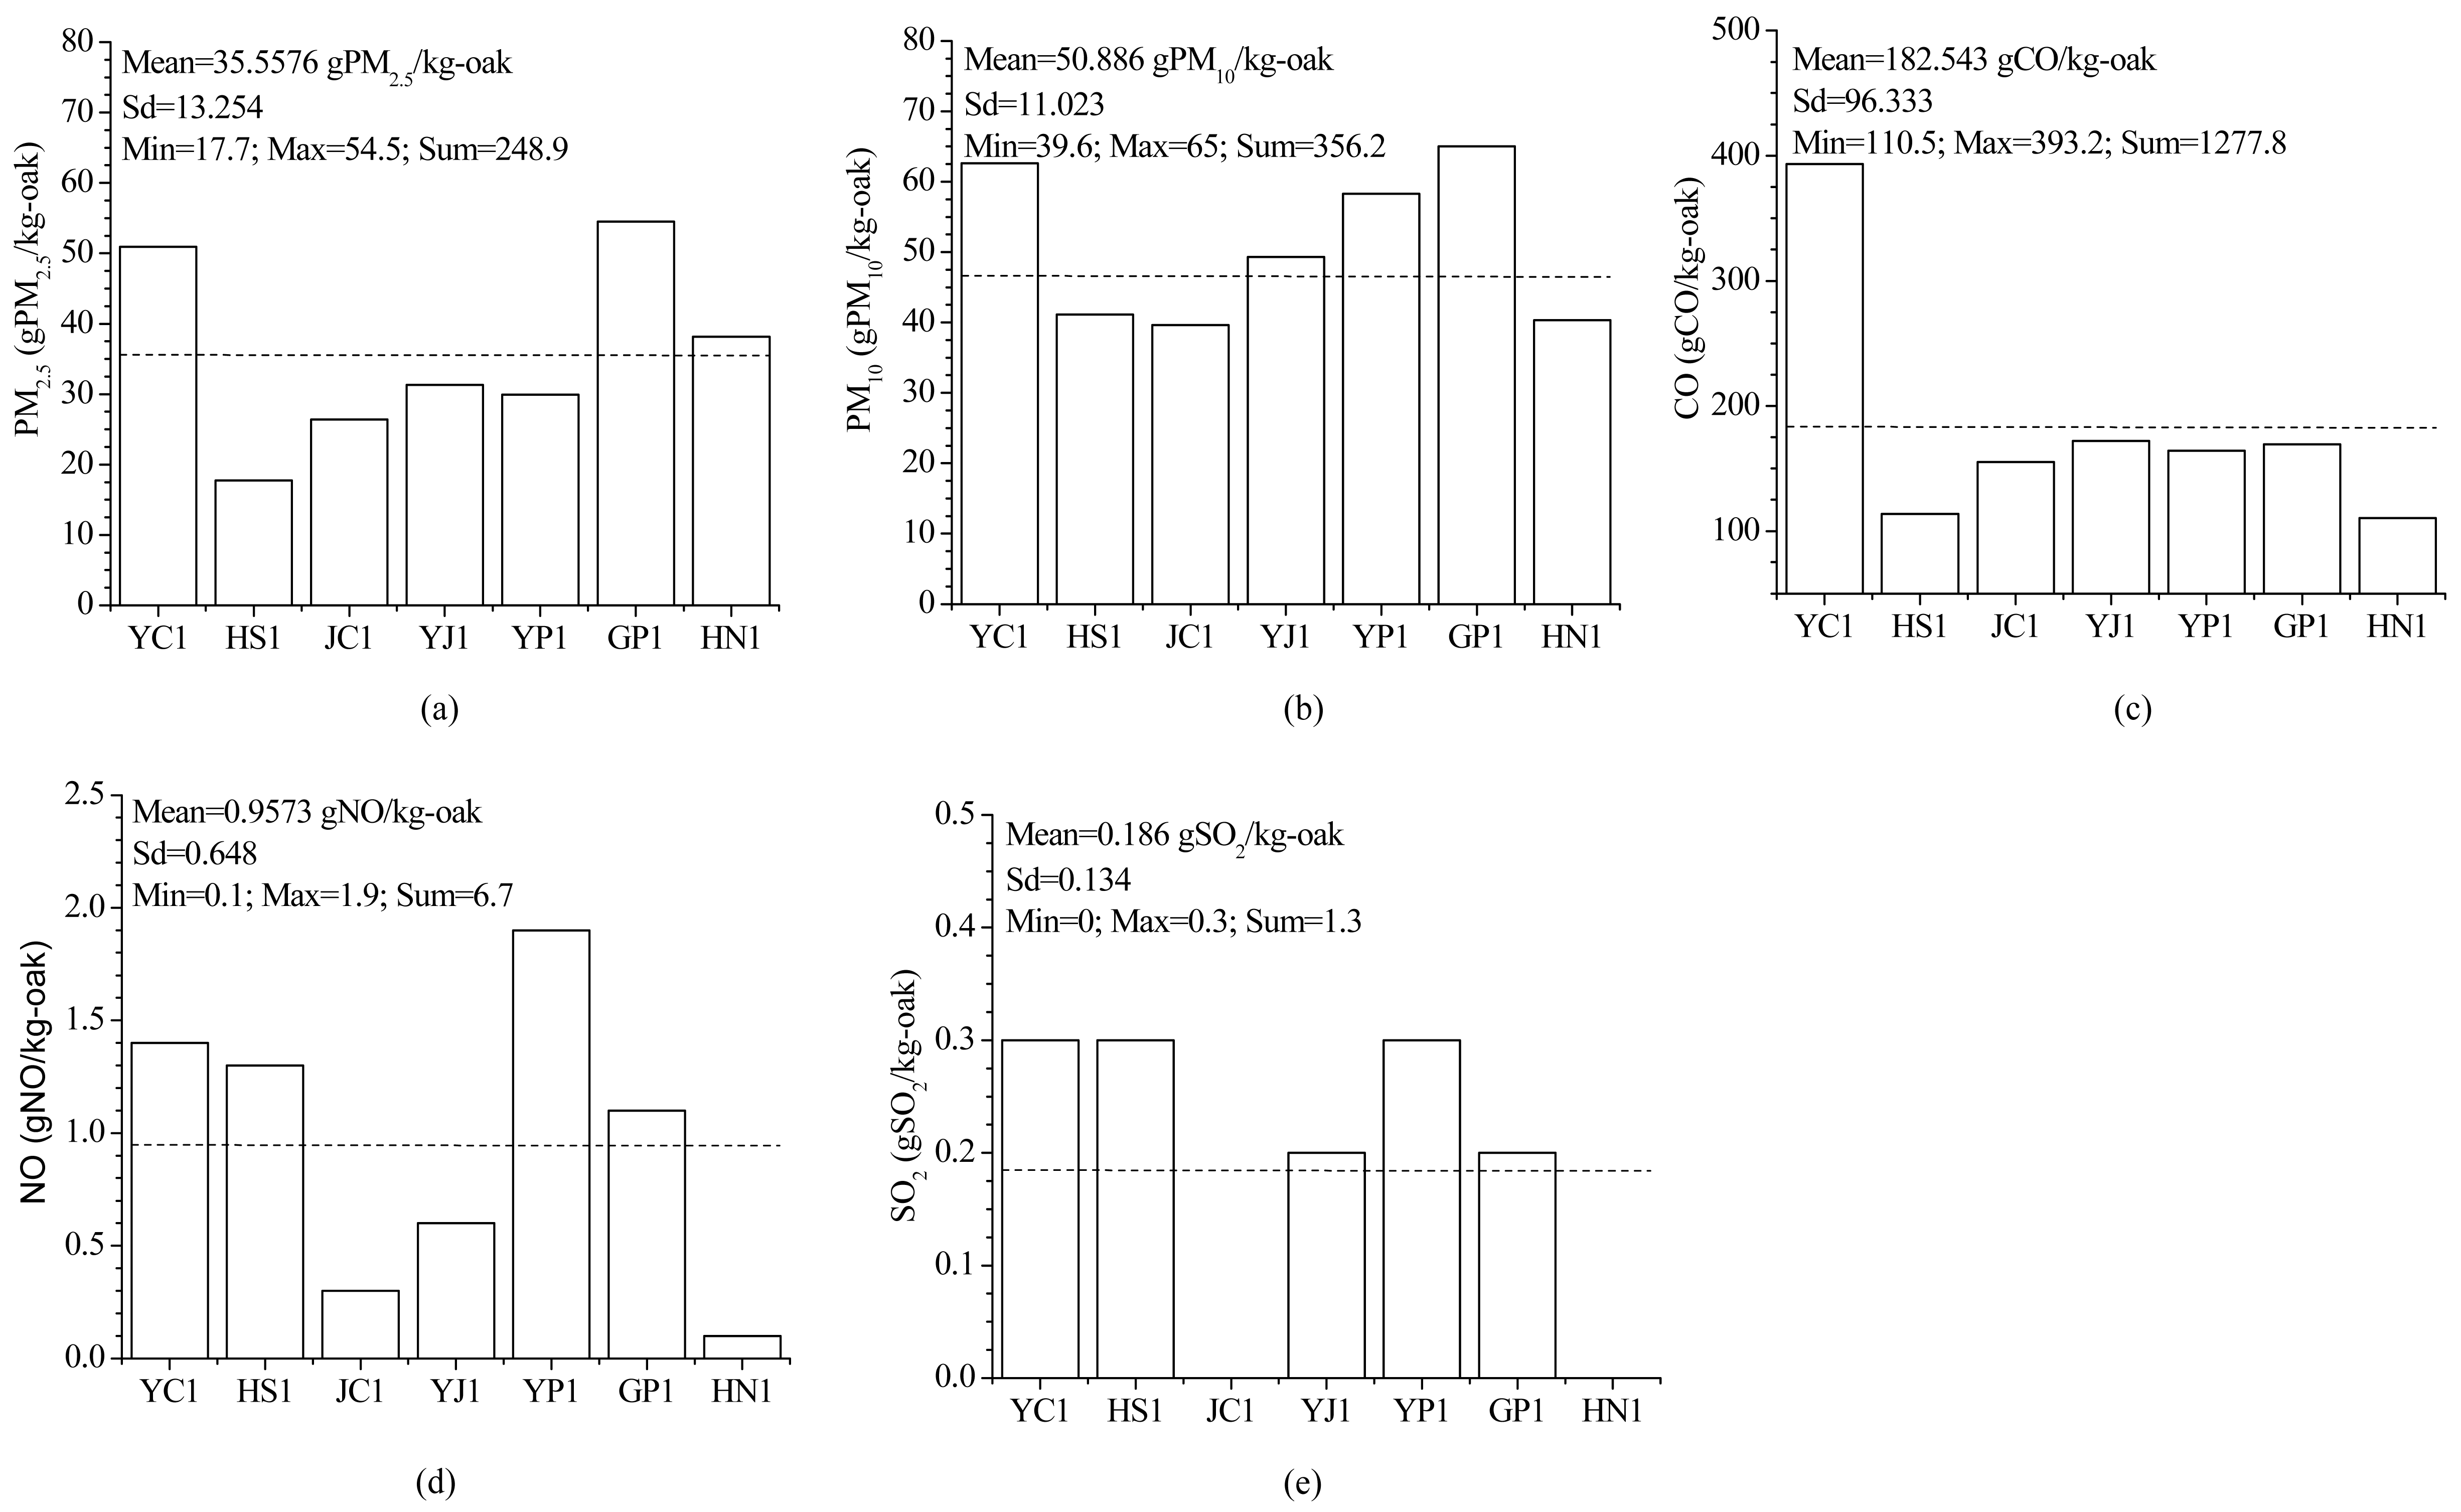
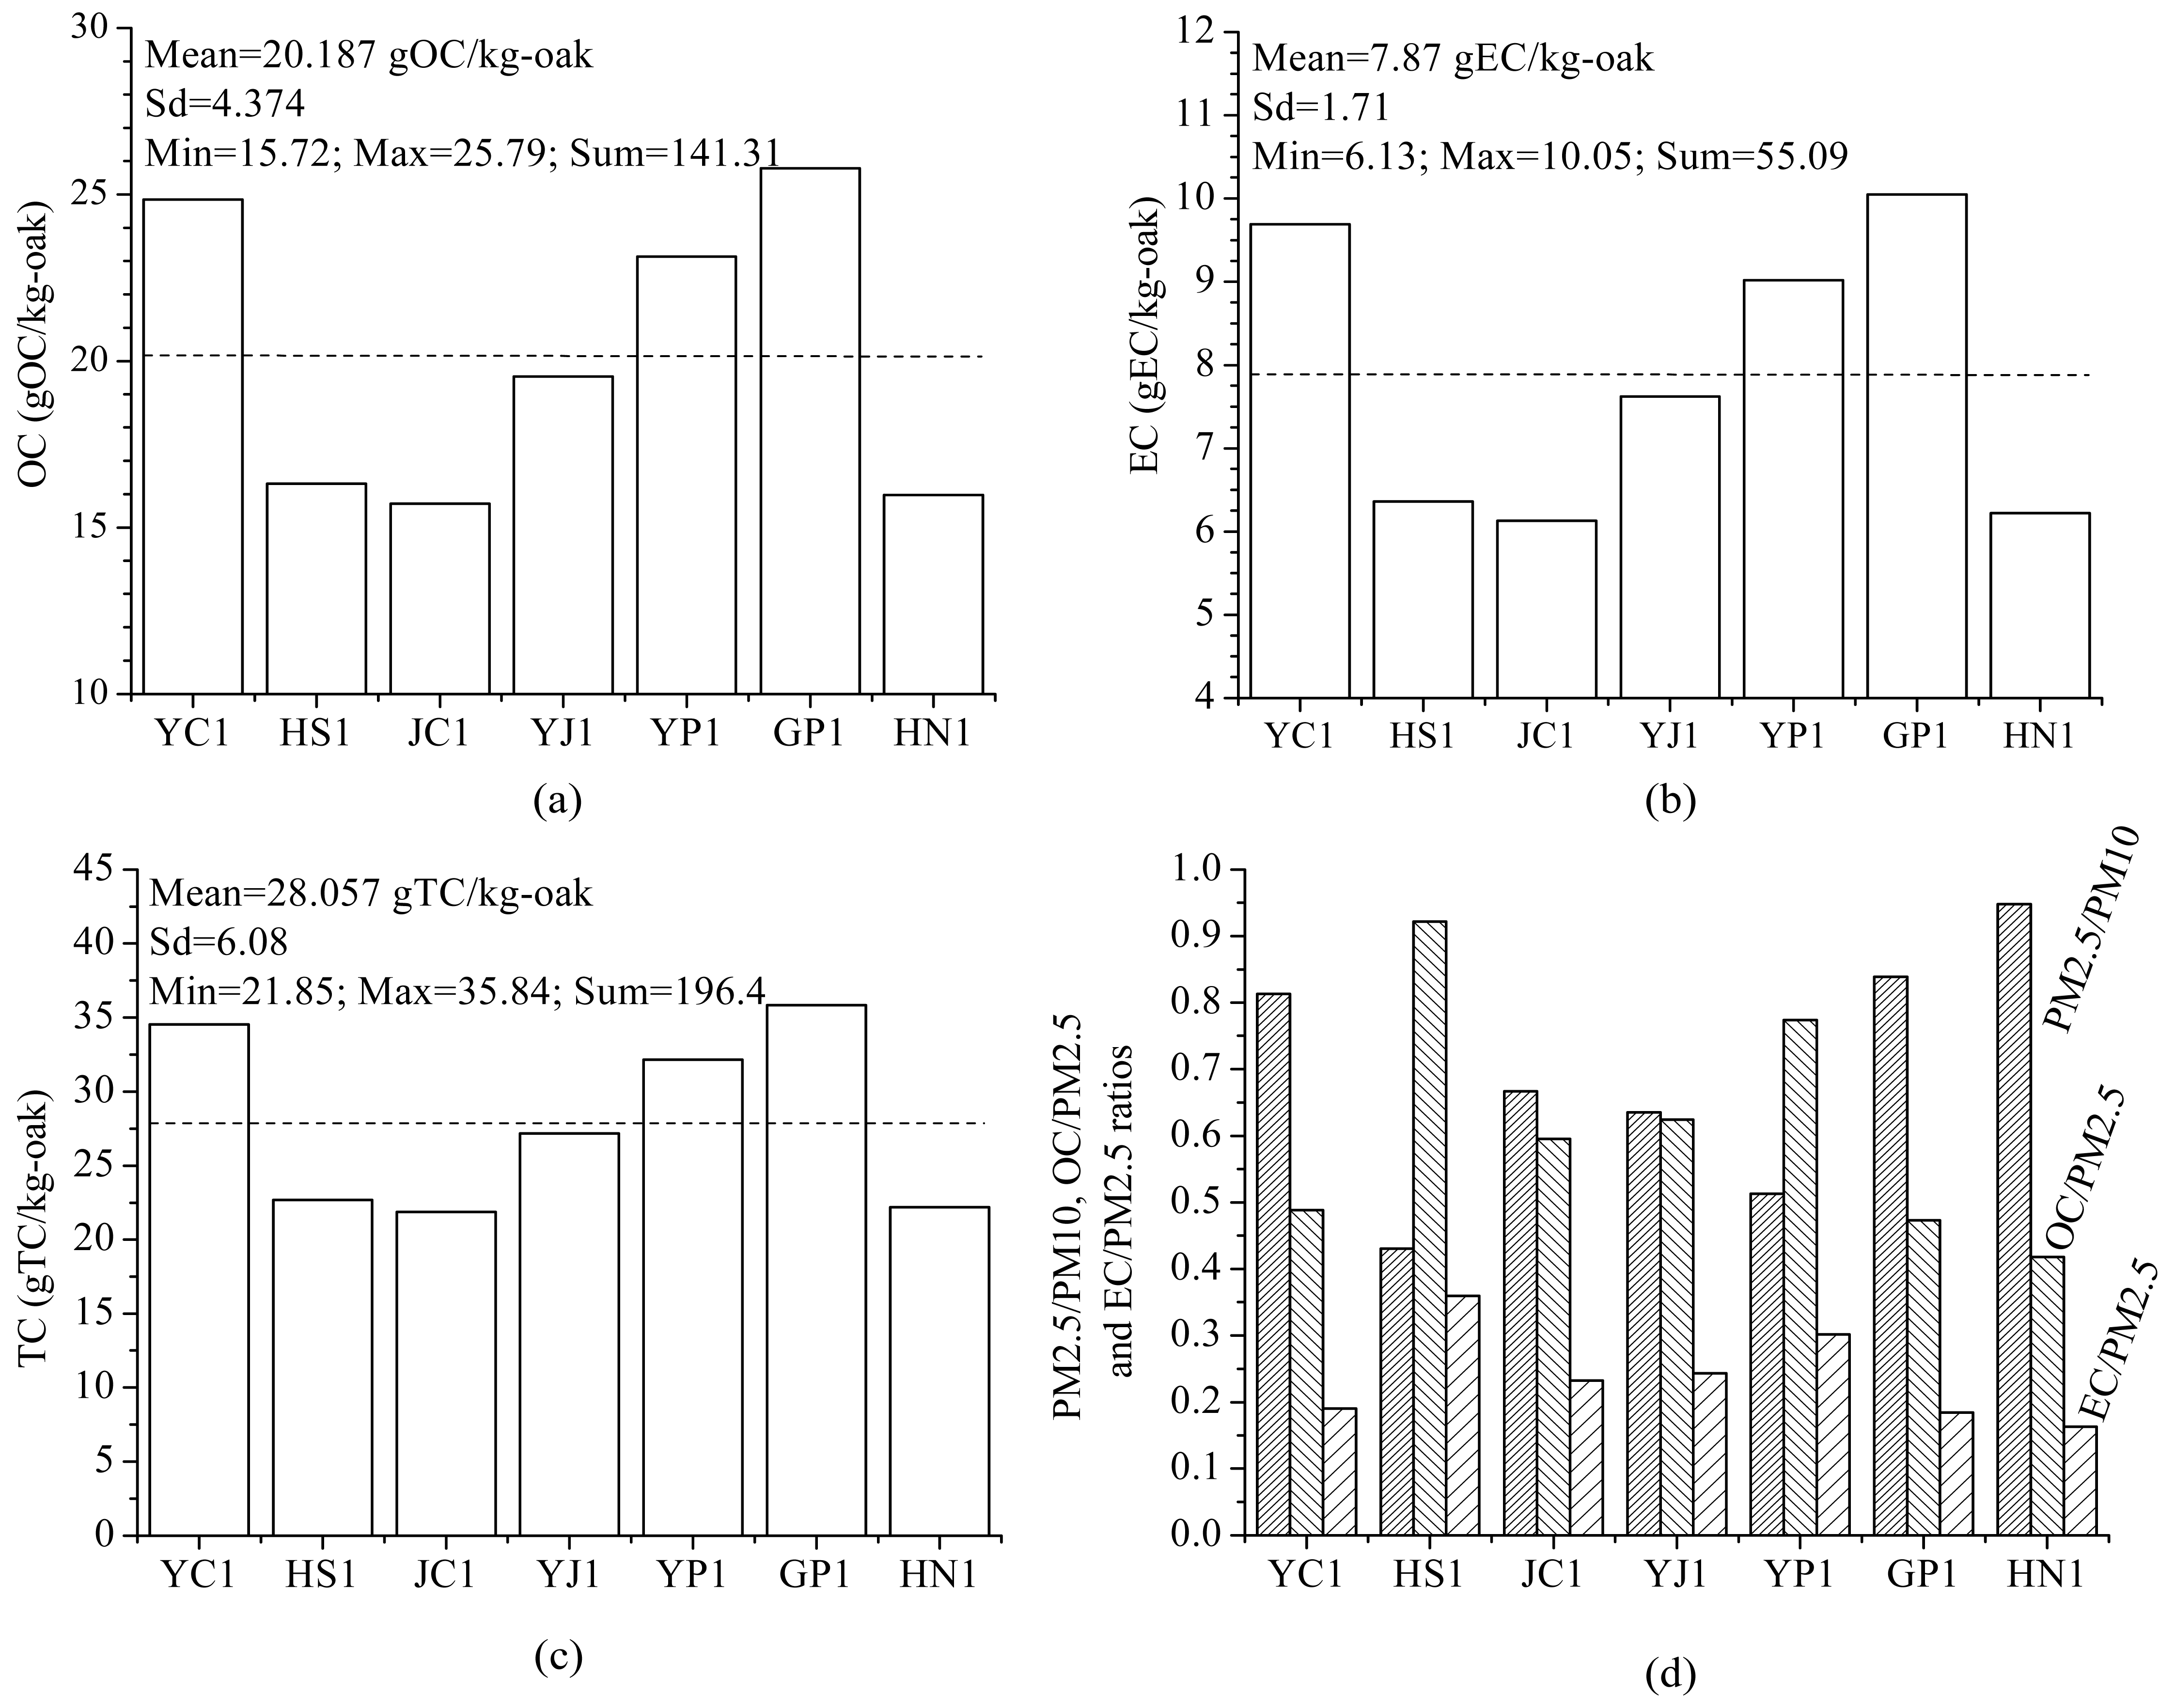
Fig. 6 presents the carbon emission factors expressed in OC, EC, and TC per kg of burned oak. Clearly, it can be seen that traditional kilns without any treatment of emissions (see YC#1 and GP#1) produces higher emissions than others (see HS#1, JC#1, YP#1, and HN#1). However, it should be noted that the OC, EC, and TC emission factors resulting from YC#1 and HN#1 charcoal-making kilns likely represent the two extremes of the behavior in question. From Fig. 6(a) it can be noted that OC ranged from 15.7 (JC#1) and 16.0 (HN#1) to 24.8 (YC#1) and 25.8 gOC/kg-oak (GP#1). On the other hand, as can be seen in Fig. 6(b), EC ranged from 6.1 (JC#1) and 6.2 (HN#1) to 9.7 (YC#1) and 10.1 gOC/kg-oak (GP#1). Consequently, TC ranged from 21.8 (JC#1) and 22.2 (HN#1) to 34.5 (YC#1) and 35.8 gTC/kg-oak (GP#1). To summarize, the OC, EC and TC emission factors for seven charcoal-making kilns averaged 20.2 ± 4.4 gOC/kg-oak, 7.9 ± 1.7 gEC/kg-oak, and 28.1 ± 6.1 gTC/kg-oak. Figure 6 (d) shows the PM2.5/PM10, OC/PM2.5, and EC/PM2.5 ratios for the different sites. Individual PM2.5/PM10 ratios range from 0.43 (HS#1) to 0.94 (HN#1). Pearson's correlation coefficient between PM2.5/PM10 ratio and PM10 level is about 0.2 which indicates a weak positive correlation between these variables. On the other hand, the Pearson's correlation coefficients between OC/PM2.5 ratios and OC values or EC/PM2.5 and EC values are both below 0.25, and then there are also a very weak relationship between variables. In contrast, OC/PM2.5 and EC/PM2.5 ratios increase with decreasing relative PM2.5 with a Pearson's correlation coefficient values of -0.79. In addition, between OC/PM10 and EC/PM10 there is also a strong positive correlation of +0.86, while the relationship between OC/PM10 ratios and PM10 values is extremely weak (+0.04). This indicates that OC and EC emission factors are statistical predominantly due to decrease in the PM2.5. The data available in the literature are sparse and, to the best of our knowledge, there is no study on charcoal production plants in the South Korea context.
To conclude, in addition to other factors already mentioned by Kato et al. (2005) to guarantee better health conditions for the workers in the woos charcoal sector. These technological conversion from traditional (i.e., YC#1) into modern charcoal plants (i.e., HN#1) is not only environmentally preferable but it is also economically feasible and politically justified to protect at-risk workers (Madani et al., 1992; Tzanakis et al., 2001; Kato et al., 2004; Naeher, 2007).
4. CONCLUSION
This work gives a comparative depiction of the carbonaceous aerosol pollution emitted on the atmospheric environment from the charcoal kiln manufacturing processes (carbonization processes) of seven different charcoal production sites in the South Korea context. The in situ analysis presented in this work indicate that all emissions (PM2.5, PM10, CO, NO, SO2, CO, EC, TC) are quite different between site and site, and moreover, there is a strong correlation between technological factors, charcoal making period and carbonaceous aerosol constituents. Significant correlations between the emission factors were found in PM10 with Pearson's correlation coefficient values between variables of 0.8. In particular, the OC and EC emission factors per unit of fuelled oak range from ~15 g-OC/kg-oak to ~25 g-OC/kg-oak and from ~6 g-EC/kg-oak to ~10 g-EC/kg-oak for a traditional kiln and modern plant, respectively. This difference can be explained considering the absence or presence of the emission reduction technology.
This study emphasizes the strategic importance of the technology behind these type of wood industries as a critical parameter not only to reduce the carbonaceous aerosol pollution on the atmospheric environment but also to improve the workers' health.