1. INTRODUCTION
Pine wood is good for providing long fiber for pulp and paper products and this utilisation process produces residues known as pine barks which make up about 10- 15 % of the total tree weight (Ku et al., 2007). Pine bark contains high levels of polyphenol and bioactive compounds (Nunes et al., 1999; Hafizoğlu et al., 2002) which can potentially be used for pharmaceutical purposes, such as antioxidant (Ku et al., 2007; Cadiz-Gurerrea et al., 2014), anti-fungi (Morita et al., 2001), antitumor (Amalinei et al., 2014) and anti-cancer activities(Yesil-Celiktas et al., 2009). Those bioactive compounds were detected as flavonoids in P. brutia, P. pinea, P. sylvestris P. nigra and P. radiata (Yesil-Celiktas et al., 2009; Cadiz-Gurerrea et al., 2014; Amalinei et al., 2014; Mun, 2014; Mun and Nicholas, 2017). However, no previous study has been conducted on the flavonoids derived from the bark of Indonesian pine P. merkusii.
P. merkusii is a native species in South East Asia especially in Indonesia and it has been utilised for its rosin and long fiber. Because the presence of pine wood in providing long fiber and rosin in Indonesia is limited to P. merkusii, other species of Pinus e.g. P. elliotii, P. caribeae, P. oocarpa, P. montezumae, and P. insularis were introduced. As the materials to be utilised, it is necessary to pay attention to the basic properties of the pines. In the previous study, we reported the lipophilic extractives of the inner and outer barks of these Pinus (Masendra et al., 2018a, 2018b). However, information on the hydrophilic extracts from the inner and outer barks of these pines remains unknown. Therefore this is the first time that the chemical composition of the hydrophilic extracts of the inner and outer barks of six Pinus species which were grown in Indonesia is being reported.
2. MATERIALS and METHODS
The materials that were used in the process of conducting this study were obtained from the site of The Center for Forest Biotechnology and Tree Improvement Research, Situbondo, East Java, Indonesia. Two individual trees of each species (36- 88 years old) were selected and their bark samples were taken. The species were P. elliotii (seed source: USA), P. caribeae (USA), P. oocarpa (Australia), P. merkusii (Indonesia), P. montezumae (Mexico) and P. insularis (Australia). The thickness of the inner barks ranged from 0.1-0.3cm, while that of the outer barks was from 0.3-1.6cm.
After radial separation, each portion was milled to produce bark powder (100 mesh) which was then extracted (2g) with dichloromethane and ethanol for 6h in a Soxhlet apparatus and with hot water for 3h in a reflux apparatus (Nunes et al., 1999). The solvent was evaporated to make it dry then the extracts were weighed. The results were expressed in percent of dry bark.
The total phenol was observed using a modified version of the Folin-Ciocalteu method (Diouf et al., 2009). Briefly, 2.5ml of Folin-Ciocalteu phenol reagent (10 times dilution) was mixed with 0.5ml of ethanol solution of the sample (0.25mg/ml) in a 9ml glass. After a period of 2mins, 2ml of 7.5% aqueous sodium carbonate (Na2CO3) was added to the glass and the mixture was allowed to stand for 30mins at ambient temperature. The absorbance of chromogen formed was read at 765nm. The results were expressed as gallic acid equivalents (mg GAE/g based on dry extract weight). The regression coefficient of gallic acid was 0.9973.
The total content of flavanol was determined by a modification of the vanillin- HCl assay described by Richard et al. (1978). 0.5ml (0.25mg/ml) of ethanol solution from the sample, 3ml of vanillin reagent (4% vanillin in methanol) and 1.5ml of HCl were added and the reaction was allowed to stand for 15mins at ambient temperature. The absorbance was read at 500nm. Results were expressed in (+)-catechin equivalents (mg CE/g based on dry weight). The regression coefficient of (+)-catechin was 0.9953.
The tannin-formaldehyde quantification was carried out using the Humphreys procedure (1956). Briefly, the bark sample (2g) was refluxed with distilled water thrice and the samples were filtered afterwards. The filtrate was cooled to 18°C and quantitatively transferred to a 500ml volumetric flask. Furthermore, 100ml of the solution was taken and added to 10ml of formalin and 5ml of concentrated hydrochloric acid, then the mixture was refluxed for 30 minutes and rapidly cooled at room temperature. Later, the precipitate was filtered and weighed for results. The tannin-formaldehyde is expressed as a percentage of the bark with the equation as follows:
where A is the weight of the precipitate (gram) and W is the weight of the bark sample (gram).
The hydrogen-ion activity or pH value was measured using a pH meter (HORIBA). The bark sample (1g) was submerged in 20ml of distilled water and the pH was measured after 24h.
For GC-MS analysis, each sample was trimethylsilylated. 40μl of the sample (1mg/ml) and 40μl of veratric acid (1mg/ml) were mixed and then evaporated. Then the sample was added to trimethylsilyl-hydroxyl (TMS-IH) and N, O-bis [trimethylsilyl] acetamide (BSA) each being 20μl in quantity. The reaction was allowed to stand for 30mins before injection. GC-mass spectrometry (GC-MS) data were collected with a GCMS-QP 2010 (Shimadzu, Japan) under the following conditions: DB-1 capillary column (30m × 0.25mm I.D. and 0.25μm; GL Sciences, Tokyo, Japan); column temperature from 50°C (1min) to 320°C at 5°C/min; injection temperature of 250°C; detection temperature of 320°C and acquisition mass ranging from 50-800 amu using helium as the carrier gas. The components were identified by comparison with NIST MS library and literature (Petersson, 1969; Medeiros and Simoneit, 2007; Pruestos and Komaitis, 2013). The components were quantified by comparison with internal standards i.e. veratric acid.
3. RESULTS and DISCUSSION
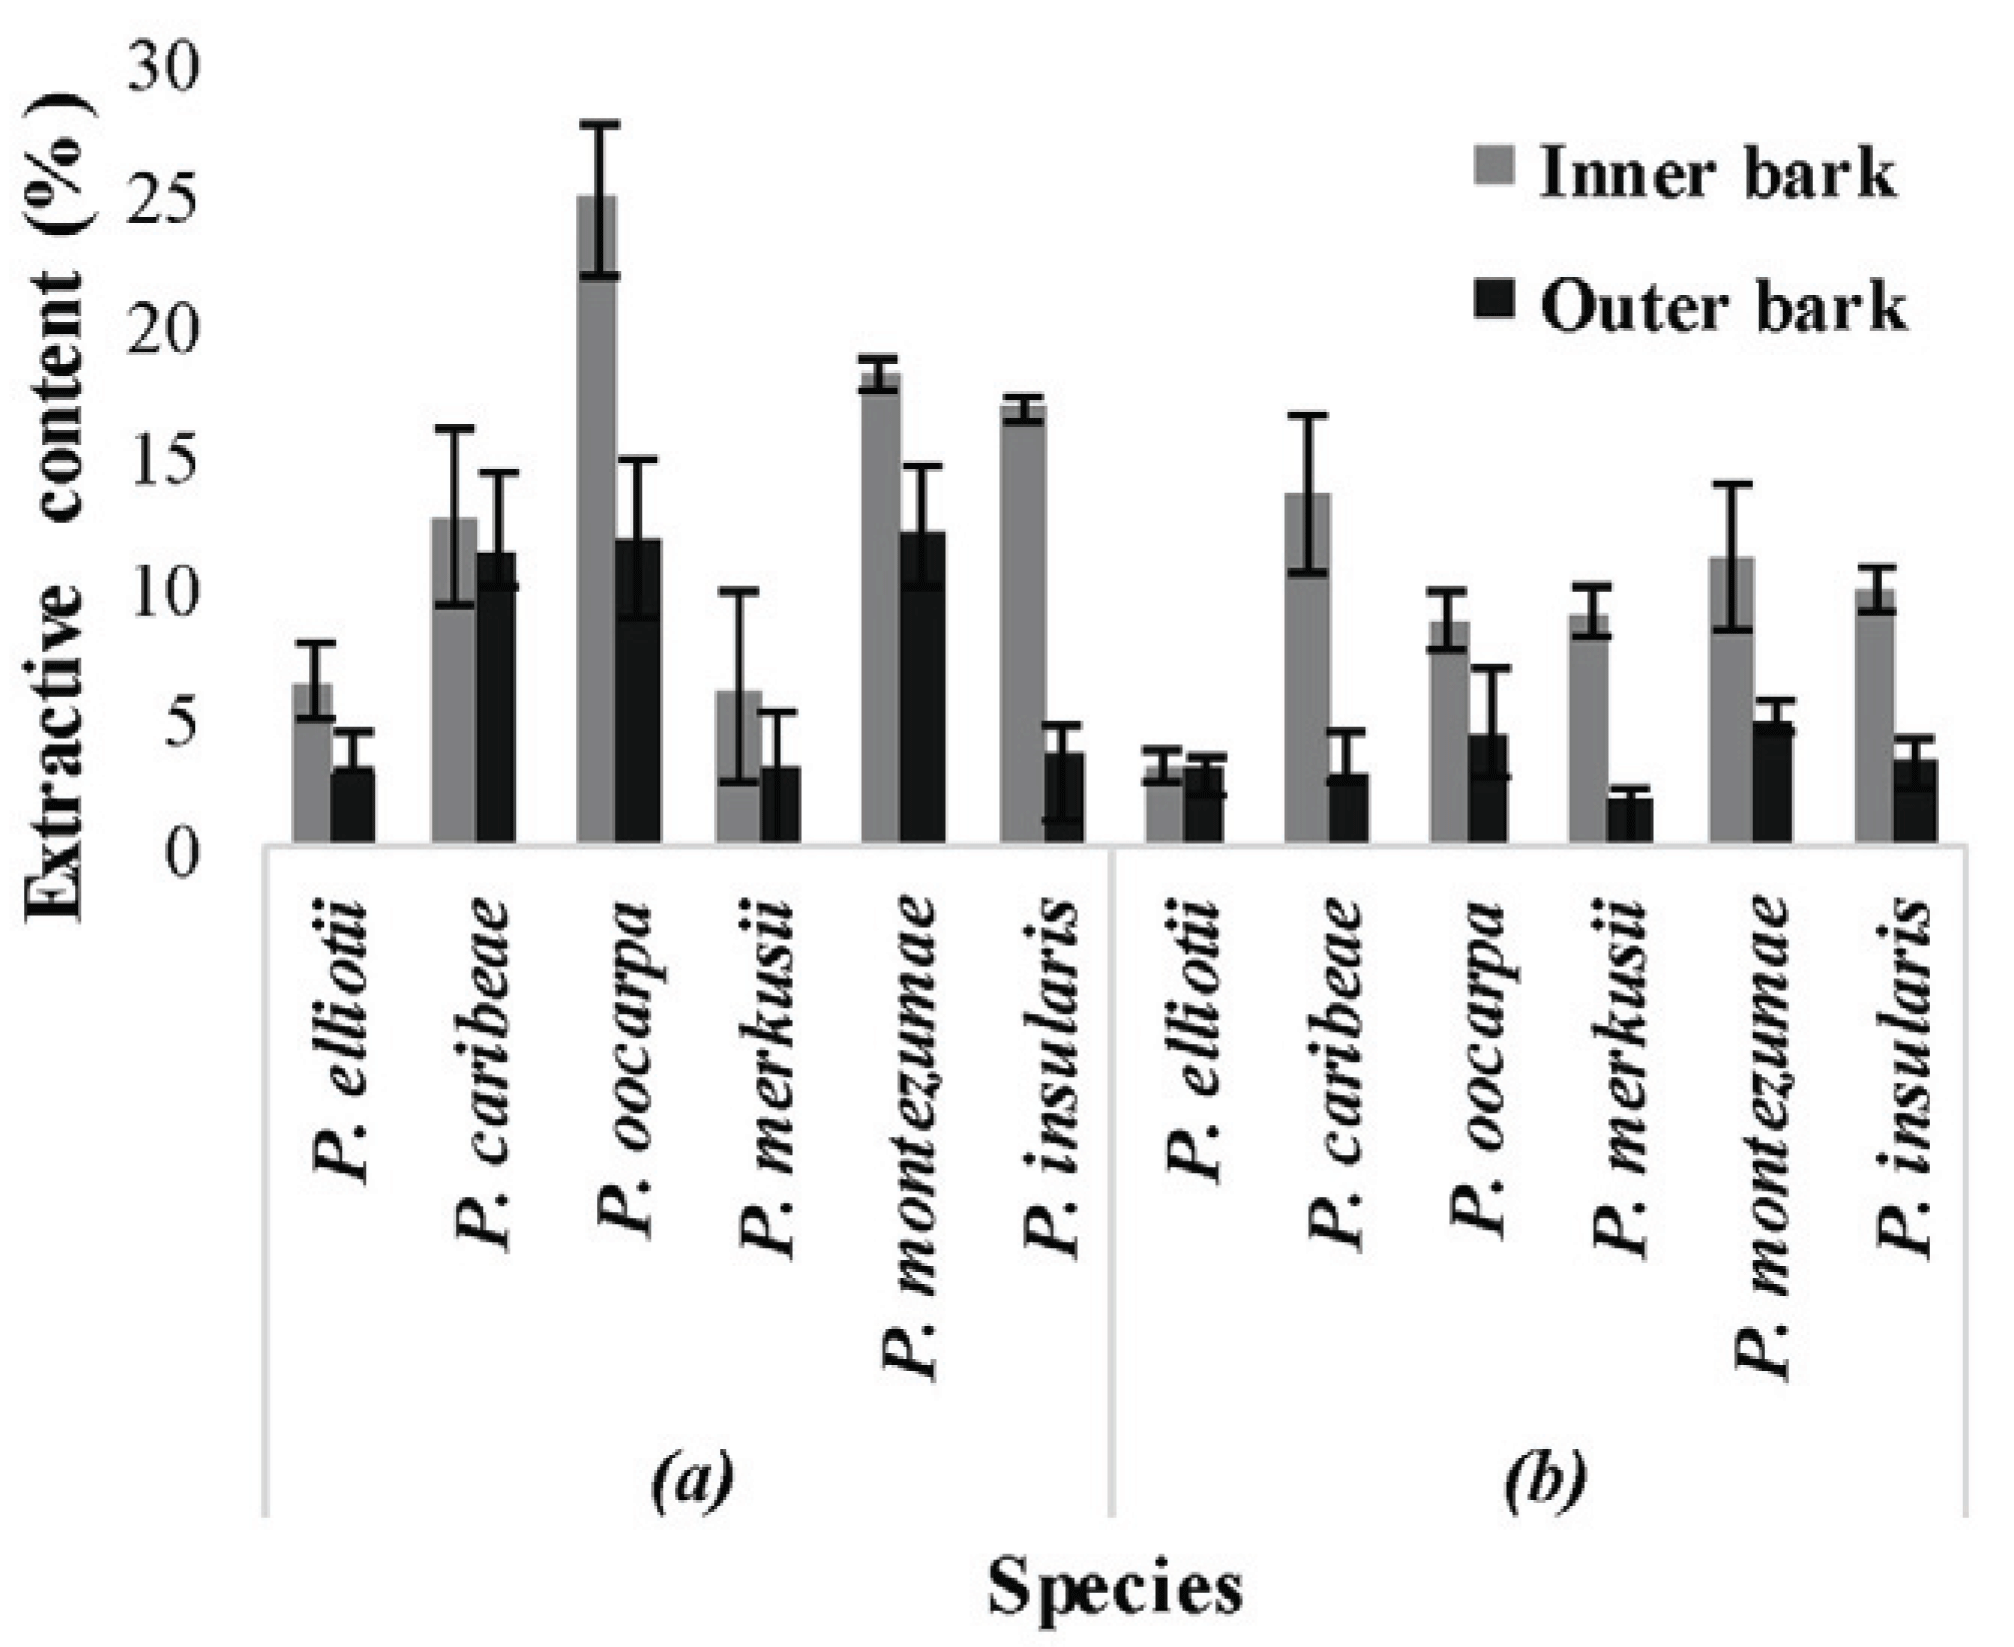
The dichloromethane soluble extracts were previously reported and they ranged from 0.7% -4.5% of dry extract (Masendra et al., 2018a). The measurement of ethanol and hot water extractive contents showed that the quantity extracted from the inner bark parts was much higher than from the outer bark parts except for hot water extractive of P. elliotii (Fig. 1). The results showed that the ethanol extractive levels were higher than those of hot water extractives.

The inner bark sample which produced the highest ethanol extract level was that of P. oocarpa (24.7%), while the outer bark of P. merkusii produced the lowest (6.0%) compared to those of other species. These quantities were within the range published for ethanol soluble extract from the bark of P. pinea (Miranda et al., 2017) and P. taeda (Eberhardt, 2012). The measurement of hot water extract revealed that P. caribea has the highest level (13.4%) while the lowest was observed in P. elliotii (3%). These hot water soluble extracts were expected to be of levels similar to those found in the bark of P. pinea (Nunes et al., 1999), P. taeda (Eberhardt, 2012), P. densiflora, P. thunbergii, P. banksiana and P.contorta (Ku et al., 2007).
When compared to the radial parts, the ethanol extracts from the inner barks of P. elliotii, P. oocarpa, and P. merkusii were 2 times higher, whereas, the extracts from the inner bark of P. insularis was 4 times higher than from the outer barks. The hot water extractive contents derived from the inner barks also remained higher than the quantities derived from the outer barks but there was an exception in the case of P. elliotii. The quantities of hot water extracted from the inner barks of P. oocarpa and P. montezumae were twice as high as the quantities derived from their respective outer barks (Fig. 1). Furthermore, the contents in the inner barks of P. caribea and P. merkusii were 4 times higher than those in their respective outer barks while that in the inner bark of P. insularis was approximately 3 times higher than in its outer bark. Thus, it can be observed that the presence of hydrophilic extractives in the inner barks decreased toward the outer bark samples. The higher accumulation of hydrophilic extractives in the inner bark samples also indicated that this part contains higher quantities of sugar and tannin as reported in the literature (Krogell et al., 2012; Eberhardt, 2012).
The result of the total phenols, total flavanols, tanninformaldehyde contents and pH values are presented in Table 1. In six Pinus species, the quantities of total phenols present in the outer bark samples were higher than in the inner barks of all while the opposite trend was observed in total flavanols. The differences of the pine species appeared to affect the values of total phenols, total flavanols and tannin- formaldehyde. The highest and lowest quantities of total phenol were observed in the outer barks of P. montezumae (916.2mg GA/ g) and P. merkusii (486.5mg GA/ g), respectively. Furthermore, the total flavanol content in the inner bark of P. oocarpa was 863.1mg CE/ g while that of P. elliotii was 40.2mg CE/ g. Compared to earlier reports, the total phenol contents of inner and outer bark samples were within the range reported for the barks of P. thunbergii, P. banksiana, P. radiata, and P. koraiensis (Ku et al., 2007).
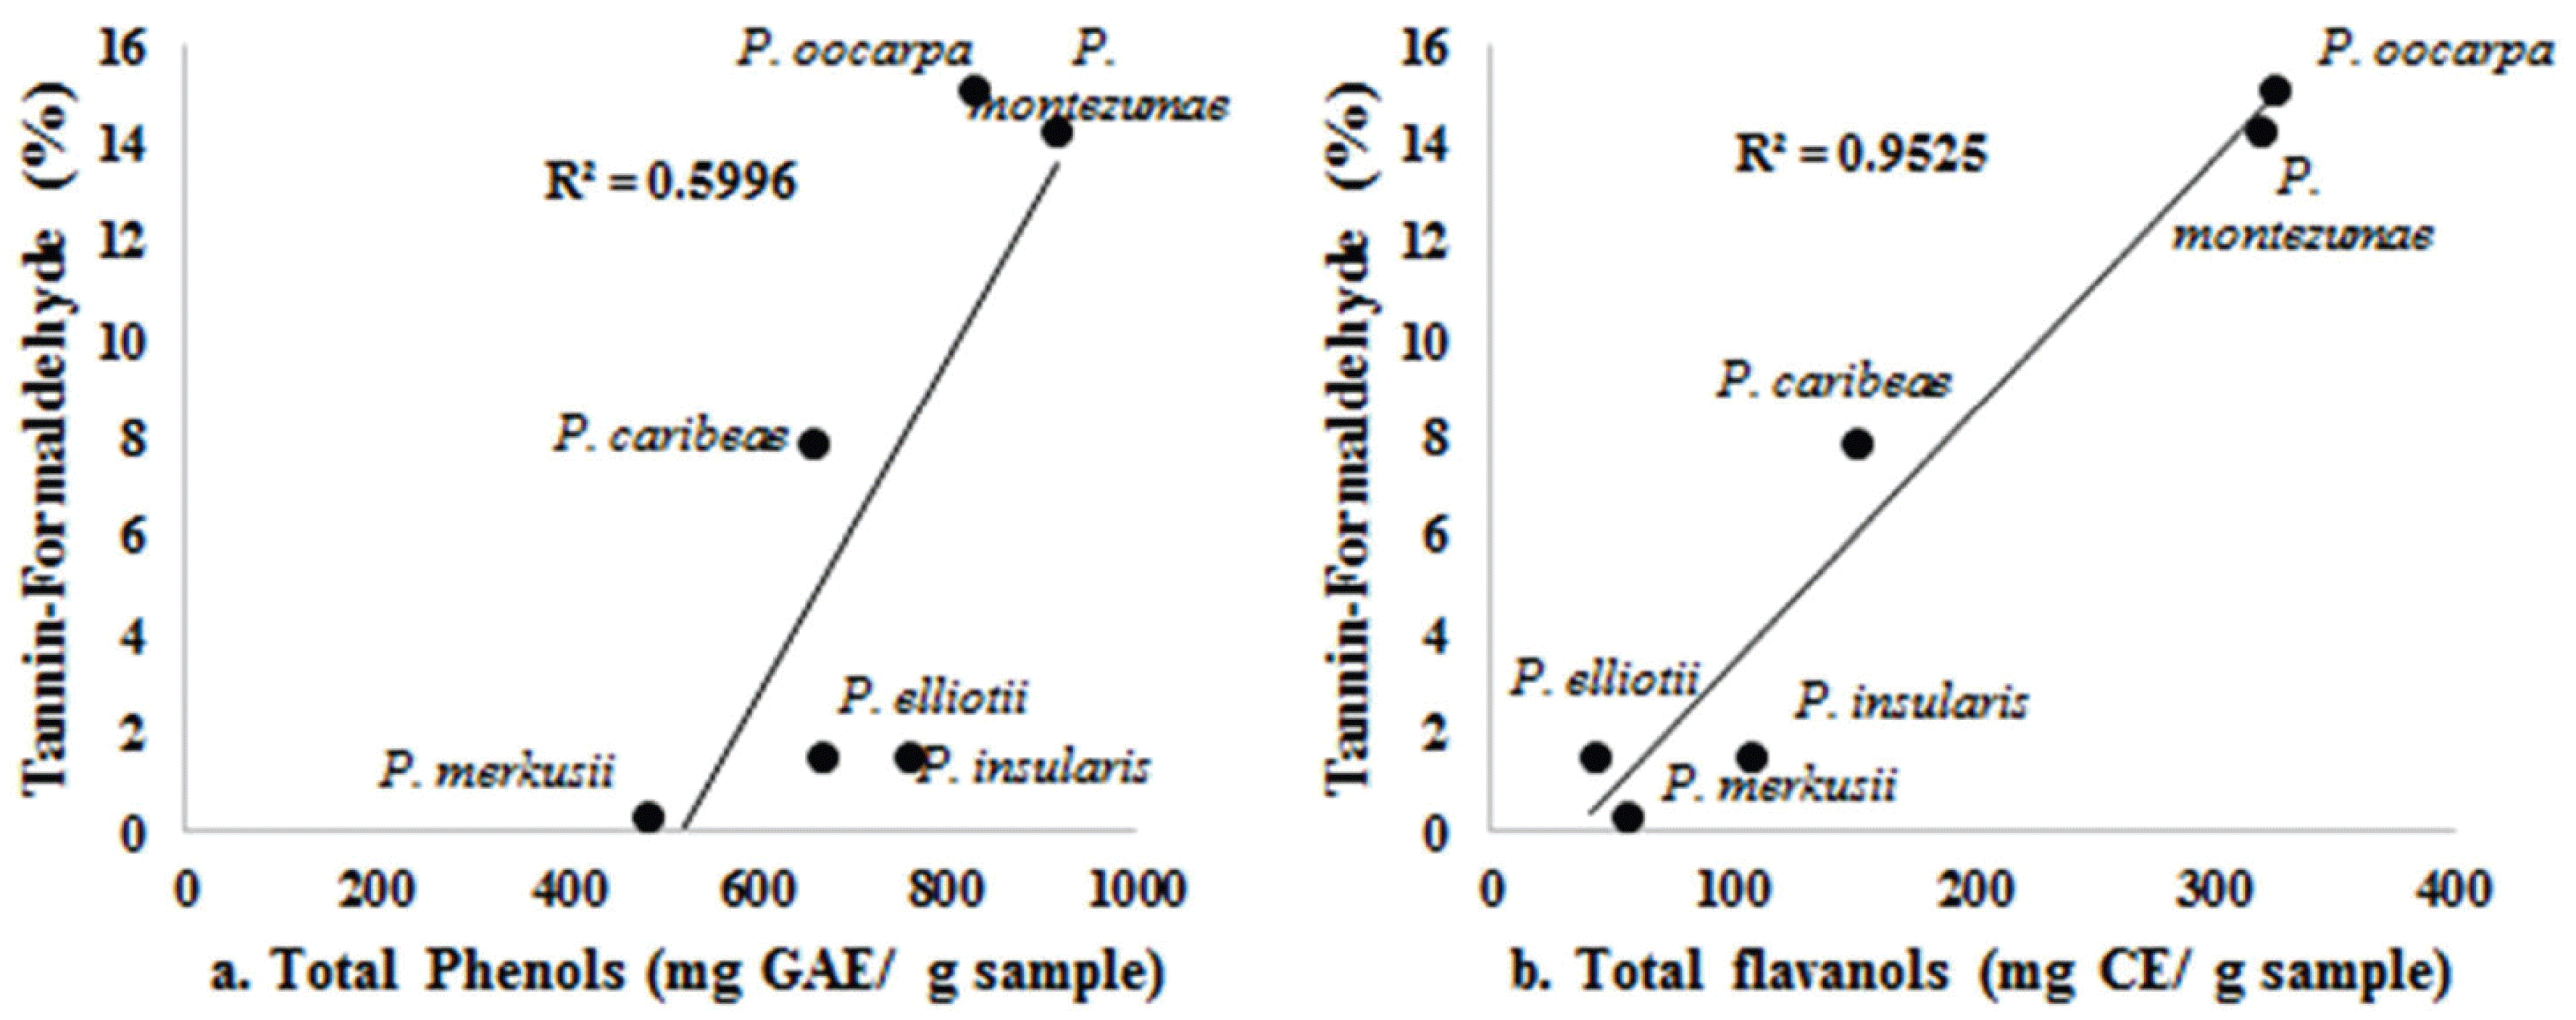
P. oocarpa (15.1%) and P. montezumae (14.2%) displayed the highest levels of tannin–formaldehyde contents, while P. merkusii (0.4%) showed the lowest. These values were lower than those found for Stiasny number in the bark of P. densiflora (Kofujita et al., 1999) and P. radiata (Morita et al., 2001). Due to the paucity of the inner bark samples, the measurement of tannin formaldehyde in the inner barks was not conducted.
Tannins are water-soluble phenolic compounds with their molecular weights ranging from 500 to 3000 and they are classified into hydrolyzable (aliphatic polyol and phenolic acids) and condensed tannins proanthocyanidins (Umezawa, 2001). Our results indicated that tanninformaldehyde values correlated better with the total flavanol content than they did with total phenol content (Fig. 2. a and b). It could be considered that tanninformaldehyde in the bark of the six Pinus species contain condensed tannins with a flavan-3-ol structure (C4-C8 bonds). This finding is consistent with those of Mun and Nicholas (2017), Mun (2014), Yesil-Celiktas et al. (2009), and Ku et al. (2007) in which taxifolin, cathecin, and proanthocyanidin were found in the bark of P. brutia, P. pinea, P. sylvestris, P. nigra and P. radiata.

The pH values of samples had ranged from 4.2 to 6.5, meaning that all samples were acidic. The outer bark of P. caribea had the lowest pH value (4.25), while its inner bark had the highest (6.5). These results corroborate the findings of a great deal of the previous study which stated that the outer barks of some trees in Europe were more acidic than their inner barks (Fengel and Wegener, 1989). In relation to total phenols, the values of outer bark samples were higher than those of inner barks (Table 1). Thus, it can be suggested that the pH values were partly affected by phenolic contents.
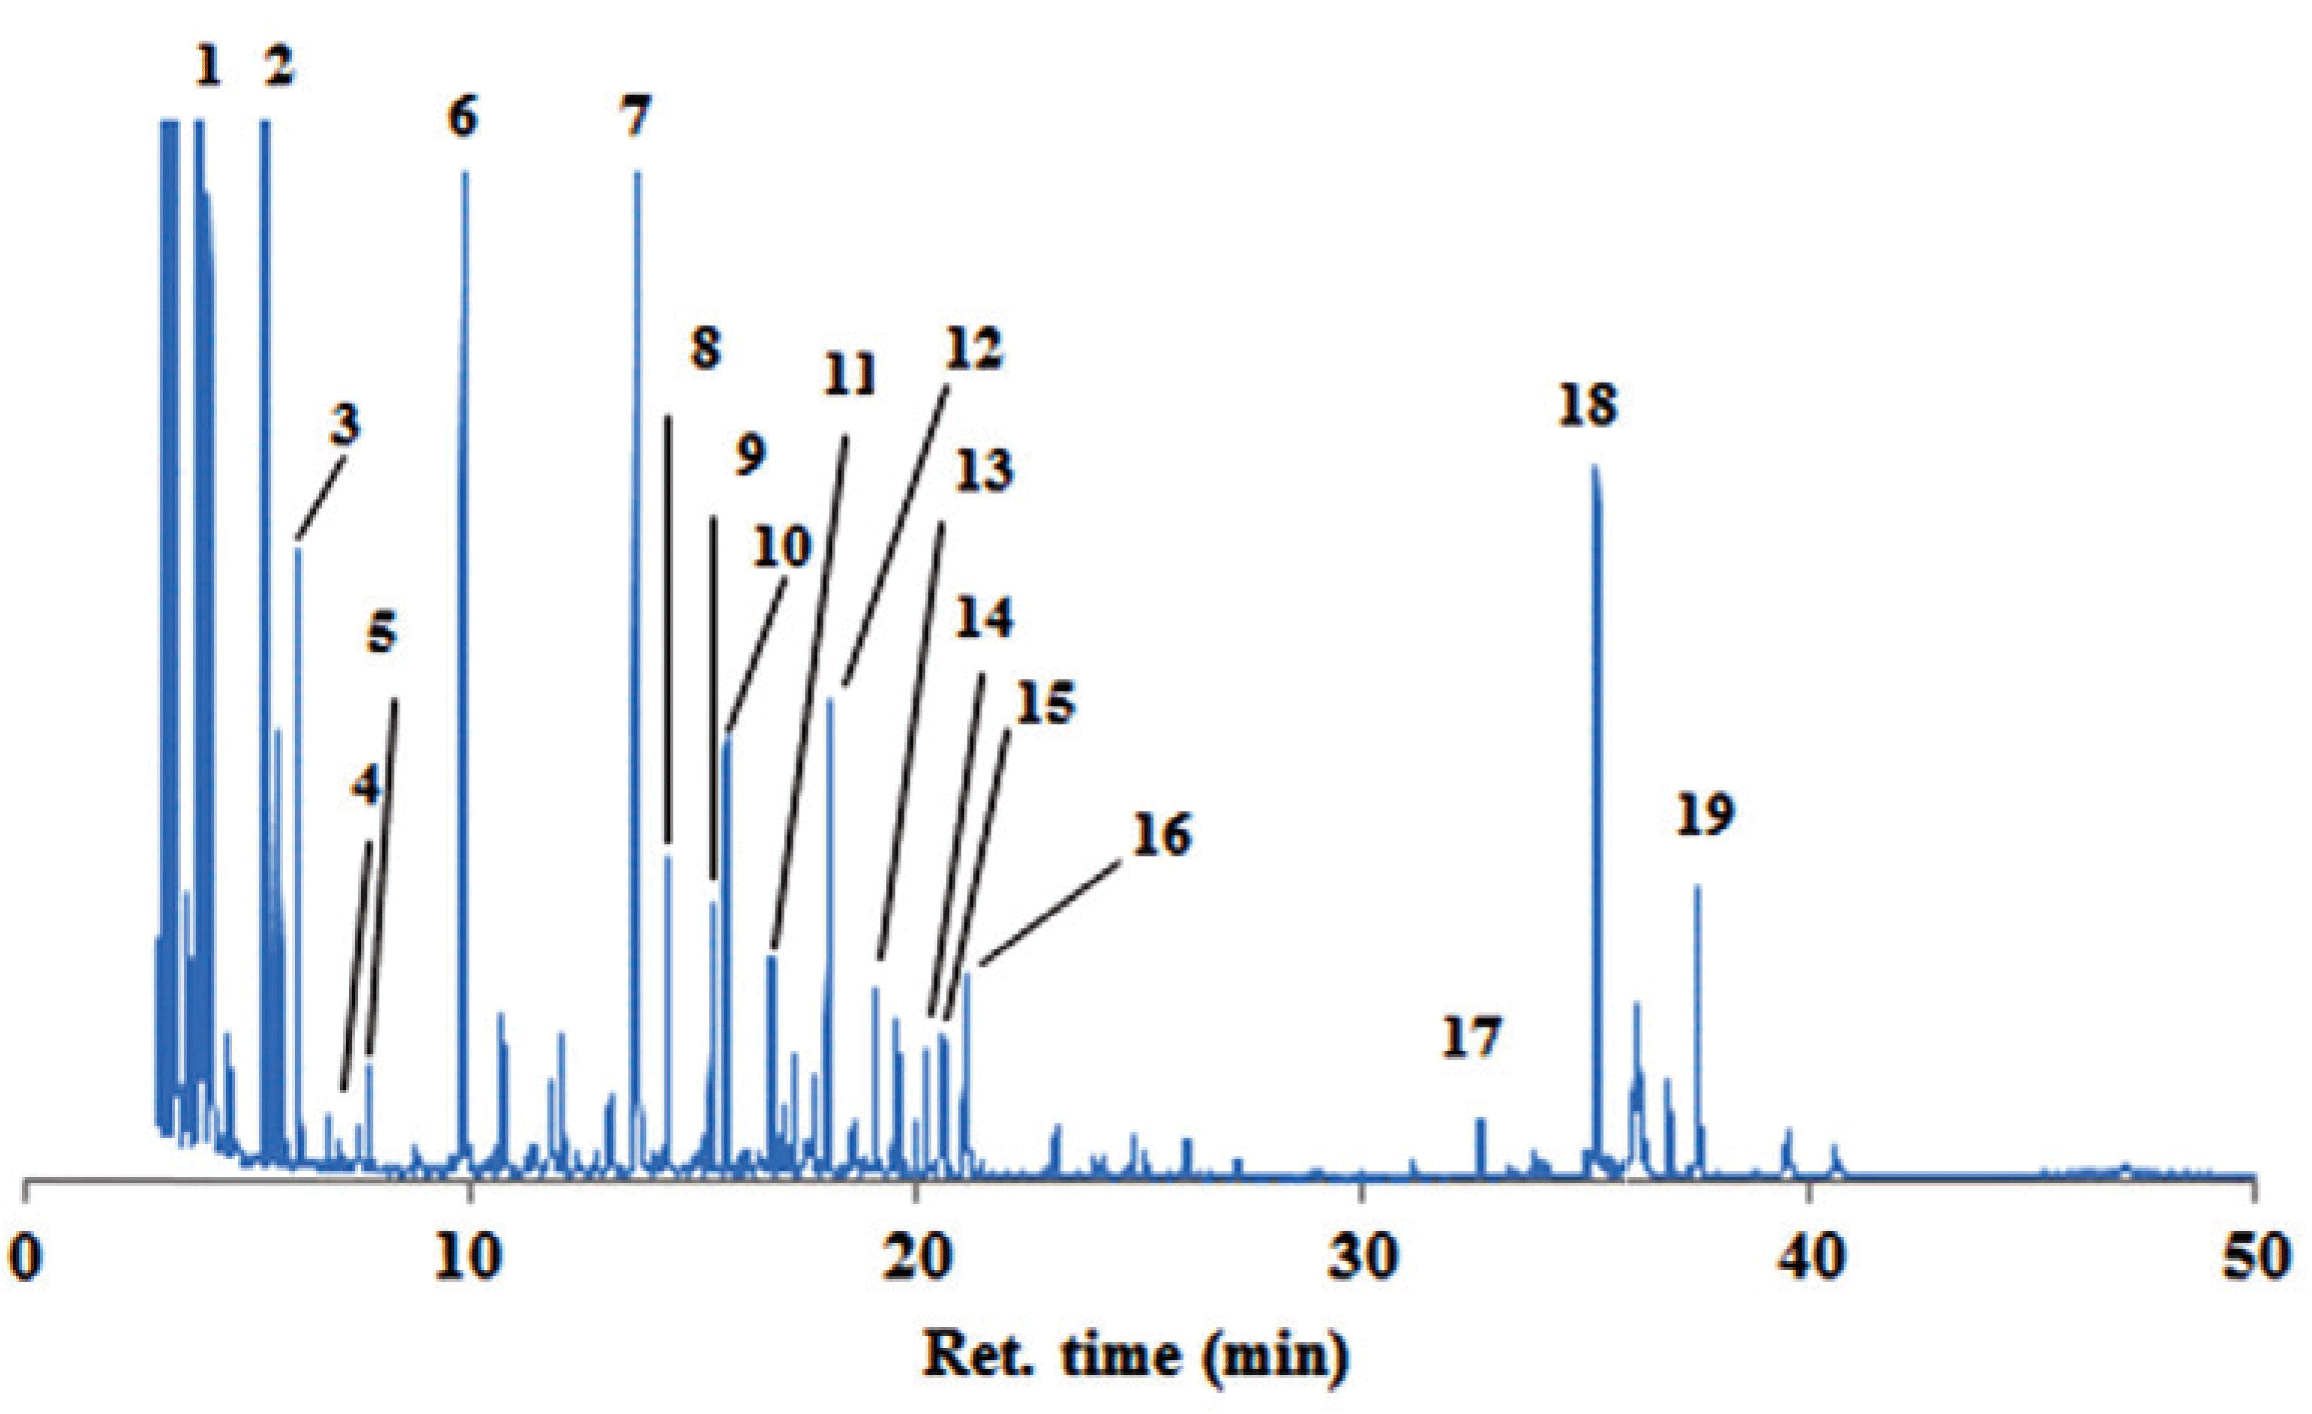
The ethanol soluble extract of the bark samples were investigated by GC-MS for the composition of hydrophilic constituents. Fig. 3 showed chromatograms from the inner bark extracts of P. merkusii by derivatisation method (trimethylsilyl/TMS derivatives). The hydrophilic constituents (Table 2) in the bark samples can be grouped into nitrogenous compounds /NCs (retention time 5-20 mins), sugars (ret. time 9-30 mins) and phenolics (ret. time 16-40 mins). The quantification of the constituents is shown in Table 2.

Compare with Petersson (1969) and Medeiros and Simoneit (2007)
Compare with Pruestos and Komaitis (2013)
NCs were dominant hydrophilic extractives in the barks of six Pinus species. NCs in the samples were detected as TMS derivatives based on their similarity from the library. Their presences were already studied using derivatives GC-MS technique (Zarate et al., 2016; Rohloff, 2015; Molyneux et al., 2002). Higher quantities of NC were detected in the inner barks than in the outer bark samples but P. insularis was an exception. Monoamidomalonic acid and pyrazine were the major NCs in the samples. The inner bark of P. merkusii showed the highest NCs content (38.46%) while the lowest was found in P. caribeae (9.6%). Normorphine was the only NC detected in great amounts in P. merkusii (5.66%) and it is also a potential chemotaxonomic marker among other species. The other TMS- NCs in the samples were N-acetylglutamine, glycine (amino acid), propylamine, serine (amino acid), thiadiazole and h-imidazole (biotin) which were detected by GC-MS via derivatisation (Zarate et al., 2016; Rohloff, 2015), and most of them were amino NC.
The presence of amino NC in Pinus bark was consistent with studies of NCs in the xylem sap root of P. serotina as well as in the bark, wood, and foliage of P. sylvestris as amino compounds and glutamine (Barnes, 1962; Nordin et al., 2001). These amino NCs of alkaloids could be considered due to their biological activities as reported in the study (Umezawa, 2001; Agustini et al., 2014).
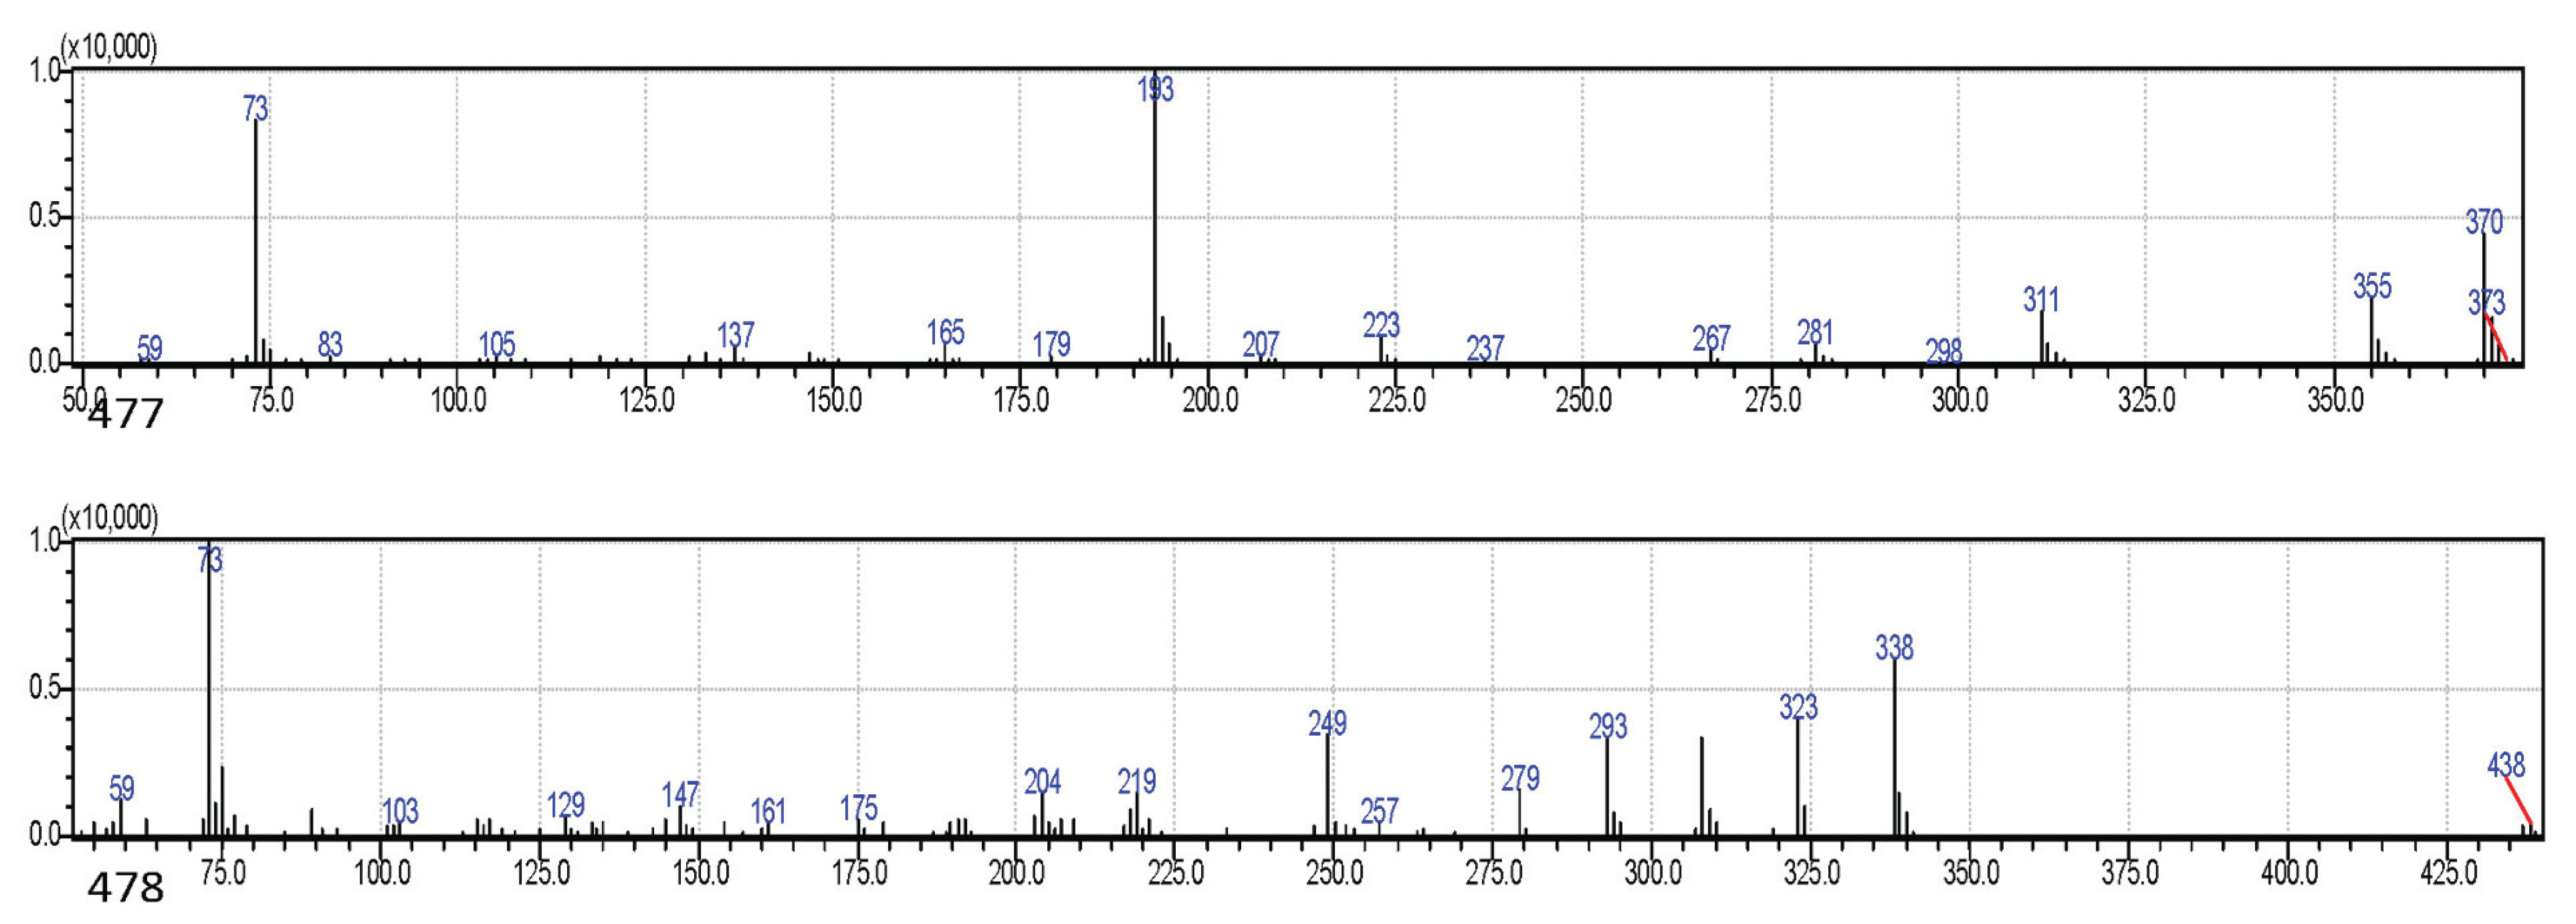
The sugar compounds in the samples were identified as TMS derivatives. The mass spectra of sugars have been compared with the mass spectra from previous studies (Medeiros and Simoneit, 2007; Petersson, 1969). For example, the sugar of glycerol, xylitol, d-pinitol, d-glucose, glucopyranose, and d-mannitol (Table 3) showed m/z 73 as the base peak in all spectra, and m/z 147 as the peak. Both peaks, m/z 73 and 147 characterised most of the sugar compounds which have more than one trimethylsiloxyl group (Petersson, 1969).
The findings showed that higher quantities of sugar compounds were found in the outer barks of P. elliotii, P. caribea, and P. merkusii than in their inner barks, but the reverse was the case with P. oocarpa, P. montezumae, and P. insularis. Indeed, the highest quantity of total sugar was detected in P. merkusii (32.58%) and the lowest, in P. montezumae (5.45%). D-pinitol, xylitol, and glycerol were the dominant sugars that were detected in the six samples, whereas d-psicopyranose, (isomer 2), glucopyranose, galactopyranose, d-mannitol, TMS ether of glucitol, glucopyranose, isomer and d-glucose were the minor components. These compounds were easily detected by GC-MS as TMS derivatives (Zarate et al., 2016; Rohloff, 2015). The presence of higher sugar content in the inner bark than in the outer bark samples showed a trend that is similar to that of the bark of P. loblolly (Eberhardt, 2012).
There were higher concentrations of phenolics in inner bark samples than in outer barks with the exception of P. caribeae, P. oocarpa, and P. insularis. The highest quantity of phenolics (4.51%) was shown by P. merkusii while P. oocarpa had the lowest (0.35%). Hydroxytyrosol was the major phenolic detected in the radial samples while p-trimethylsilyloxyphenyl was only detected in the inner bark samples. The phenolic of ferulic acid-TMS was found in P. elliotiii, and catechol lactate-TMS was found in P. merkusii and P. insularis. The glycoside of thymol-β-d-glucopyranoside was detected in all inner bark samples except for P. elliotii and P. insularis. The appearance of this glycoside (sugar with monophenol) in inner barks revealed that phenolics were glycosylated. Previously, simple phenols, glycosides, and aromatic acids were reported in the bark of P. nigra by qualitative method (Hafizoğlu et al., 2002) and also were isolated in the bark of Cercidiphyllum japonicum (Lee et al., 2016), Juglans mandshurica (Li et al., 2018). All phenolic compounds detected as TMS derivatives in the bark samples were estimated as monophenol (Fig. 4). Ferulic acid-TMS (MW: 338) and hydroxytyrosol (MW: 370) in these bark samples were identified by comparing their mass spectra in the literature (Pruestos and Komaitis, 2013).

Consistent with the previous study, this study revealed that the presence of both ferulic acid and hydroxytyrosol in the bark of P. sylvestris and P. halepensis has anti-inflammatory and antimicrobial effects (Karonen et al., 2004; Mohareb et al., 2017). The phenolic compounds such as monophenolics and polyphenolics are the important constituents especially in the bark of Pinus species. The present results indicated that polyphenolics were not detected by GC-MS, thus, further work should be carried out on detecting polyphenolics by HPLC or other tools in the bark of the six Pinus species.
4. CONCLUSION
The quantity and composition of the hydrophilic extract that were derived from the barks of the six Pinus species were observed between the inner and outer barks. The quantities of ethanol and hot water soluble extracts in the outer bark were higher than those in the inner bark except for P. elliotii. The total phenols of outer bark samples were in higher concentrations than those of inner bark samples but the total flavanols measurement showed a reverse pattern. The quantities of Tannin-formaldehyde in the outer barks of the six Pinus species were in good correlation with that of total flavanols.
By GC-MS, the TMS derivatives of NCs, sugars, and phenolics were detected in higher amounts in the inner bark samples than in the outer bark samples. NCs were the major group in the bark, followed by sugars, then monophenols. As the detection of constituents was merely conducted by library and some components showed relatively low similarity index levels, confirmation by the injection of standard components should be carried out in the future works. Furthermore, HPLC investigation would be useful in discovering the phenolics. Nevertheless, the high level of total phenols in the outer barks, total flavanols in the inner barks and several other important compounds that were detected as TMS derivatives in the samples suggests that the hydrophilic extractives of the barks of these families are potent to be biologically active.
