1. INTRODUCTION
The stability of timber frame building is highly influenced by moisture content (MC) of structural members (Lee, 2016b). The structural health condition of the old timber building should be monitored by checking the MC of the structural member. The commercial MC meters provide a faster and easier evaluation of the MCs of wood-based products. The MC detected by the meter is affected by the wood characteristics, density, grain direction, and thickness of wood as well as the applied technologies in the MC meters.
In case of wood exposed to outdoor, it is easy to observe decay by fungi. Wood decay by fungi is related to the initial MC of wood as well as the characteristics of the fungi and the wood species (Kazemi et al., 2001). Nowadays, mechanical devices for detecting the wood decay are used to overcome the limitation of visual inspection (Son and Lee, 2004). The initial MC of wood is necessary to use the mechanical devices for detecting wood condition and helpful for maintaining the stable condition of timber structures.
Jung and Smith (1994) evaluated the EMC of red pine, eastern white pine, eastern hemlock, and Norway spruce dried by conventional kiln dry and high temperature dry. The specimens were equilibrated to 15 % of the target EMC at 25 °C (relative humidity: 77 %) and the EMCs of the specimens were determined by using oven-dry method, resistance meter, and capacitive-admittance meter. The measured EMCs of specimens were affected by the species and the applied dry method. Moreover, the EMCs of specimens differed greatly between the MC measurement methods. The resistive meter is affected not only by the moisture inside wood but also by the chemical composition of the wood. Capacitive-admittance meter is influenced by the density as well as the moisture inside wood. When MC of wood is measured by the commercial MC meters, the user should know the characteristics of the MC meter and the wood species to reduce the measurement error.
It is difficult to measure MC of real wood member correctly due to the MC gradient inside the member (Kim et al., 2017). Especially, softwood have the higher MC gradient than the hardwood. Although oven-dry method is generally used for measuring MC of wood materials (Yang et al., 2017), the MC of wood members in timber frame building cannot be measured by oven-dry method. Moreover, the actual MC of wood in the outdoor is changed depending on the temperature and humidity (Ra, 2014; Ra, 2018). In this case, the nondestructive testing (NDT) method should be adopted. Commercial MC meters are made by using the principle of dielectric or resistance of moisture. The displayed MC on the commercial meter is affected by the setting conditions, temperature or density (Oh, 2016; Kang et al., 2017). Thus, the accuracy and sensitivity of the commercial moisture meters for domestic wood, especially exposed to outdoor for a long time, should be previously checked depending on the various setting conditions.
The purpose of this study was to evaluate MCs of wood products using NDT methods dielectric moisture meter and resistance meters. To measure the MCs of domestic wood products more reliably, the effects of setting conditions of the meters and characteristics of materials on MC measurement were analyzed.
2. MATERIALS and METHODS
To investigate the relationship between the measured MCs and the characteristics of materials, three kinds of wood products, solid wood, glulam, and cross-laminated timber (CLT) were prepared. The wood products used in this study are from larch (larix kaempferi, 560 kg/m3) and pine (pinus koraiensis, 430 kg/m3). Fig. 1 shows types and orientations of the specimens. The sizes, species, and contacted plane of specimens were also considered. Table 1 shows the specimen nomenclature and the specimen conditions, type, species, size, and MC condition. The nomenclature of specimens were determined depending on the specimen type, species, a value of X dimension (mm), and the MC of conditions. The first letter indicates the type of specimen (S: solid wood, G: glulam, and C: CLT). The second letter indicates wood species (L: larch, P: pine). The third number indicates the X dimension value which was the thickness of specimens. The 150, 180, and 240 mm thick glulam were consisted with 4, 6, and 8 layers and the thicknesses of all laminas in glulam was 30 mm. The 90 mm thick CLT was consisted with 3 layers and the thicknesses of all laminas were 30 mm. The 120 mm thick CLT was consisted with 5 layers and the thicknesses of outer and inner laminas were 30 mm and 20 mm, respectively. The last letter indicates the MC conditions of specimens. EMC condition means that the specimens were stored at environmental chamber to be the target EMC (12 % or 19 %). Saturated condition means that the specimens were immersed in water to be over 30 % MC.
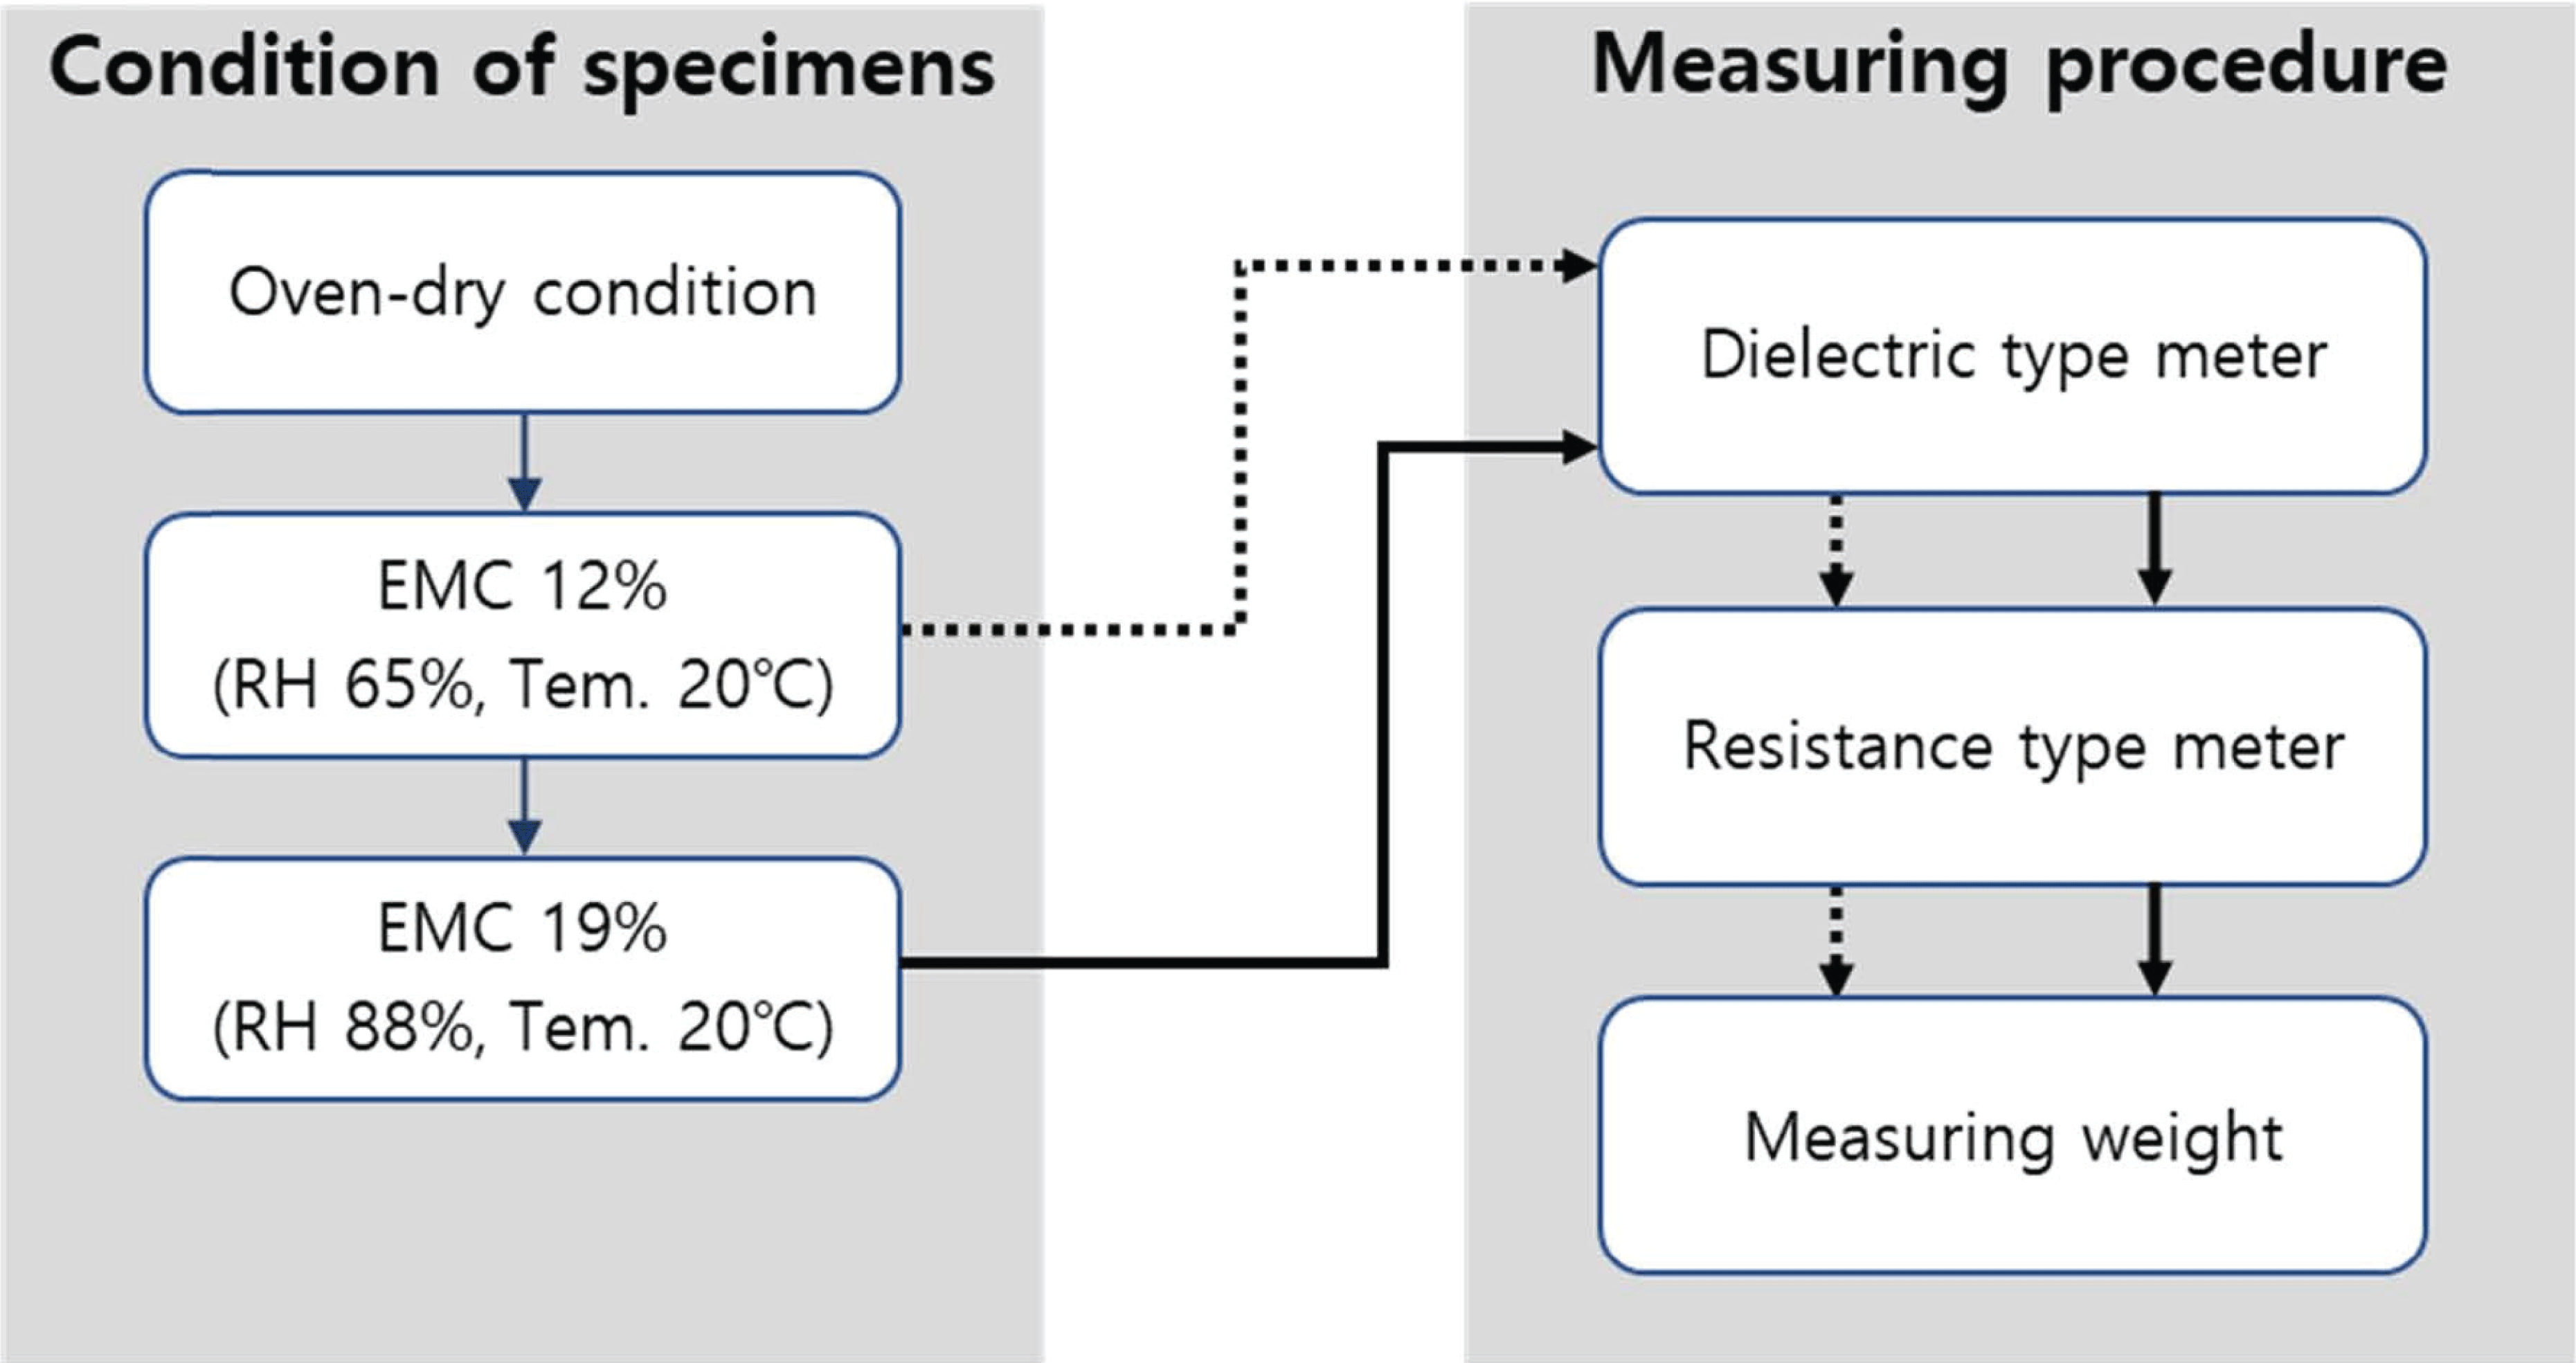
Specimens of two groups, S-L-30-S and S-P-30-S, were immerged in water to reach saturation. The other specimens except for the two groups were conditioned in the environmental chamber with different RH at 20 °C to reach EMC of 12 % and 19 %. Fig. 2 shows the procedure of conditioning steps for changing the MC of specimens and the measuring steps for detecting the MC of specimens. Each different conditioning period was determined by comparing weight changes of specimen every 3 days. If the specimen weight was changed less than 1 %, MC of specimens at the target condition was taken and moved to the next condition. The MC of specimens at EMC 12 % and 19 % was measured using two dielectric type moisture meters (MC-160 SA and MC-380 XCA, Exotek Instruments, Germany) and a resistance type meter (MC-460, Exotek Instruments, Germany). In order to derive the MC of all specimens by oven dry method (ASTM D 4442, 2007), the specimens weight was measured using a digital balance (HS 2100F, Hansung Ace Co., Seoul, Korea) with a sensitivity of 0.01 g.
The dielectric type MC meter detects the dielectric changes due to the MC in a material using a high frequency digital signal (Exotek, 2013 a and b). The scanning depths for MC-160 SA and MC-380 XCA were 50 mm and 100 mm, respectively. Fig. 3 (a) shows the schematic diagram to measure the MC of specimens by using the dielectric type moisture meters. The MCs of specimens were measured after the specimens were placed on the 50 mm thick polystyrene to avoid the influence of the basement material under the specimens.
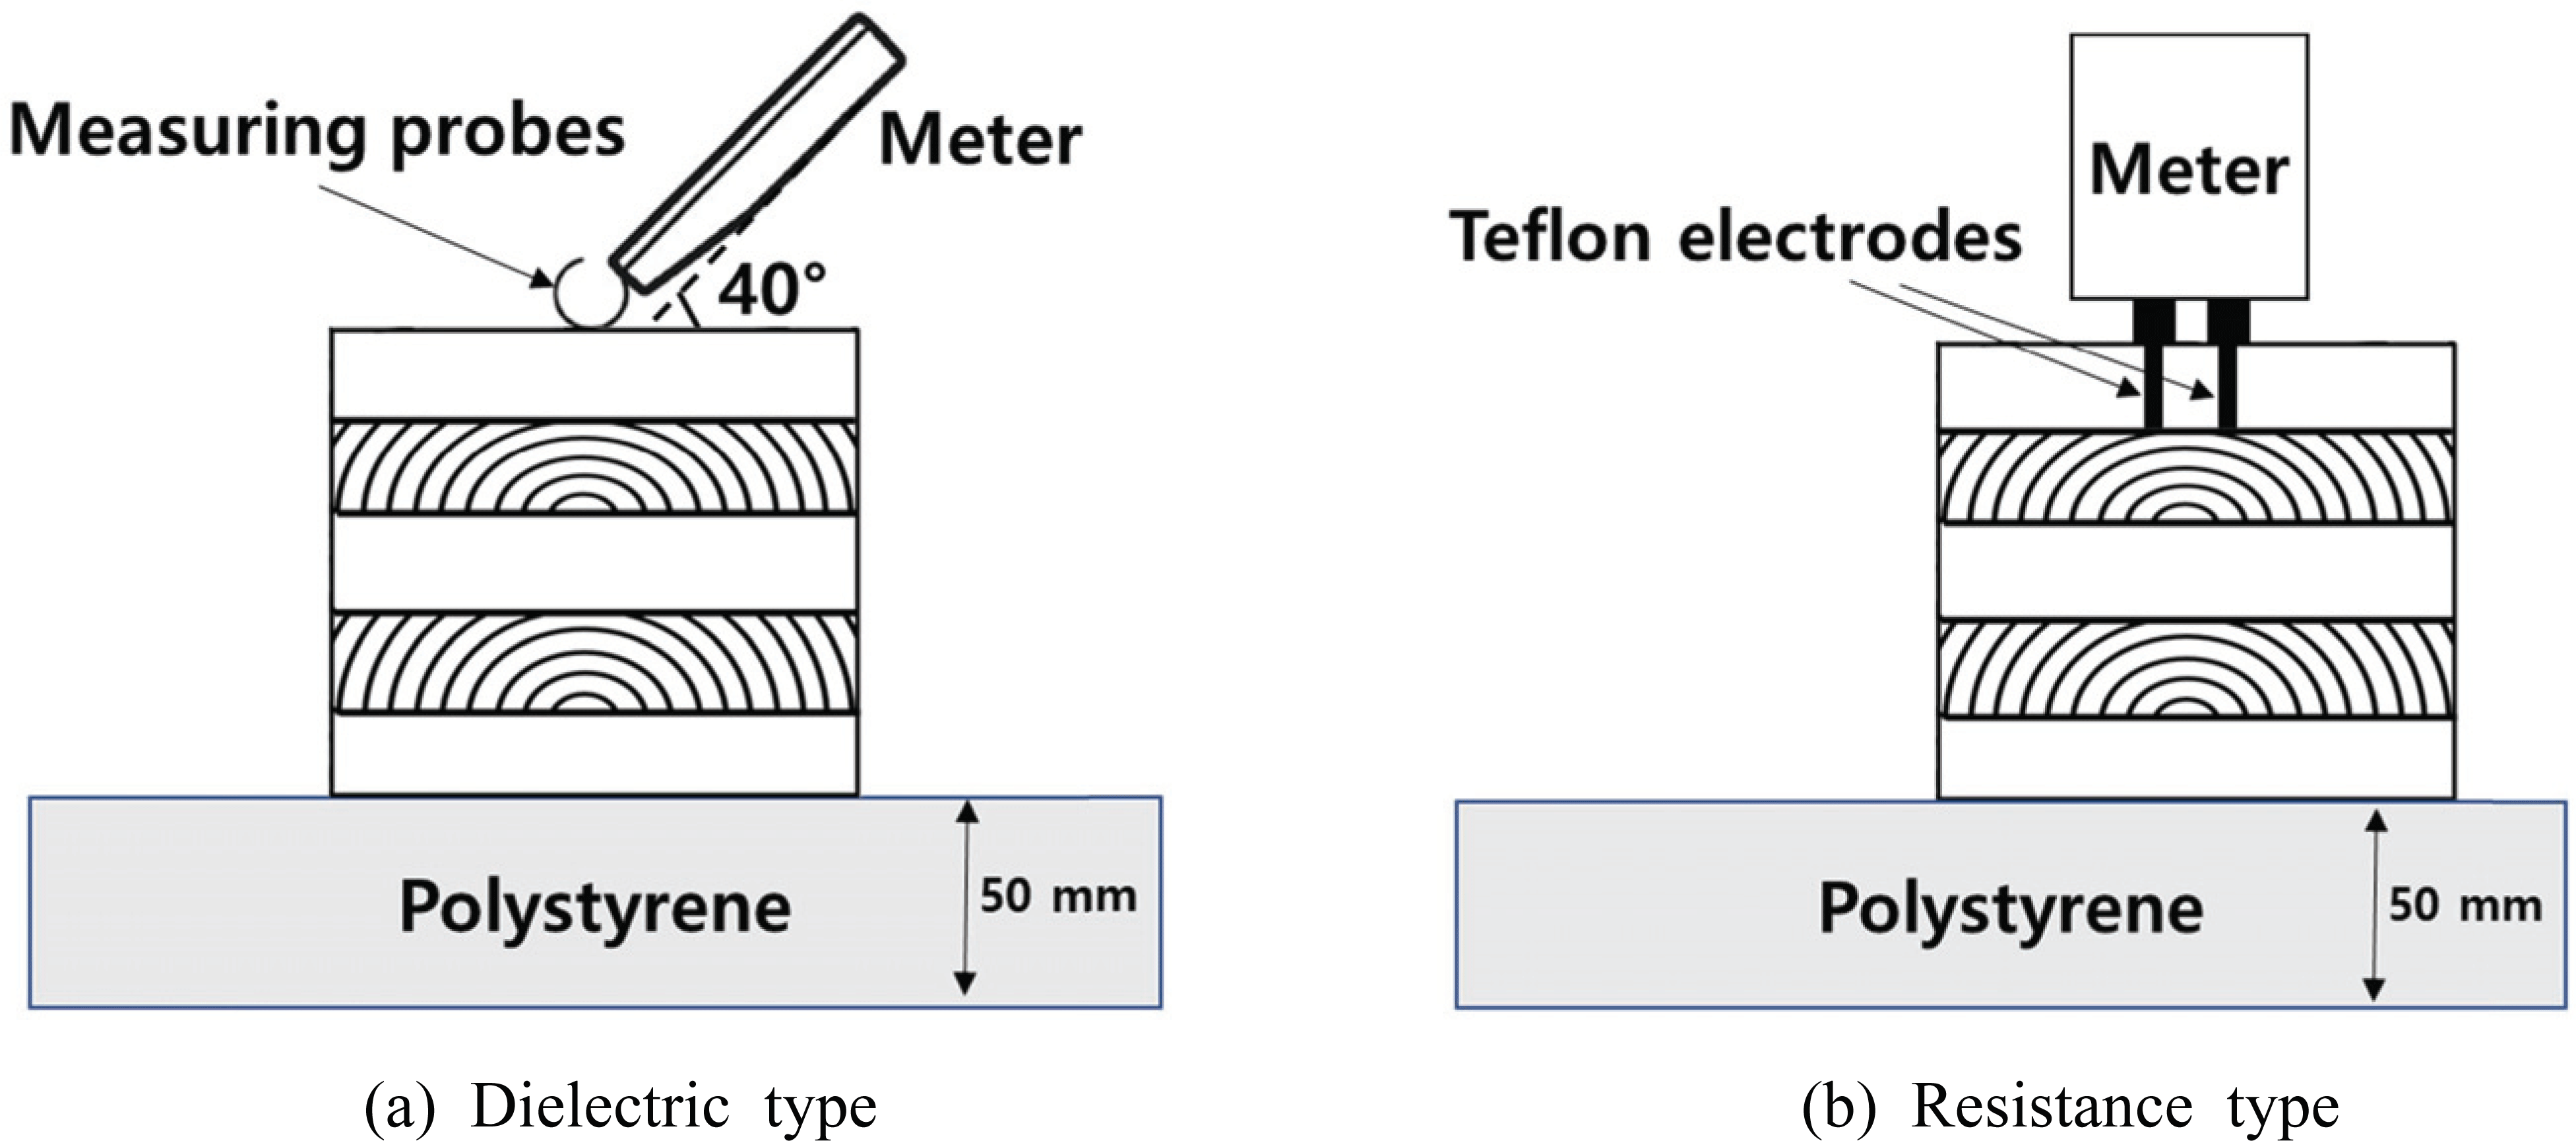
The measuring probes of the meter were contacted the X-Y plane and X-Z plane (Fig. 1) of the test specimens and the probes were inclined in an approximately 40° angle to the specimen. When the probes were contacted the X-Y plane, the probes were arranged to the perpendicular to the longitudinal direction. When the probes were contacted the X-Z plane, the probes were arranged to the parallel or perpendicular to the longitudinal direction. To check the sensitivity of the MC meters by density, the MC of specimen was measured by changing the setting of wood density as 400, 500, and 600 kg/m3 in the meters. All MC measurements were taken after 3 seconds.
The resistance type MC meter detect the resistance changes due to MC in a material using an electrical signal (Exotek, 2013 c). Fig. 3 (b) shows the schematic diagram to measure the MC of specimens by using the resistance type moisture meters. The 30 mm length of electrodes (from end point to 10 mm: no insulated, from 10 mm to 30 mm: teflon-insulated) were inserted to the surface of the specimen at the X-Y plane and X-Z plane (Fig. 1) in 90° angle. When the electrodes were inserted into the X-Y plane, the electrodes were arranged to the perpendicular to the longitudinal direction. When the electrodes were inserted into the X-Z plane, the electrodes were arranged to the parallel or perpendicular to the longitudinal direction. To investigate the effects of density and temperature on MC measurement, different settings including 4 different wood group options (WG1, WG2, WG3, and WG4) and temperatures of 0, 10, 20, 30, 35 °C were used. The temperature of the testing room and environmental chamber was 20 °C. The displayed MC of specimens was taken after 3 seconds.
To check the detectable penetration depth of dielectric type meter, four combinations were prepared as shown in Fig. 4. The four combinations were composed with the two grain directions (radial and tangential) and two MC conditions of contacted surface (12 % EMC and saturated MC).
3. RESULTS and DISCUSSION
Fig. 5 shows the results of the MCs measured by dielectric type meter (MC-380XCA) depending on its setting option (density). The measured MCs were decreased almost constantly as the setting value was increased.
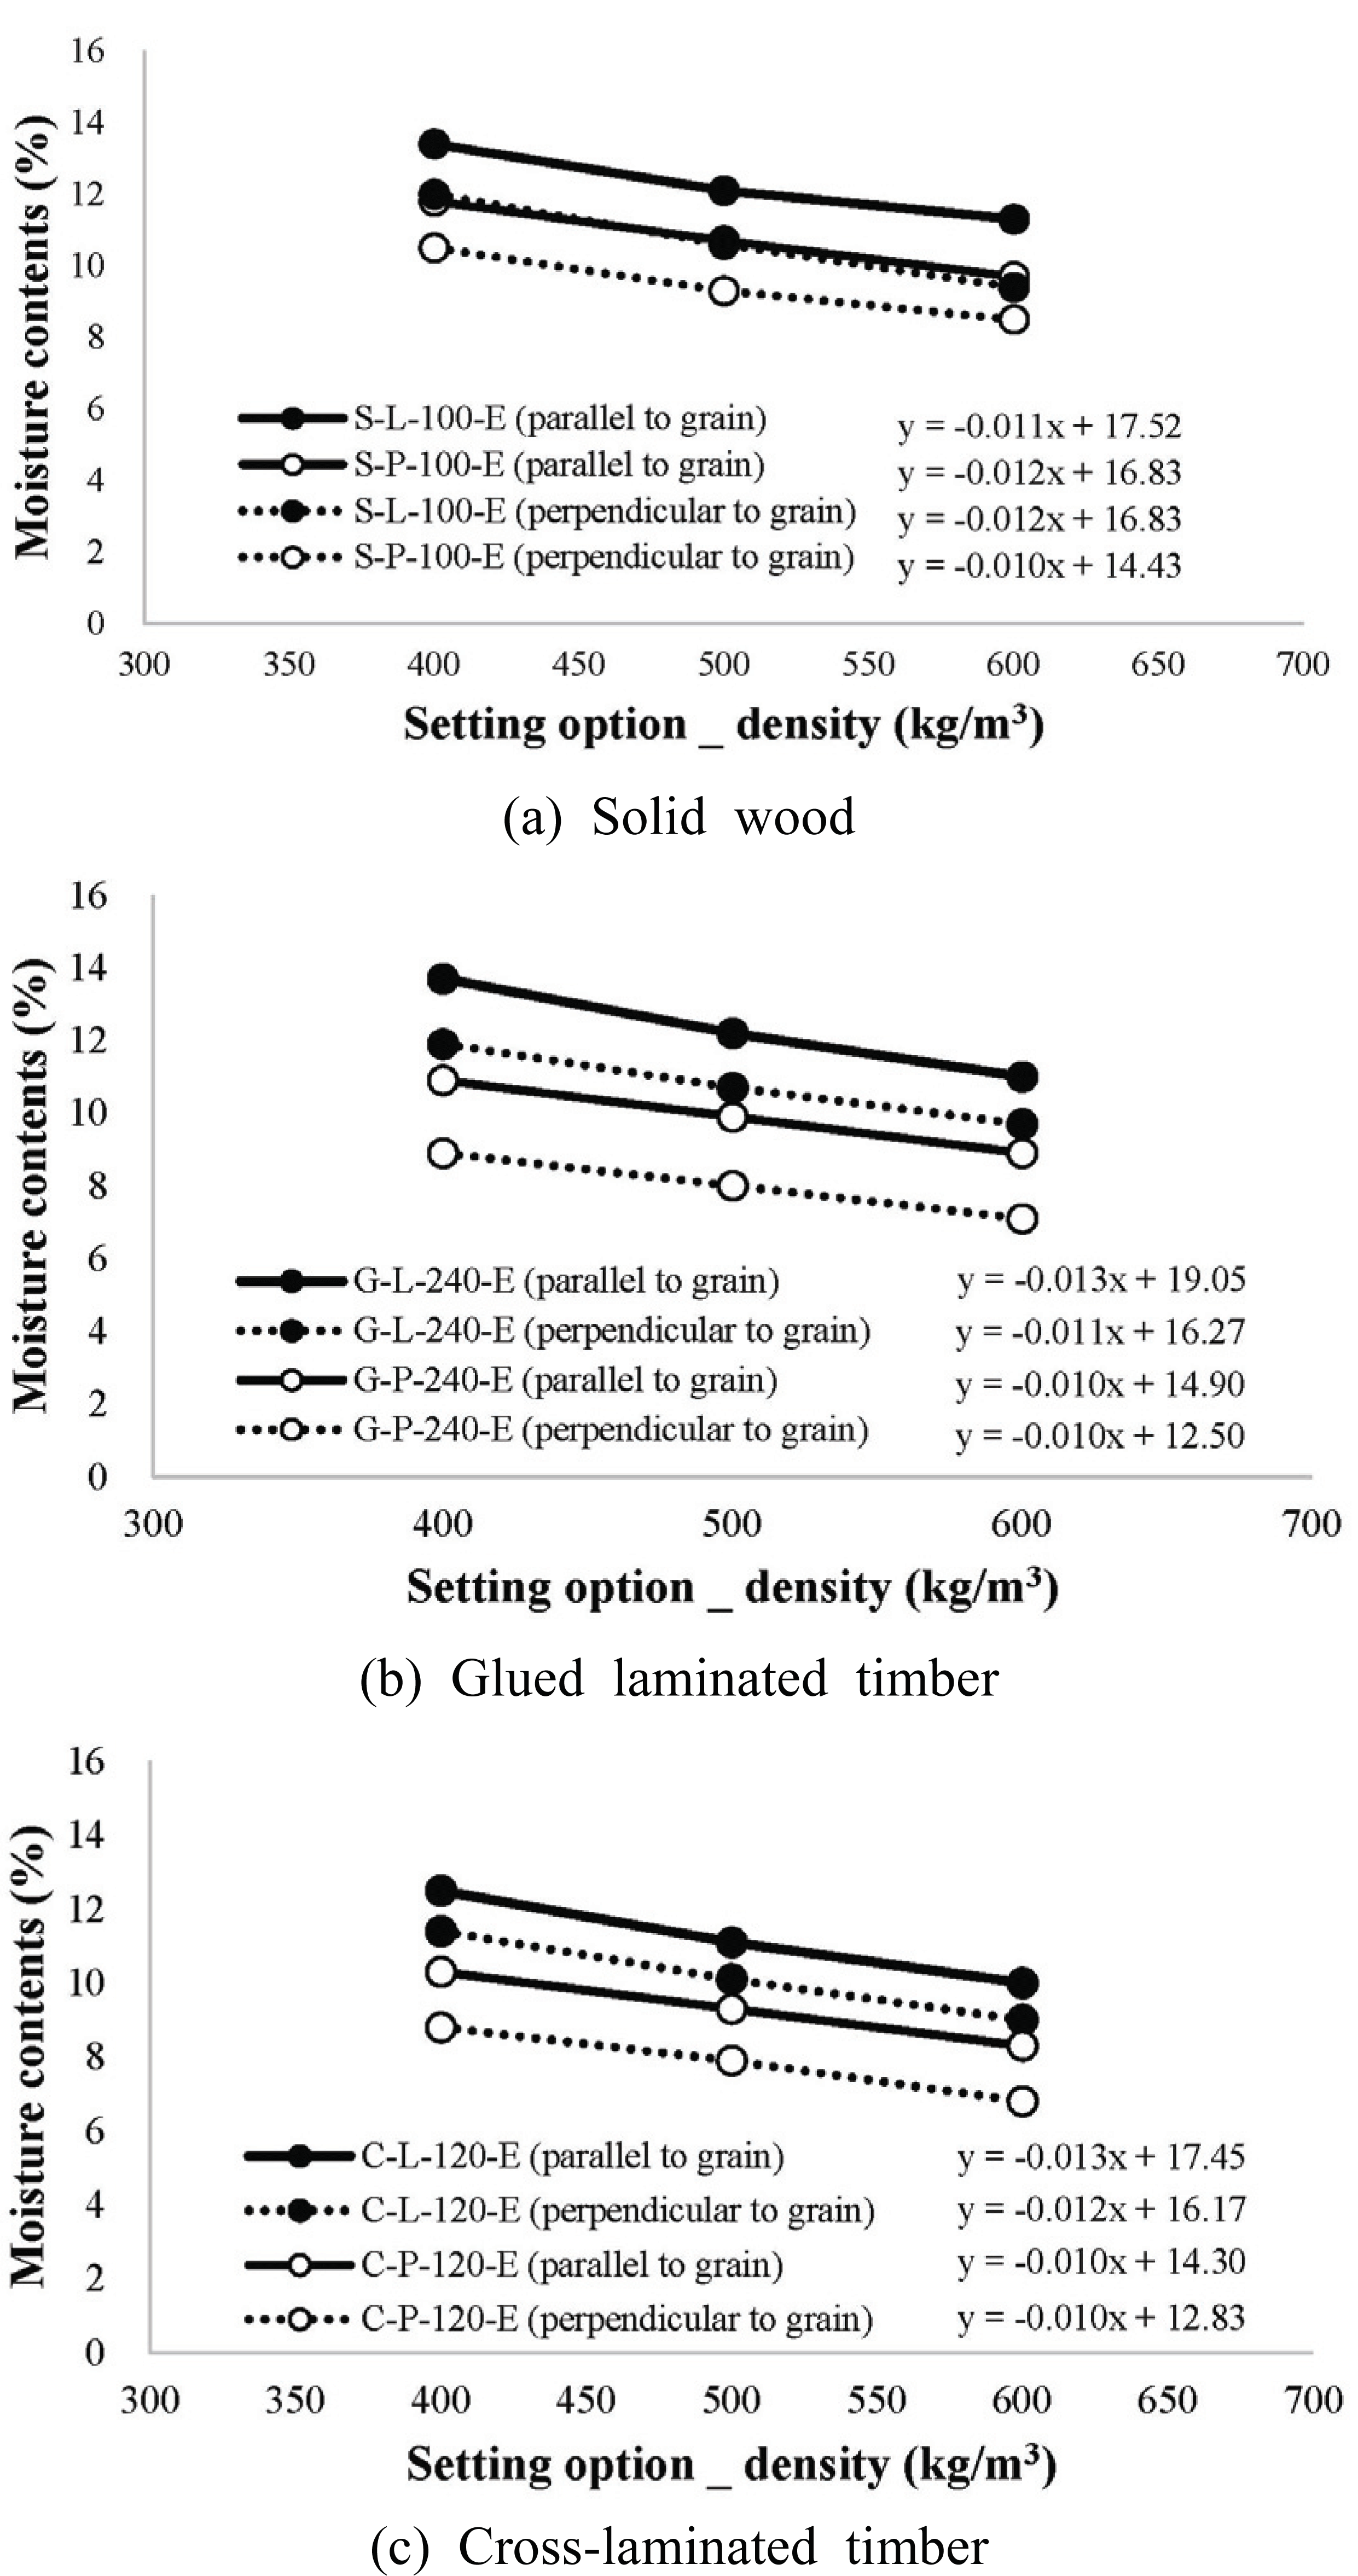
When the setting of density was changed from 400 kg/m3 to 600 kg/m3, MC of S-L-100-E and MC of S-P-100-E measured parallel to the grain direction were changed from 13.4 % to 11.3 %, and 11.8 % to 9.7 %, respectively. As the density setting was changed from 400 kg/m3 to 600 kg/m3, MC of S-L-100-E and MC of S-P-100-E measured perpendicular to the grain direction were changed from 12.1 % to 9.7 %, and 10.5 % to 8.5 %, respectively. In case of glulam, MC of G-L-240-E and MC of G-P-240-E measured parallel to the grain direction were changed from 13.7 % to 11.0 %, and 10.9 % to 8.9 %, respectively, while MC of G-L-240-E and MC of G-P-240-E measured perpendicular to the grain direction were changed from 11.9 % to 9.7 %, and 8.9 % to 7.1 %, respectively. In case of CLT, MC of C-L-120-E and MC of C-P-120-E measured parallel to the grain direction were changed from 12.5 % to 10.0 %, and 10.3 % to 8.3 %, respectively, and MC of C-L-120-E and MC of C-P-120-E measured perpendicular to the grain direction were changed from 11.4 % to 9.0 %, and 8.8 % to 6.8 %, respectively.
At the same setting value of density, the MC detected at the parallel to grain direction of specimen was higher than that detected at the perpendicular to grain direction of specimen. These results show that the density and the grain direction of wood products should be carefully considered to measure more accurate MC.
Figs. 6 and 7 show the results of the MCs measured by resistance type meter (MC-460) depending on its setting options (wood group and temperature). Fig. 6 shows that the effect of grain direction in resistance type meter was less than the dielectric type meter. The measured MCs were not much different depending on the grain direction of the specimen (G-L-120-E). The measured MC at perpendicular to grain direction (X-Z plane) was 11.5 % and the measured MC at parallel to grain direction (X-Z plane) was 11.3 % at WG3 setting option. The measured MC perpendicular to glue line direction (X-Y plane) was 11.7 % and the measured MC parallel to glue line direction (X-Y plane) was 11.5 % at WG3 setting option.
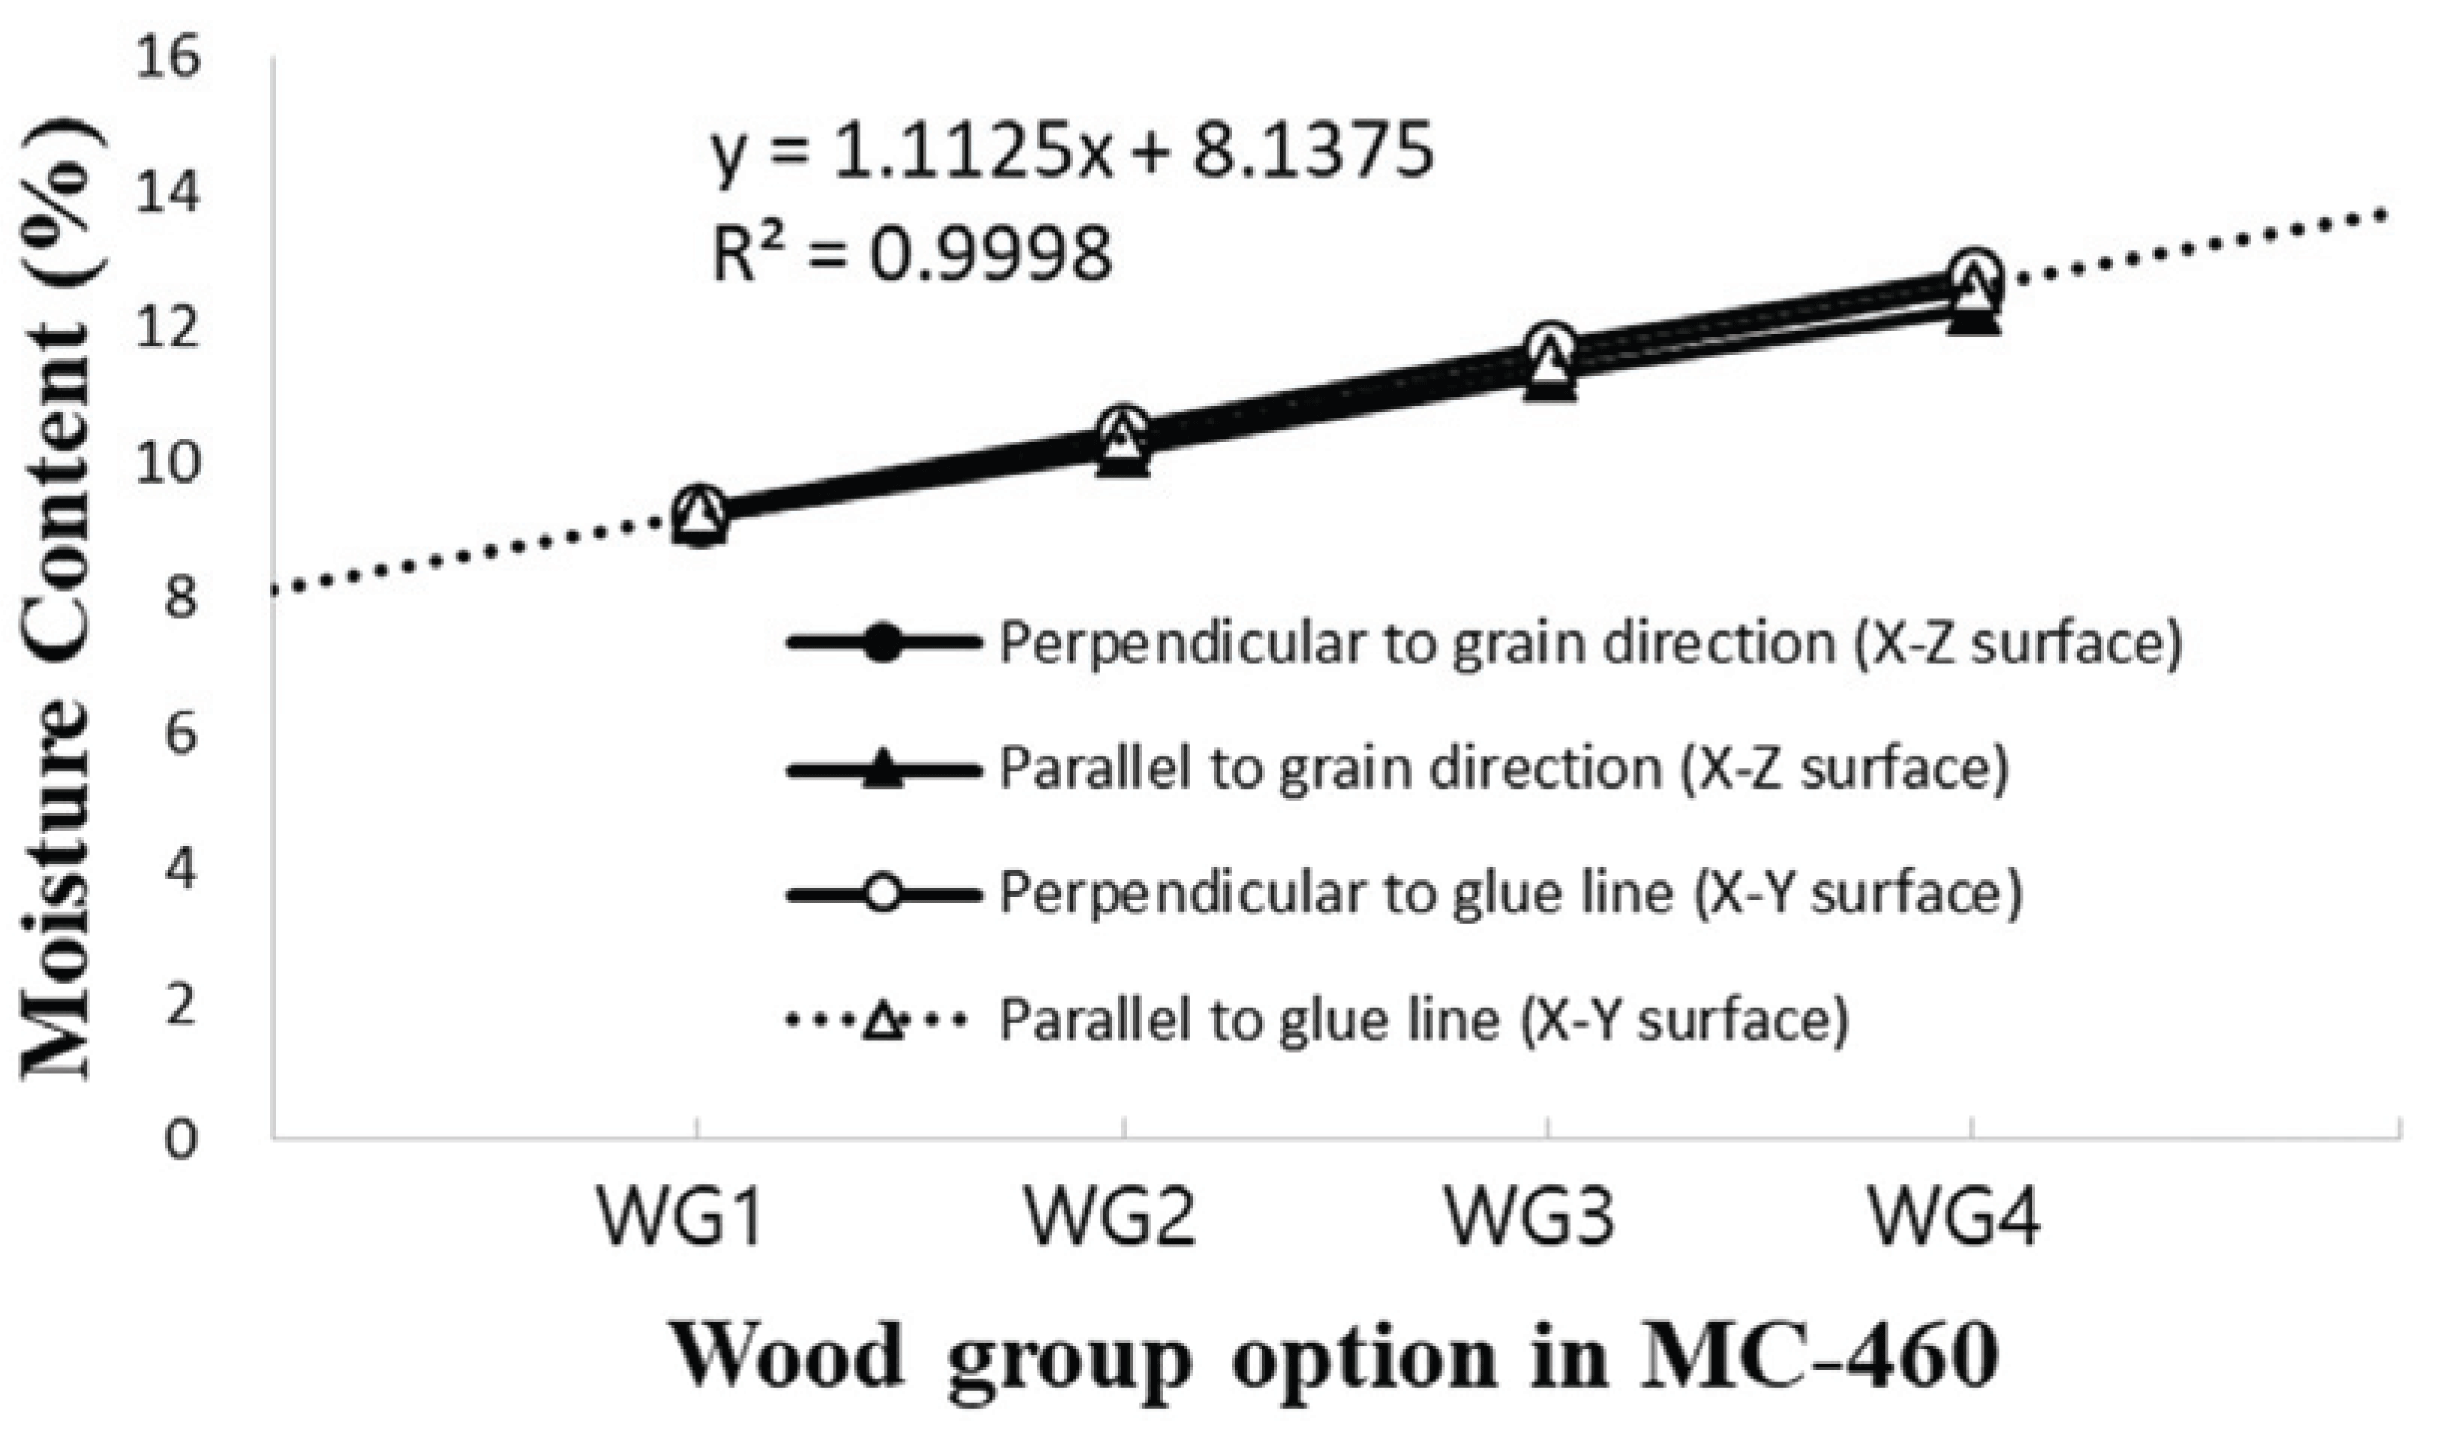
The MC-460 provides the wood group options which represent some wood species instead of wood density values. For example, African zebrawood, imbula, noble fir, and tchitola wood are a group of WG1. Afzelia, beech, cedar, and teak wood are in WG2. Hemlock, larch, pine, and oak wood are in WG3. Bubinga, sipo, and tiama wood are in WG4. The MCs measured by changing the setting groups were changed almost constantly as a slope of approximately 1.1. When the setting of density was changed from WG1 to WG4 at 20 °C and EMC 12 % conditions, the MC of G-L-120-E was increased from 9.2 % to 12.3 % measured parallel to grain direction (X-Z surface) and from 9.2 % to 12.6 % measured perpendicular to grain direction (X-Z surface). When the MCs were measured along to the glue line on the X-Y surface or perpendicular to the glue line by changing the setting of density from WG1 to WG4 at 20 °C, the MC of G-L-120-E was increased from 9.3 % to 12.6 % measured parallel to glue line and from 9.3 % to 12.8 % measured perpendicular to glue line.
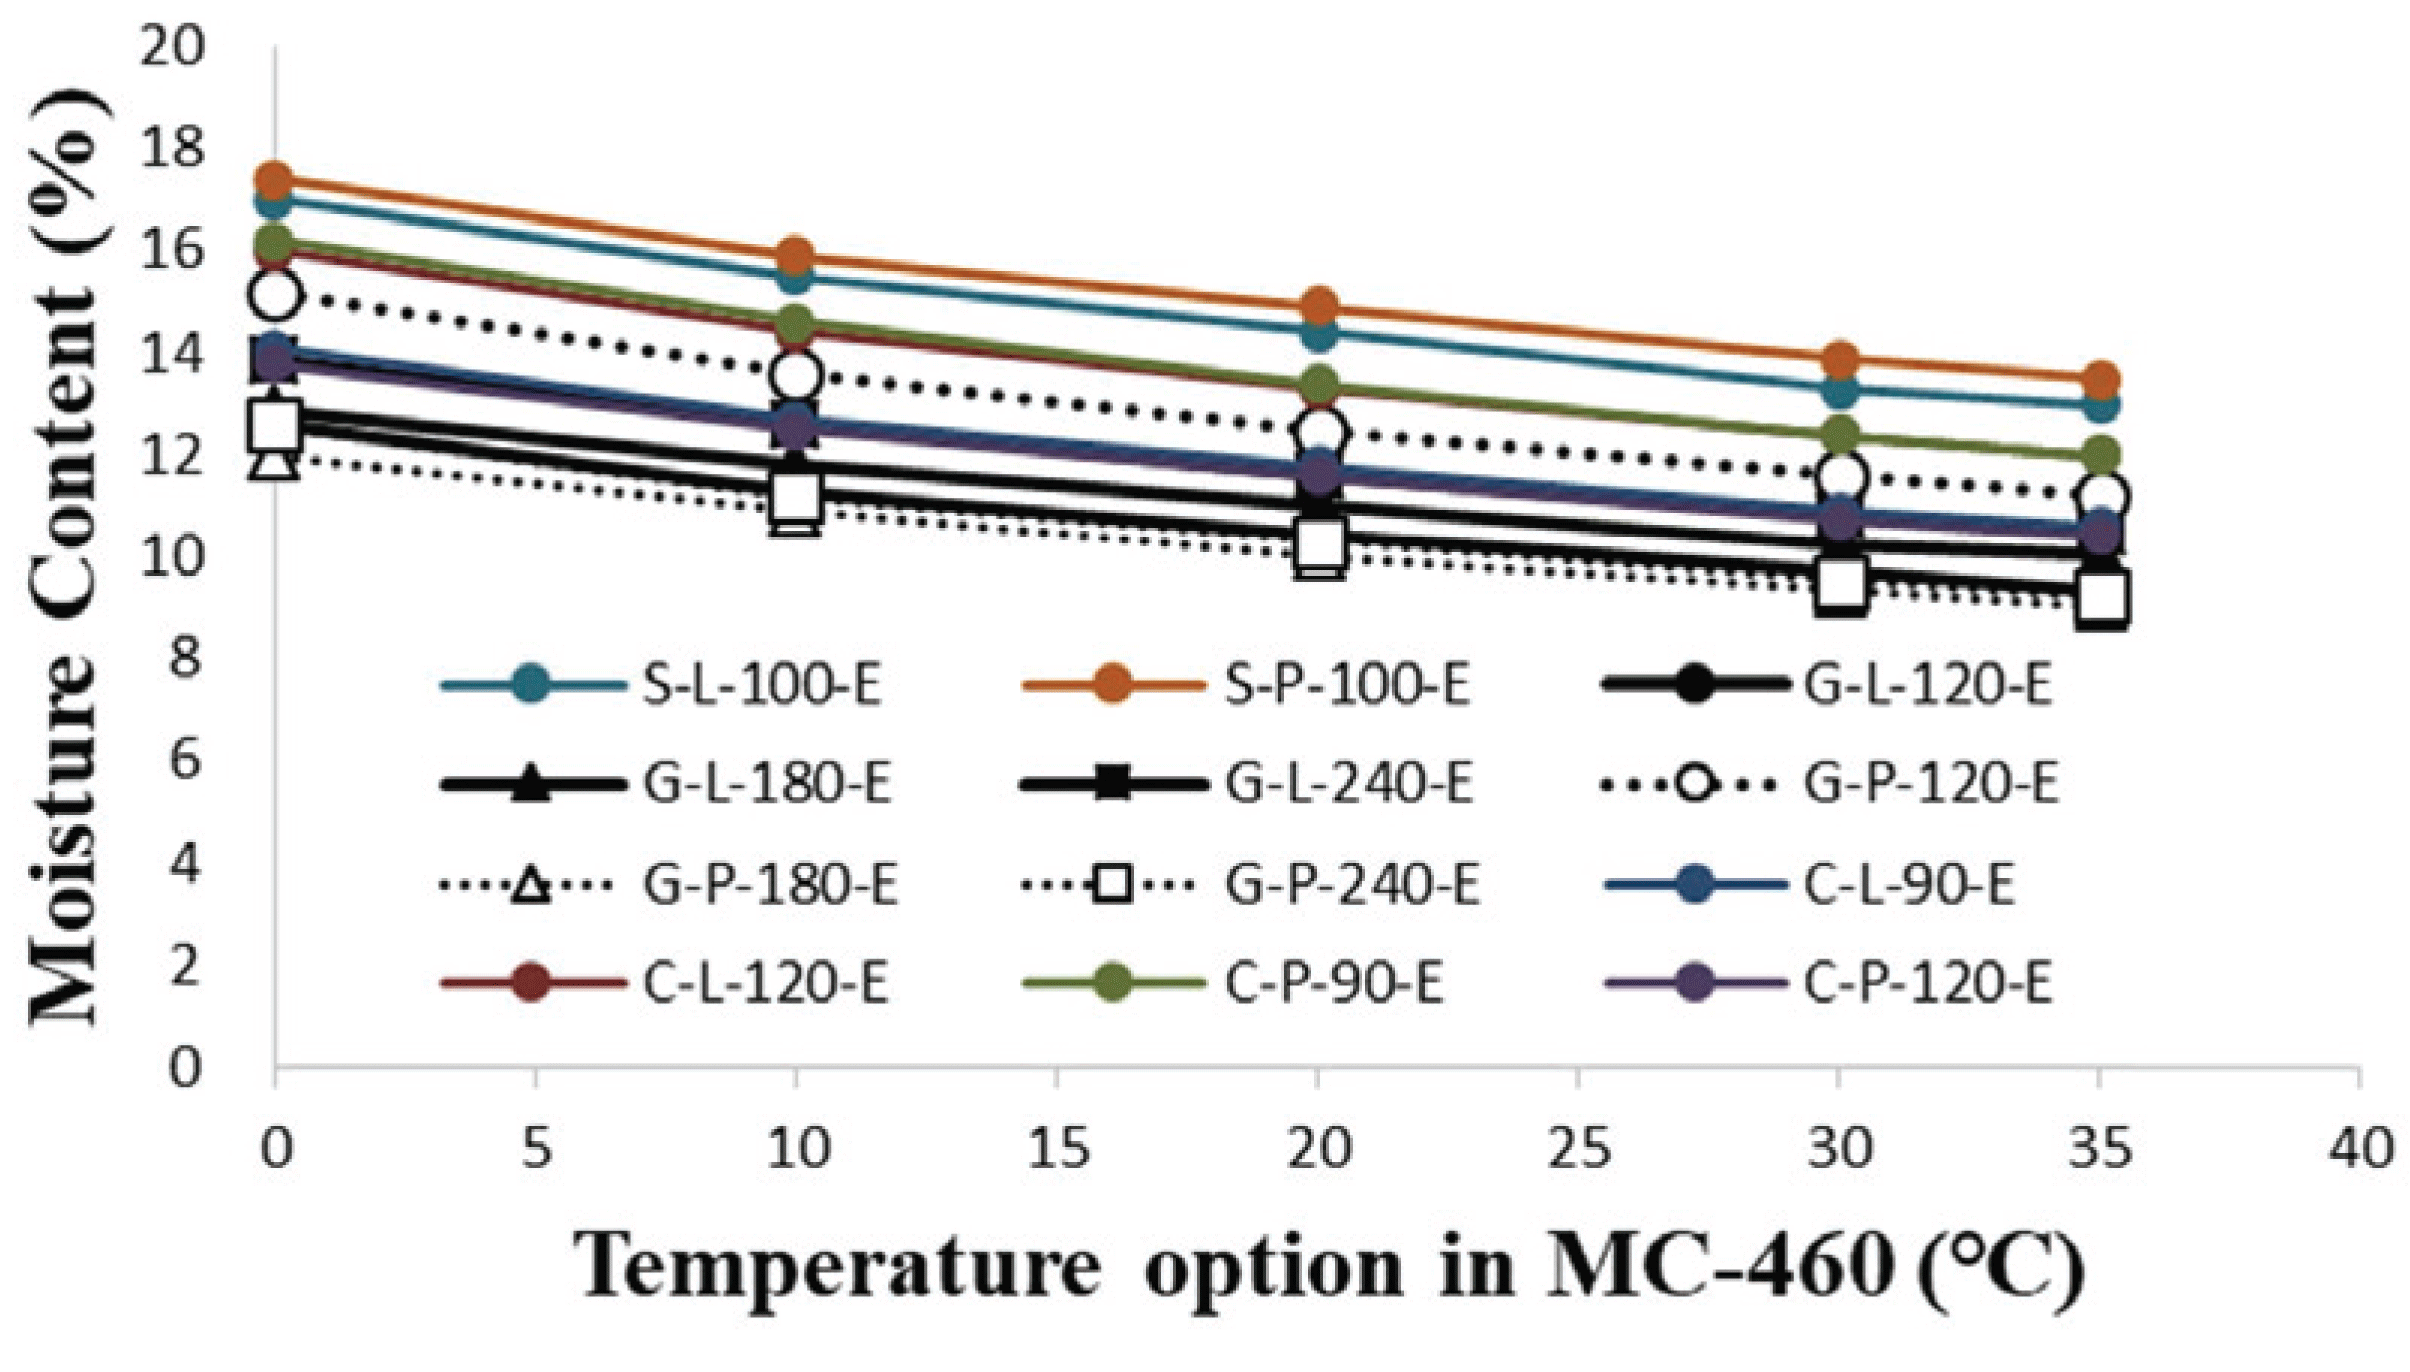
Fig. 7 shows that the effect of temperature option in MC-460. The measured MCs were decreased as the temperature setting value was increased. All of the MC were measured at perpendicular to the grain direction. In case of S-L-100-E and S-P-100-E species, when the temperature setting was changed from 0 to 35 °C, the measured MC decreased from 17.0 % to 13.0 % and from 17.4 to 13.5 %, respectively. In case of larch and pine glulam, when the temperature setting was changed from 0 to 35 °C, the measured MC decreased from 13.9 % to 10.5 % and from 12.6 to 9.2 %, respectively. In case of larch and pine CLT, when the temperature setting was changed from 0 to 35 °C, the measured MC decreased from 16.0 % to 12.0 % and from 13.8 to 10.4 %, respectively. When the temperature setting was changed from 0 to 35 °C, the differences of measured MC occurred approximately 3 ~ 4 %.
At the same setting condition (WG3, 20 °C), the measured MC for larch and pine species was not much different at the same grain direction. The MC of larch glulam (G-L-120-E) parallel to grain direction was 11.3 % and the MC of pine glulam (G-P-120-E) at the same grain direction was 11.7 %. The MC of larch CLT (C-L-90-E) parallel to grain direction was 11.6 % and the MC of pine CLT (C-P-90-E) at parallel to grain direction was also 11.6 %.
The measured MCs using the resistance type meter was dependent on temperature but not dependent on grain direction.
The difference between inside MC and outside MC could be larger in the big size wood. This implies that the size of the wood may affect the MC measured by meters.
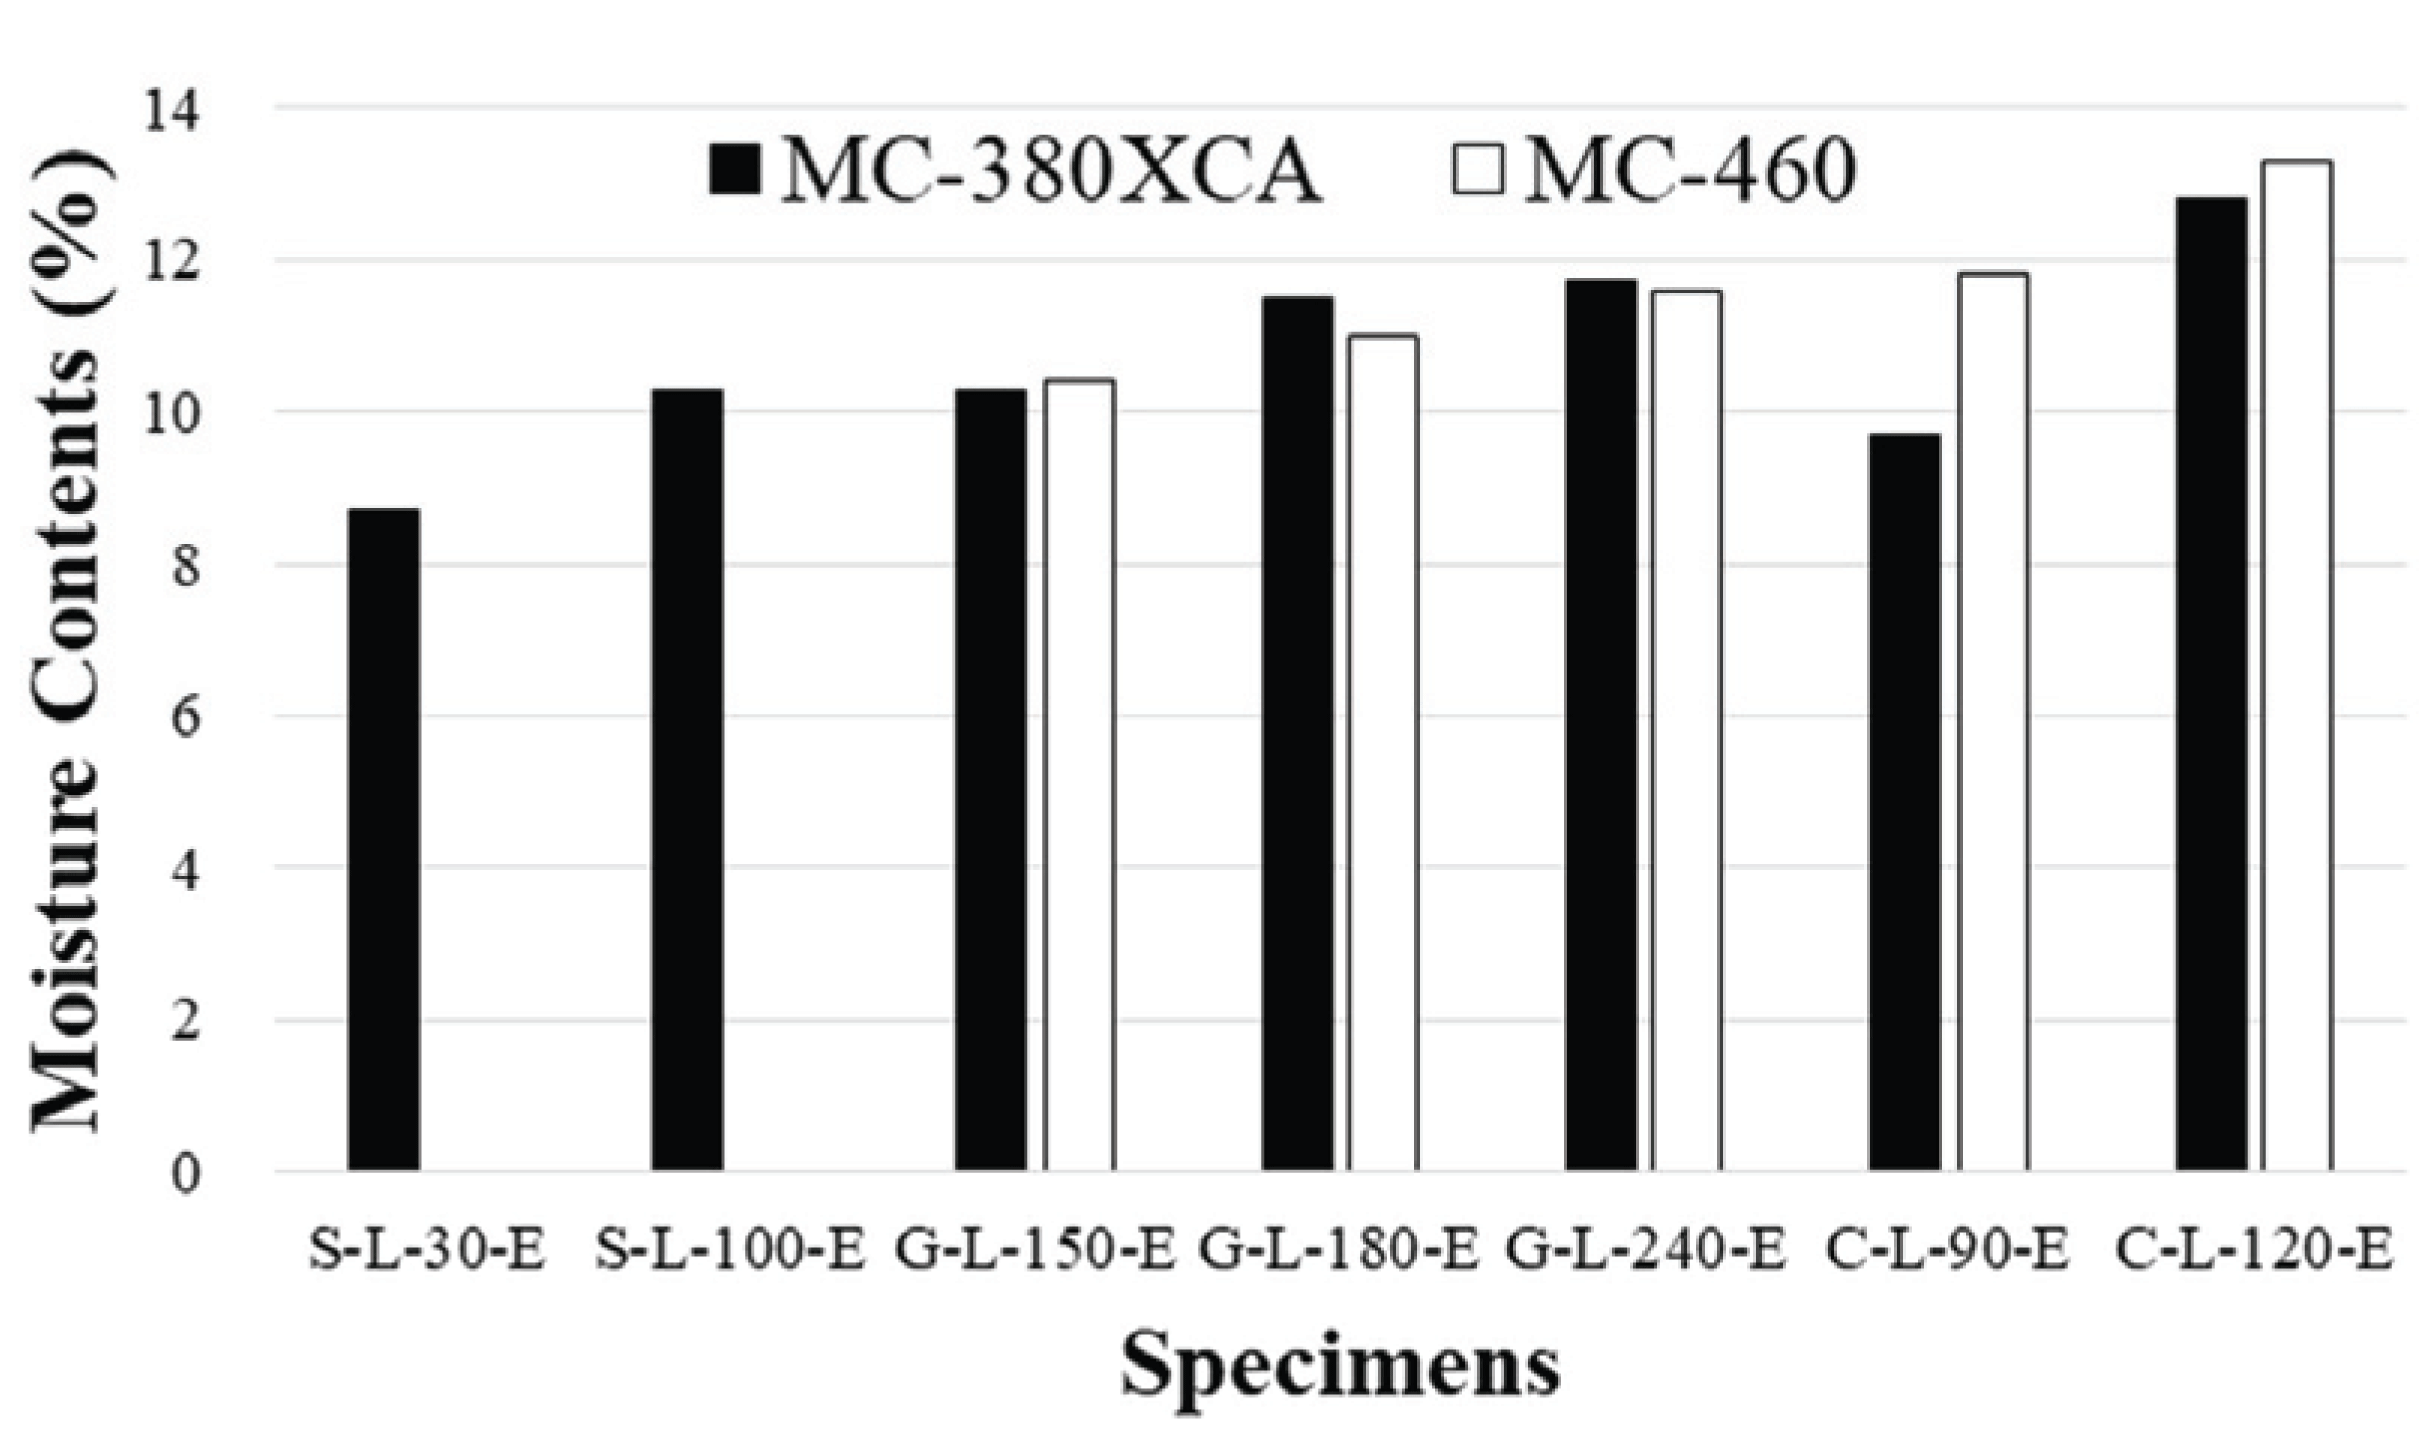
To analyze the feasibility of the detectable depth for moisture content measurement using meters, different sizes of specimens were tested. Fig. 8 shows that the MCs measured by dielectric type (MC-380XCA) after conditioning to EMC of 12 % were affected by the specimen sizes. The measured MCs of larger specimens (S-L-100-E_11.3 %, G-L-240-E_11.7 % and C-L-120-E _12.8 %) were higher than those of small size specimens (S-L-30-E_8.7 %, G-L-150-E_10.3 %, and C-L-90-E_9.7 %). In case of resistance type meter (MC-460), the measured MCs of larger specimens (G-L-240-E_11.6 % and C-L-120-E_13.3 %) were also higher than those of small size specimens (G-L-150- E_10.4 %, and C-L-90-E_11.8 %). The difference of MC depending on the specimen size was consistent with the results of Fredriksson et al. (2015). They theoretically calculated the electric potential differences depending on size of specimen, and explained that as the specimen volume becomes smaller, the electrical resistance becomes larger. Therefore, when the MC was measured on a small specimen, a low MC was obtained.
To evaluate the detectable penetration depth of dielectric type meter, four combinations were composed using S-L-30-E (12 % EMC) and S-L-30-S (saturated) specimens (Fig. 4). Four combinations were reflected the grain directions (radial and tangential) and MCs of contacted surface (12 % EMC and saturated MC). MC meter does not reflect the MC at depths of 30 mm or more regardless of the grain direction. The measured MC was determined from the MC of the contacted area less than 30 mm detectable depth. These results indicate that the dielectric type meter measured the MC near the contacted surface only. Therefore, it would be better to use a resistance type meter together to measure the internal MC of a wood member. Fig. 9.
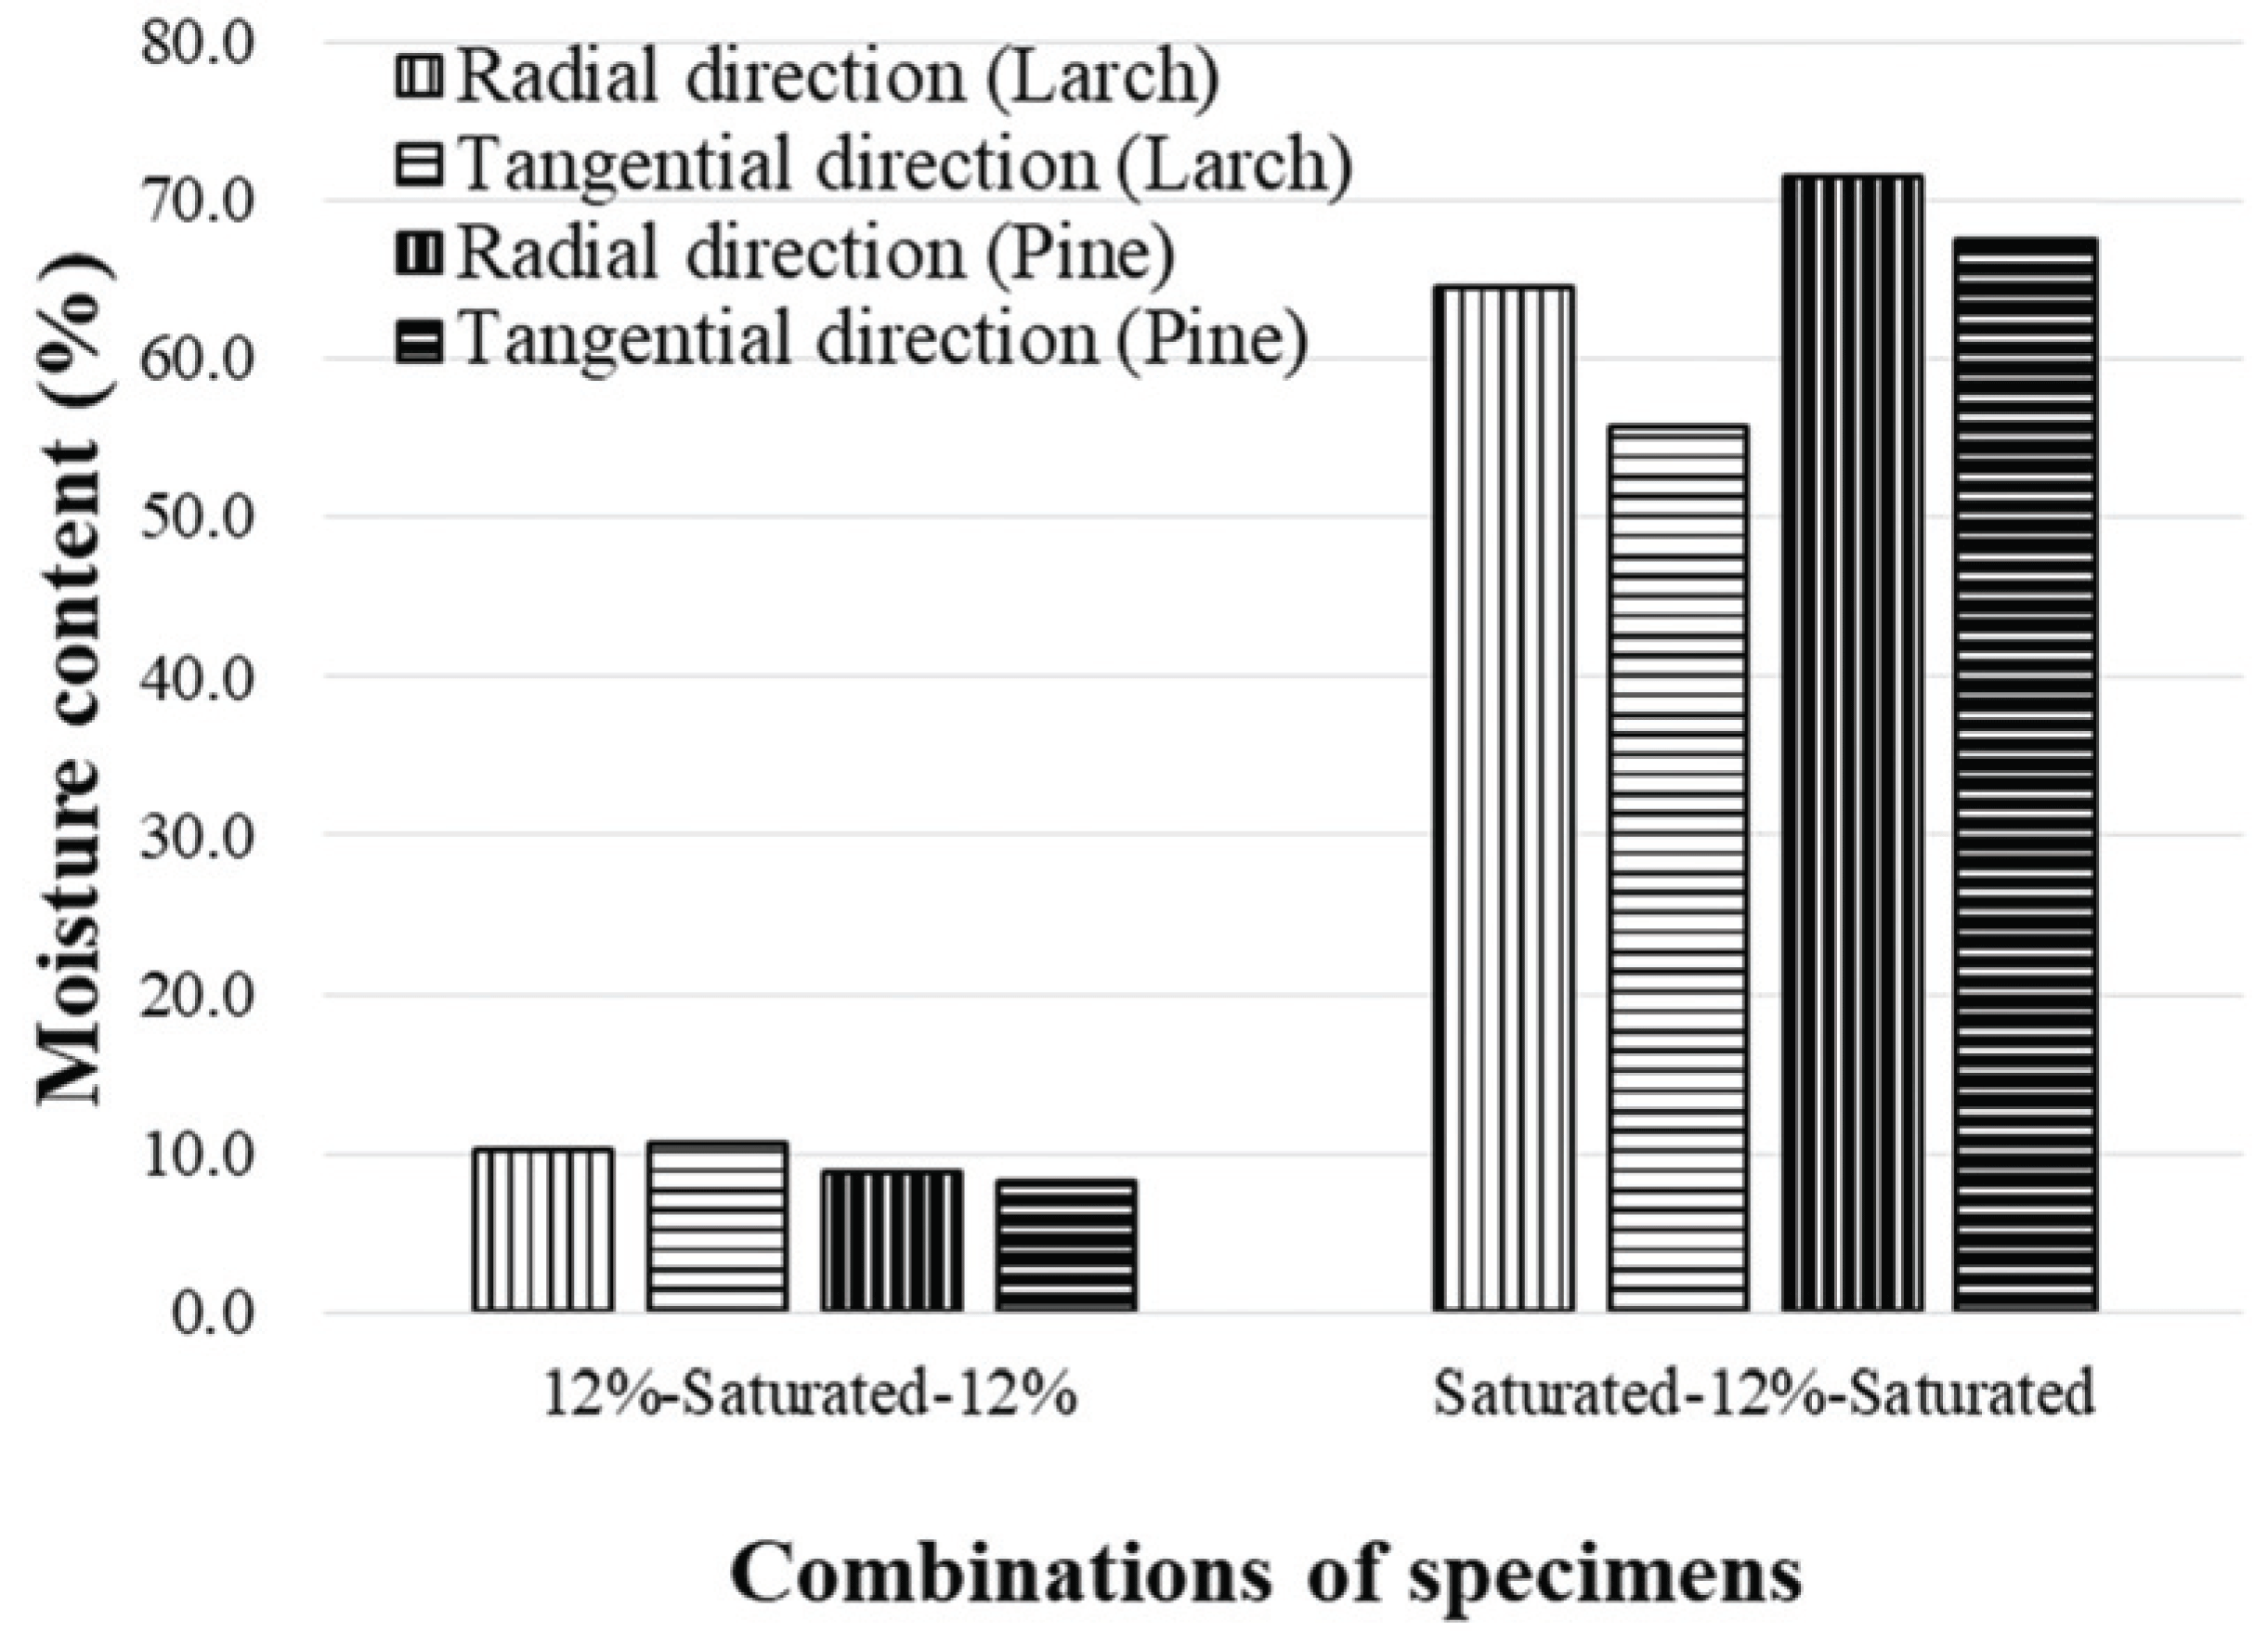
Fig. 10 shows that the sensitivity of commercial MC meters according to the MC changes of specimens which measured by the oven-dried method. The change of MC of specimen was measured by MC-460 more sensitive than dielectric type meters (MC-160 SA, MC-380 XCA). It should be noticed that the MC measured by the MC meters was closer to the target EMC of environmental chamber than the MC measured by oven-dried method. Although the hygroscopicity of the oven-dried specimens may have been decreased (Kang et al., 2018), the differences between MCs measured by oven-dry method and MC meter were more clearly appeared. In oven-dry method, the measured MC shows the averages MC of the specimens, because the MC of specimen was calculated by the weight difference of the specimen. On the other hand, for commercial MC meters, the MC was measured from the detectable depth of specimens.
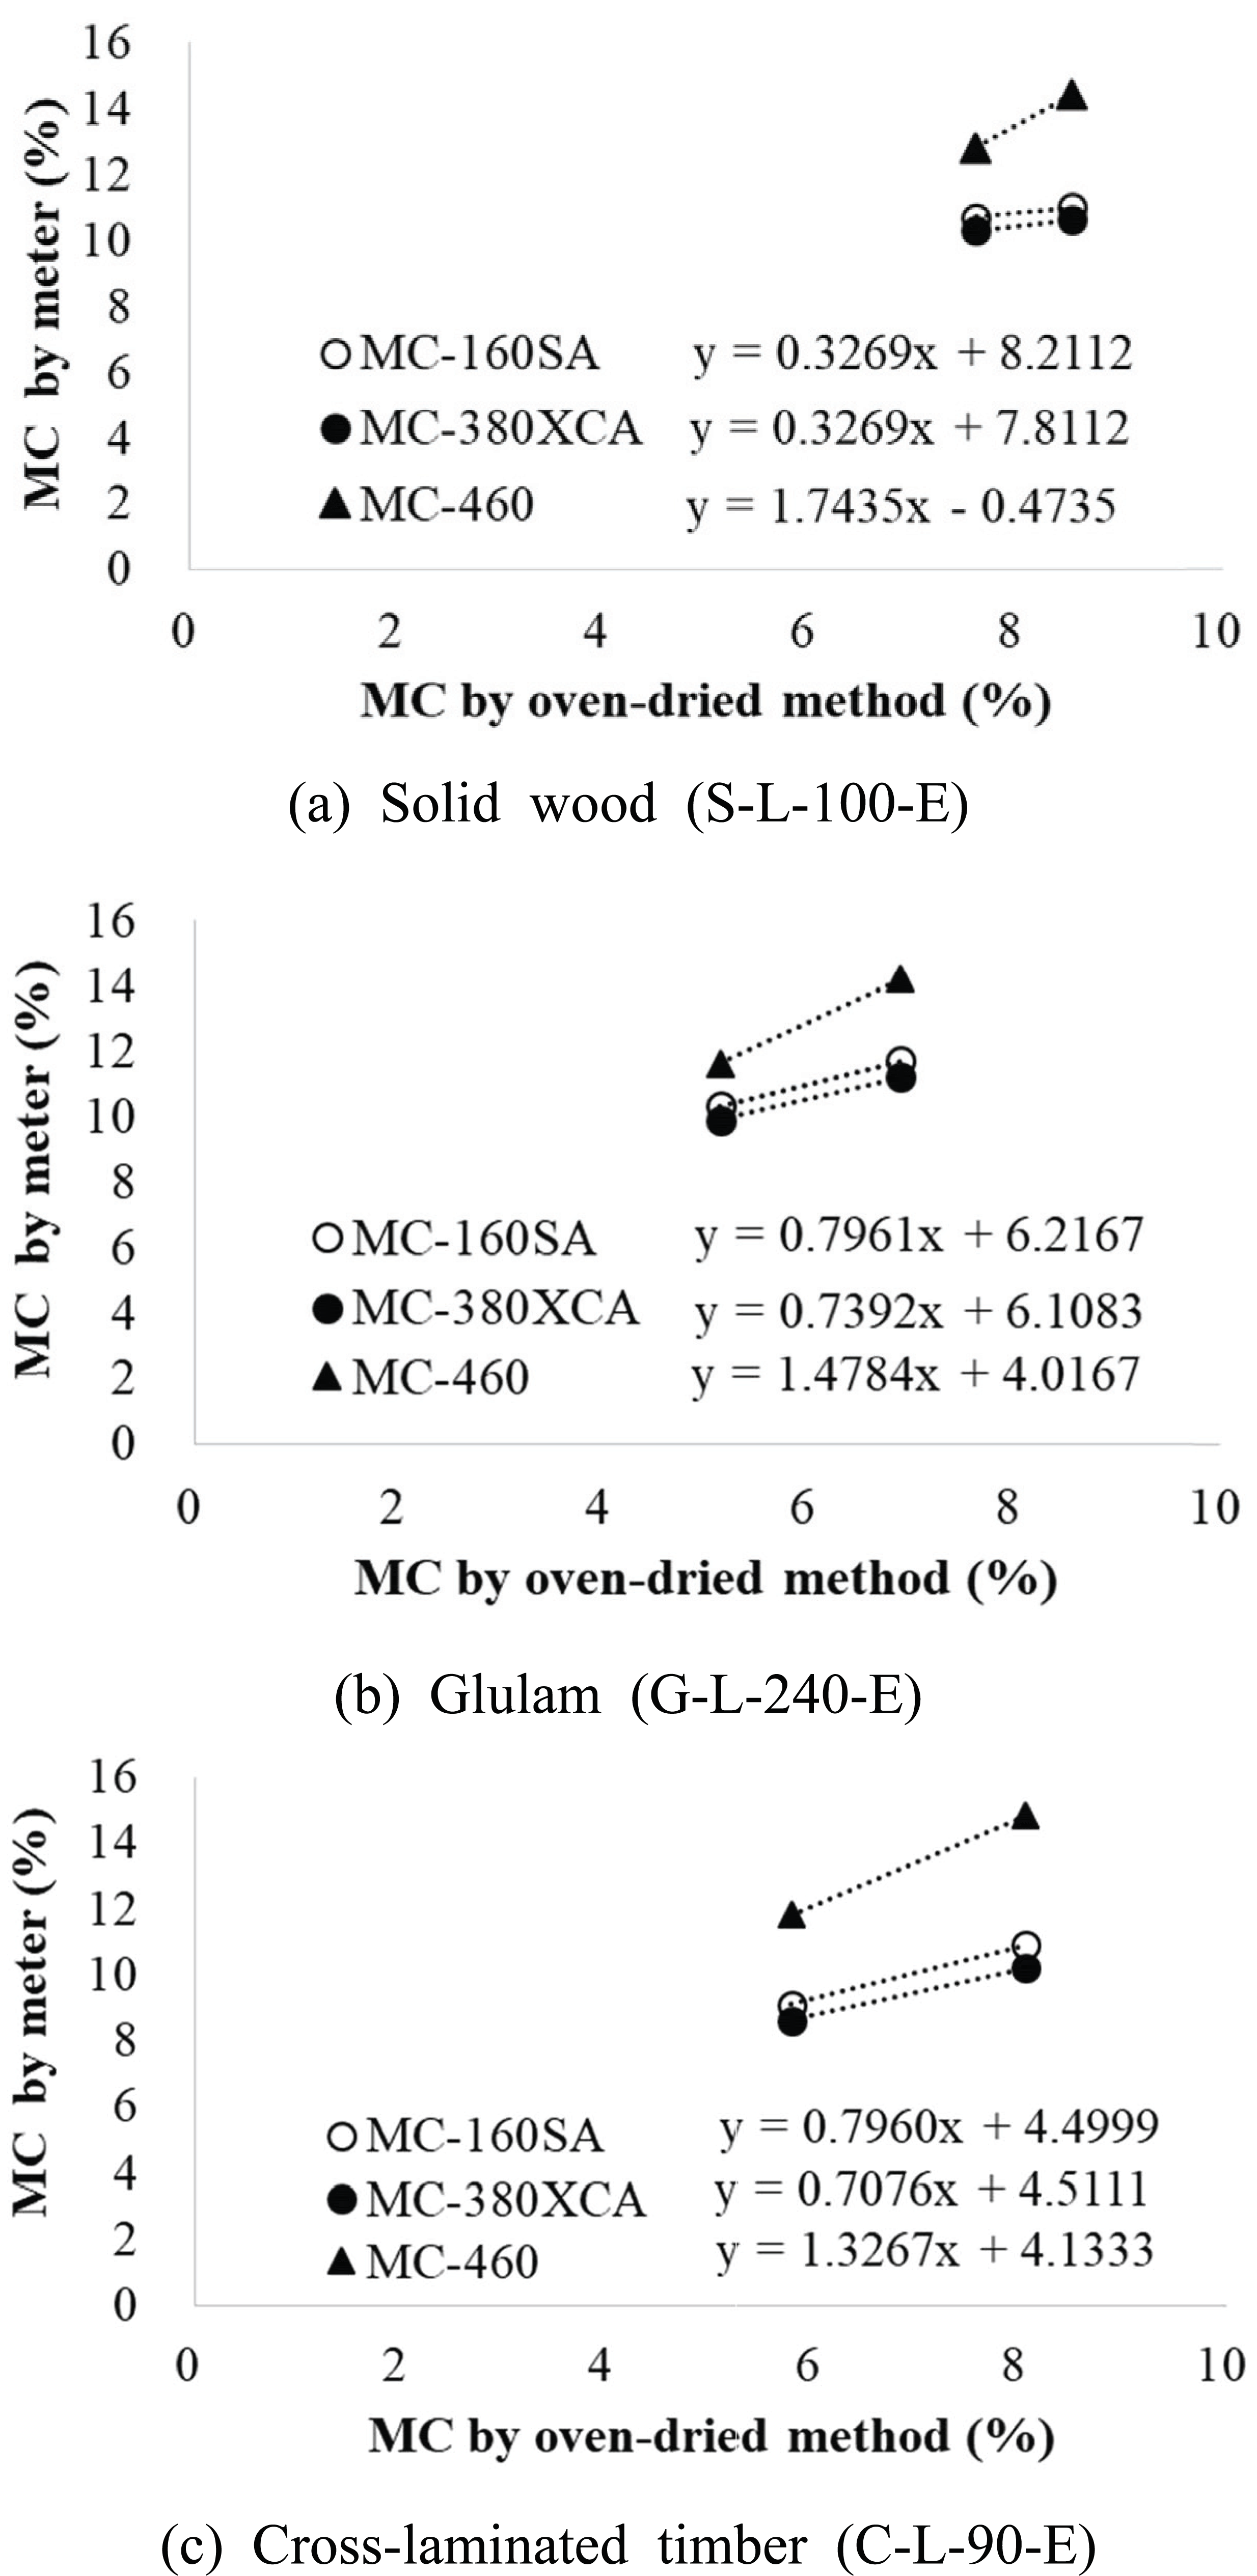
In timber structure, the surface MC of a wood member exposed to the ambient air is changed based on the local climate. A large timber member has different MC in outer and inner sides of the cross section (Niemz and Mannes, 2012; Lee et al., 2016a). Thus, it is difficult to assume that the MC measured by the oven-dry method represents real situation of the timber member. This test result shows that the commercial MC meters also have a limitation which only provides the outside MC of timber member. However, in terms of providing accurate MC information of timber member, the outside MC is important, because it shows the status of timber member influenced by the local climate changes.
4. CONCLUSION
The effects of density, temperature, size, grain direction on measurement of MC of wood materials nondestructively were investigated. The sensitivities of dielectric type meter and resistance type meter were also investigated.
In case of dielectric type meter, the MCs of wood (S-L-100-E) were decreased from 13.4 % to 11.3 % when the density setting was increased from 400 kg/m3 to 600 kg/m3. The measured MCs of larger specimens (S-L-100-E_11.3 %, G-L-240-E_11.7 % and C-L-120- E_12.8 %) were higher than those of small size specimens (S-L-30-E_8.7 %, G-L-150-E_10.3 %, and C-L-90-E_9.7 %). The measured MC at the parallel to grain direction (12.1 %) was higher than that measured at the perpendicular to grain direction (10.7 %).
In case of resistance type meter, when the wood group (WG) was changed from WG1 to WG4, the MCs were increased 9.2 % to 12.3 %. When the temperature setting was changed from 0 to 35 °C, the MC was decreased from 17.0 % to 13.0 %. At the same setting condition (WG3, 20 °C), the measured MC for larch species (G-L-120-E_11.3 %) and pine species (G-P-120-E_11.7 %) was not much different parallel to grain direction. The measured MCs of larger specimens (G-L-240- E_11.6 % and C-L-120-E_13.3 %) were higher than those of small size specimens (G-L-150-E_10.4 %, and C-L-90-E_11.8 %). The measured MCs were not much different depending on the grain direction of the specimen.

