1. INTRODUCTION
Against the background of severe problems related to environmental noise, there has been a significant increase in the demand for controlling such noise. This has led to an increase in the research effort on soundproof and highly sound absorptive building materials (Kang et al., 2012). Among the sources of noise pollution, traffic noise leads to the widest range of damage and causes the most severe damage. Hence, sound barriers are built along roadsides to eliminate or reduce noise. Such sound barriers may be of the acoustic absorber type or the reactive type. Reactive sound barriers cause problems such as drivers being exposed to the reflected sound, although the walls containing using concrete panels, ceramic panels, polycarbonates, etc. provide effective soundproofing by blocking the sound transmission path from the noise source to the listeners. The sound-absorber-type barriers have an aluminum frame and fillings of porous sound-absorbing materials such as glass wool to reduce the noise.
The measurement of the sound transmission loss has been generally measured by the transfer function method and a laboratory measurement method. The transfer function method uses two transfer functions of the sound source part and the sound-receiving part. The transfer function method has the advantage of rapid measurement of sound transmission loss rate over a wide range of frequencies. The laboratory measurement method has the advantage of accurate measurements, but large test spaces and specimens are required for this method (Lee et al., 2011).
From the viewpoint of reuse of by-products, rice-straw particles obtained from rice straw, a by-product of rice cultivation, are commonly used in sound barriers. The use of these particles for building materials is limited by their low strength, but they can be used as a filler for acoustic-absorber-type sound barriers because their apparent density and air flow resistance can be easily controlled. In this study, the sound transmission loss of rice-straw particle mats was measured by (1) the transfer function method by using impedance tubes and (2) a laboratory measurement method to compare the two measuring methods and to evaluate the sound transmission loss of the sound barrier filled with rice-straw particles.
2. MATERIALS and METHODS
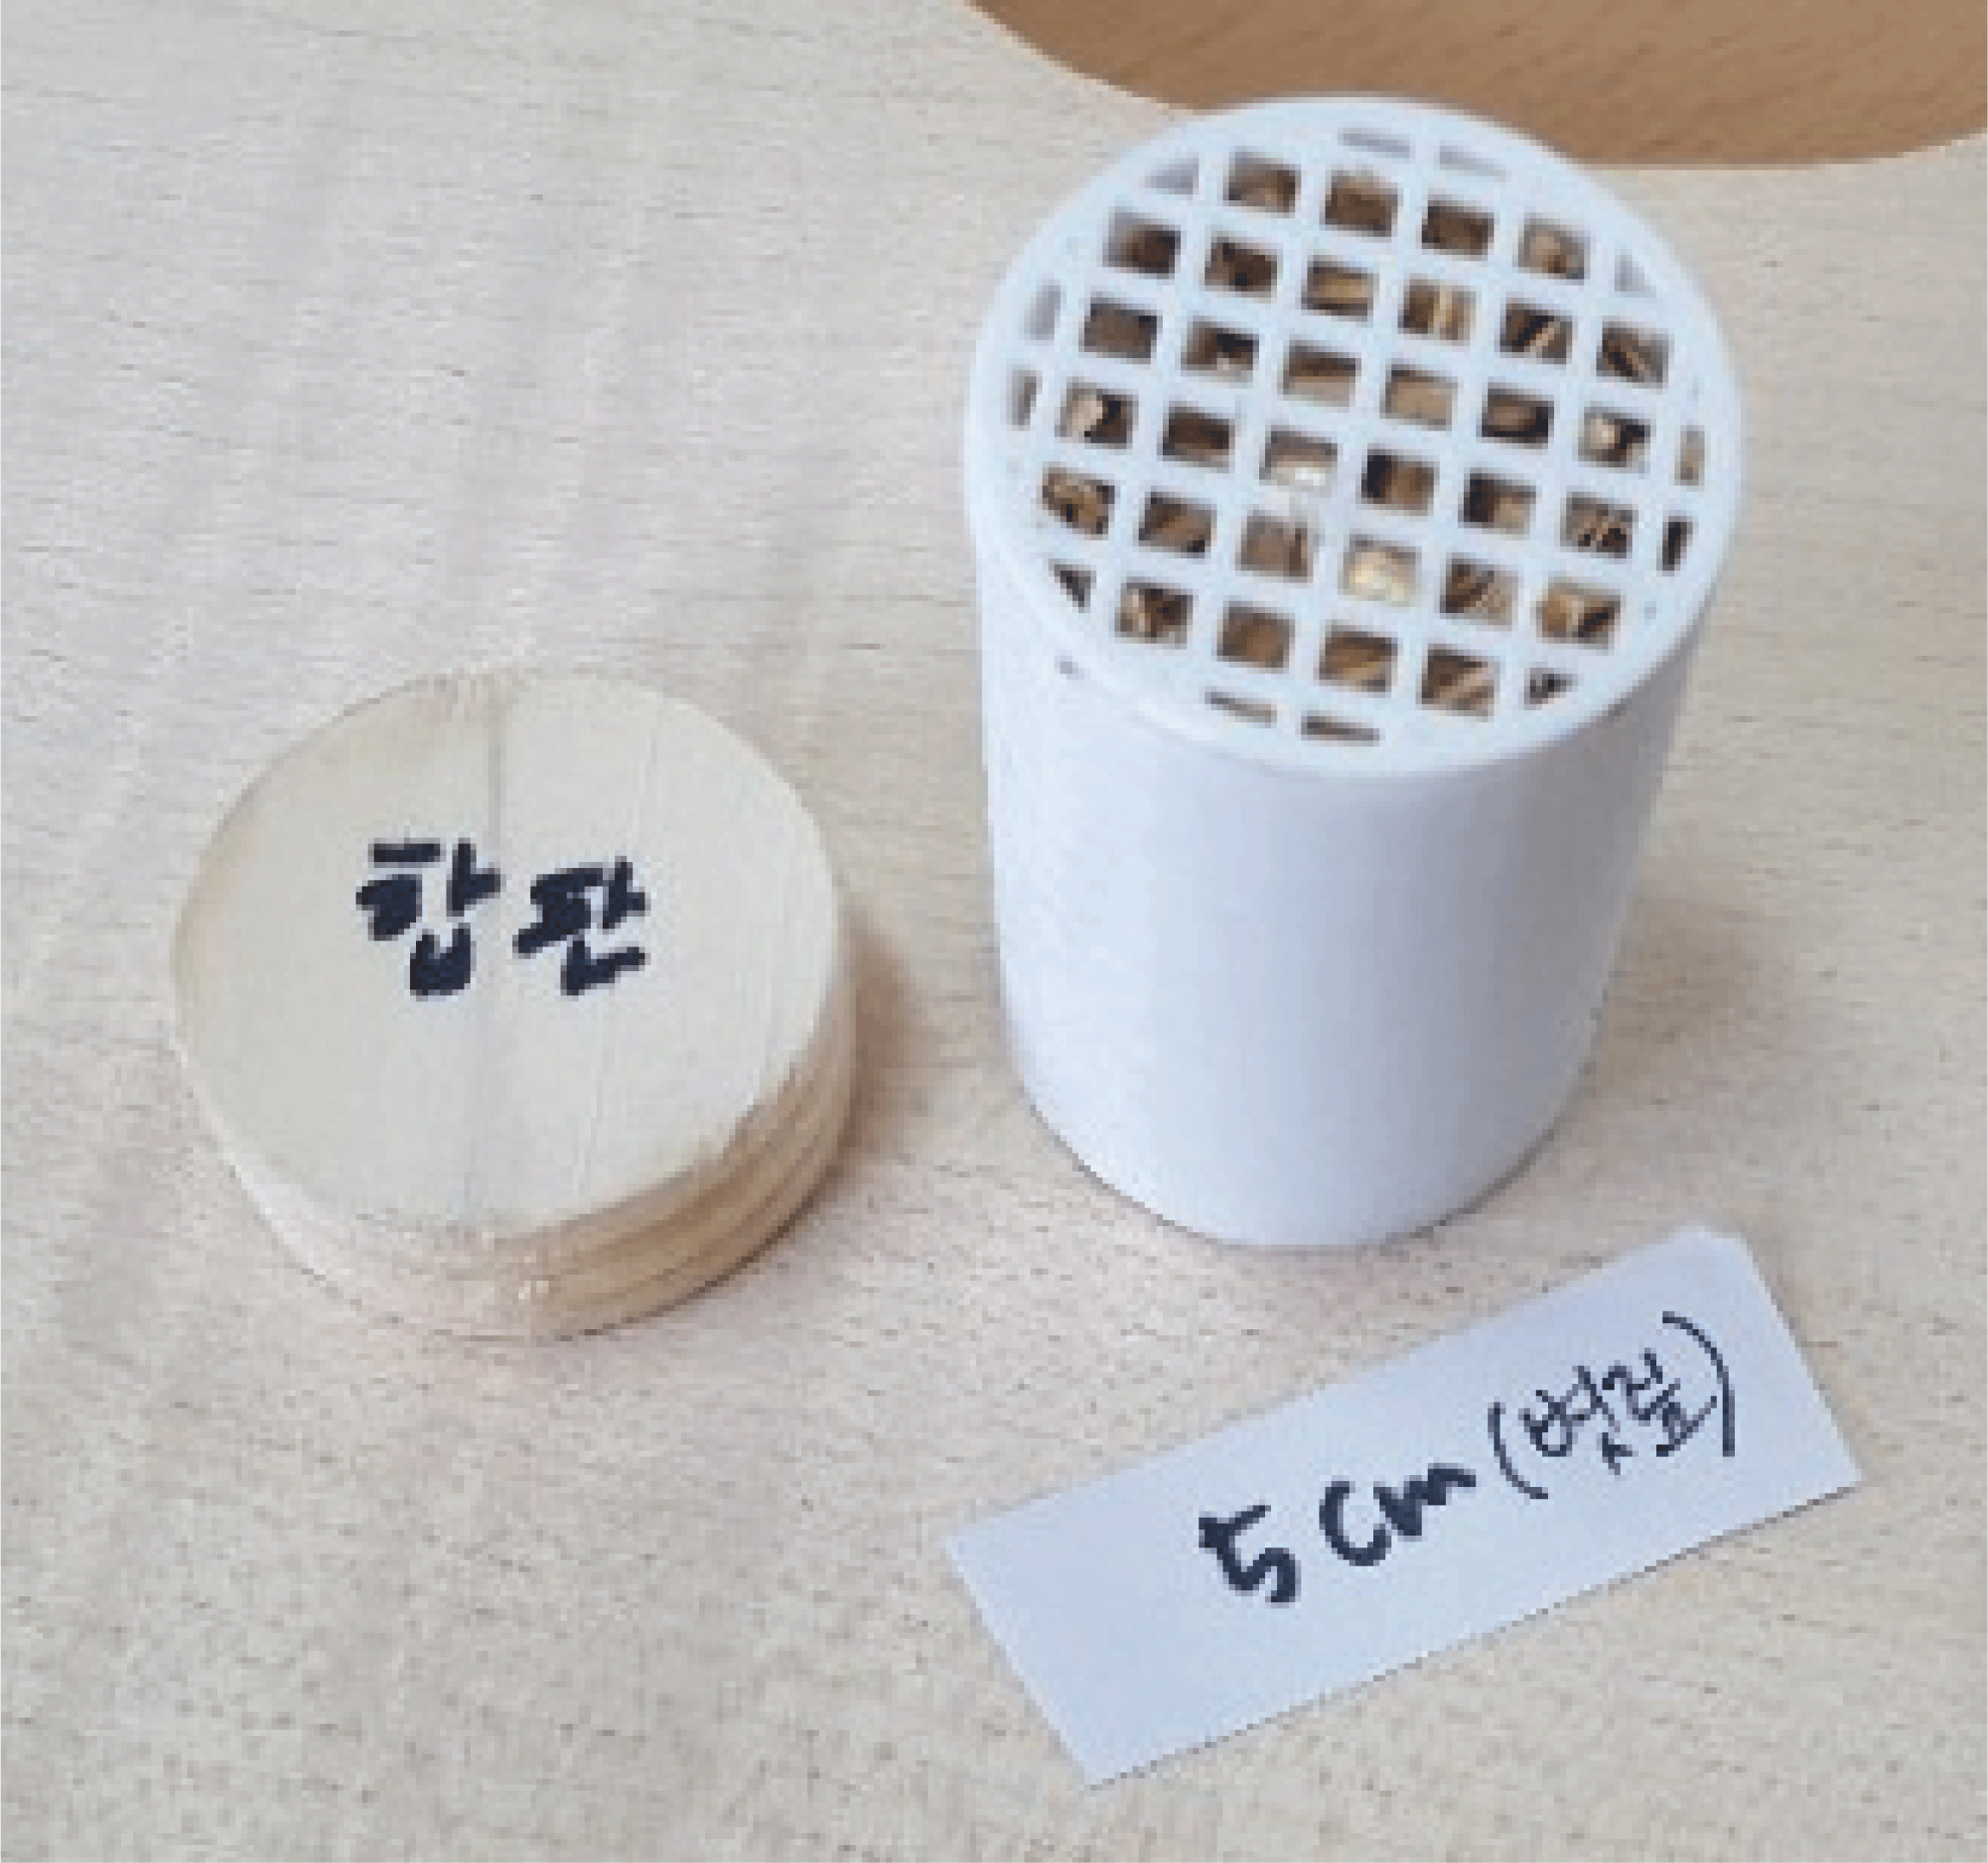
The air-dried rice straws were cut into samples 10-mm long. Impedance tubes were filled with these straws, as shown in Fig. 1. The percentage of moisture content, true density, bulk density, and the porosity of the rice straws were 7.8 %, 0.81 %, 0.33 %, and 59 %, respectively. The apparent specific density of the rice-straw mat on the sample holder was changed by controlling the filling pressure, and the thickness of the rice-straw mats were changed by increasing their thickness. A 10-mm-thick plywood disk was attached to the back face of the rice-straw mat to increase the transmission loss and to reinforce the strength of the mat (Fig. 1). This plywood had weight similar to that of the metal frame used in the sound barrier.
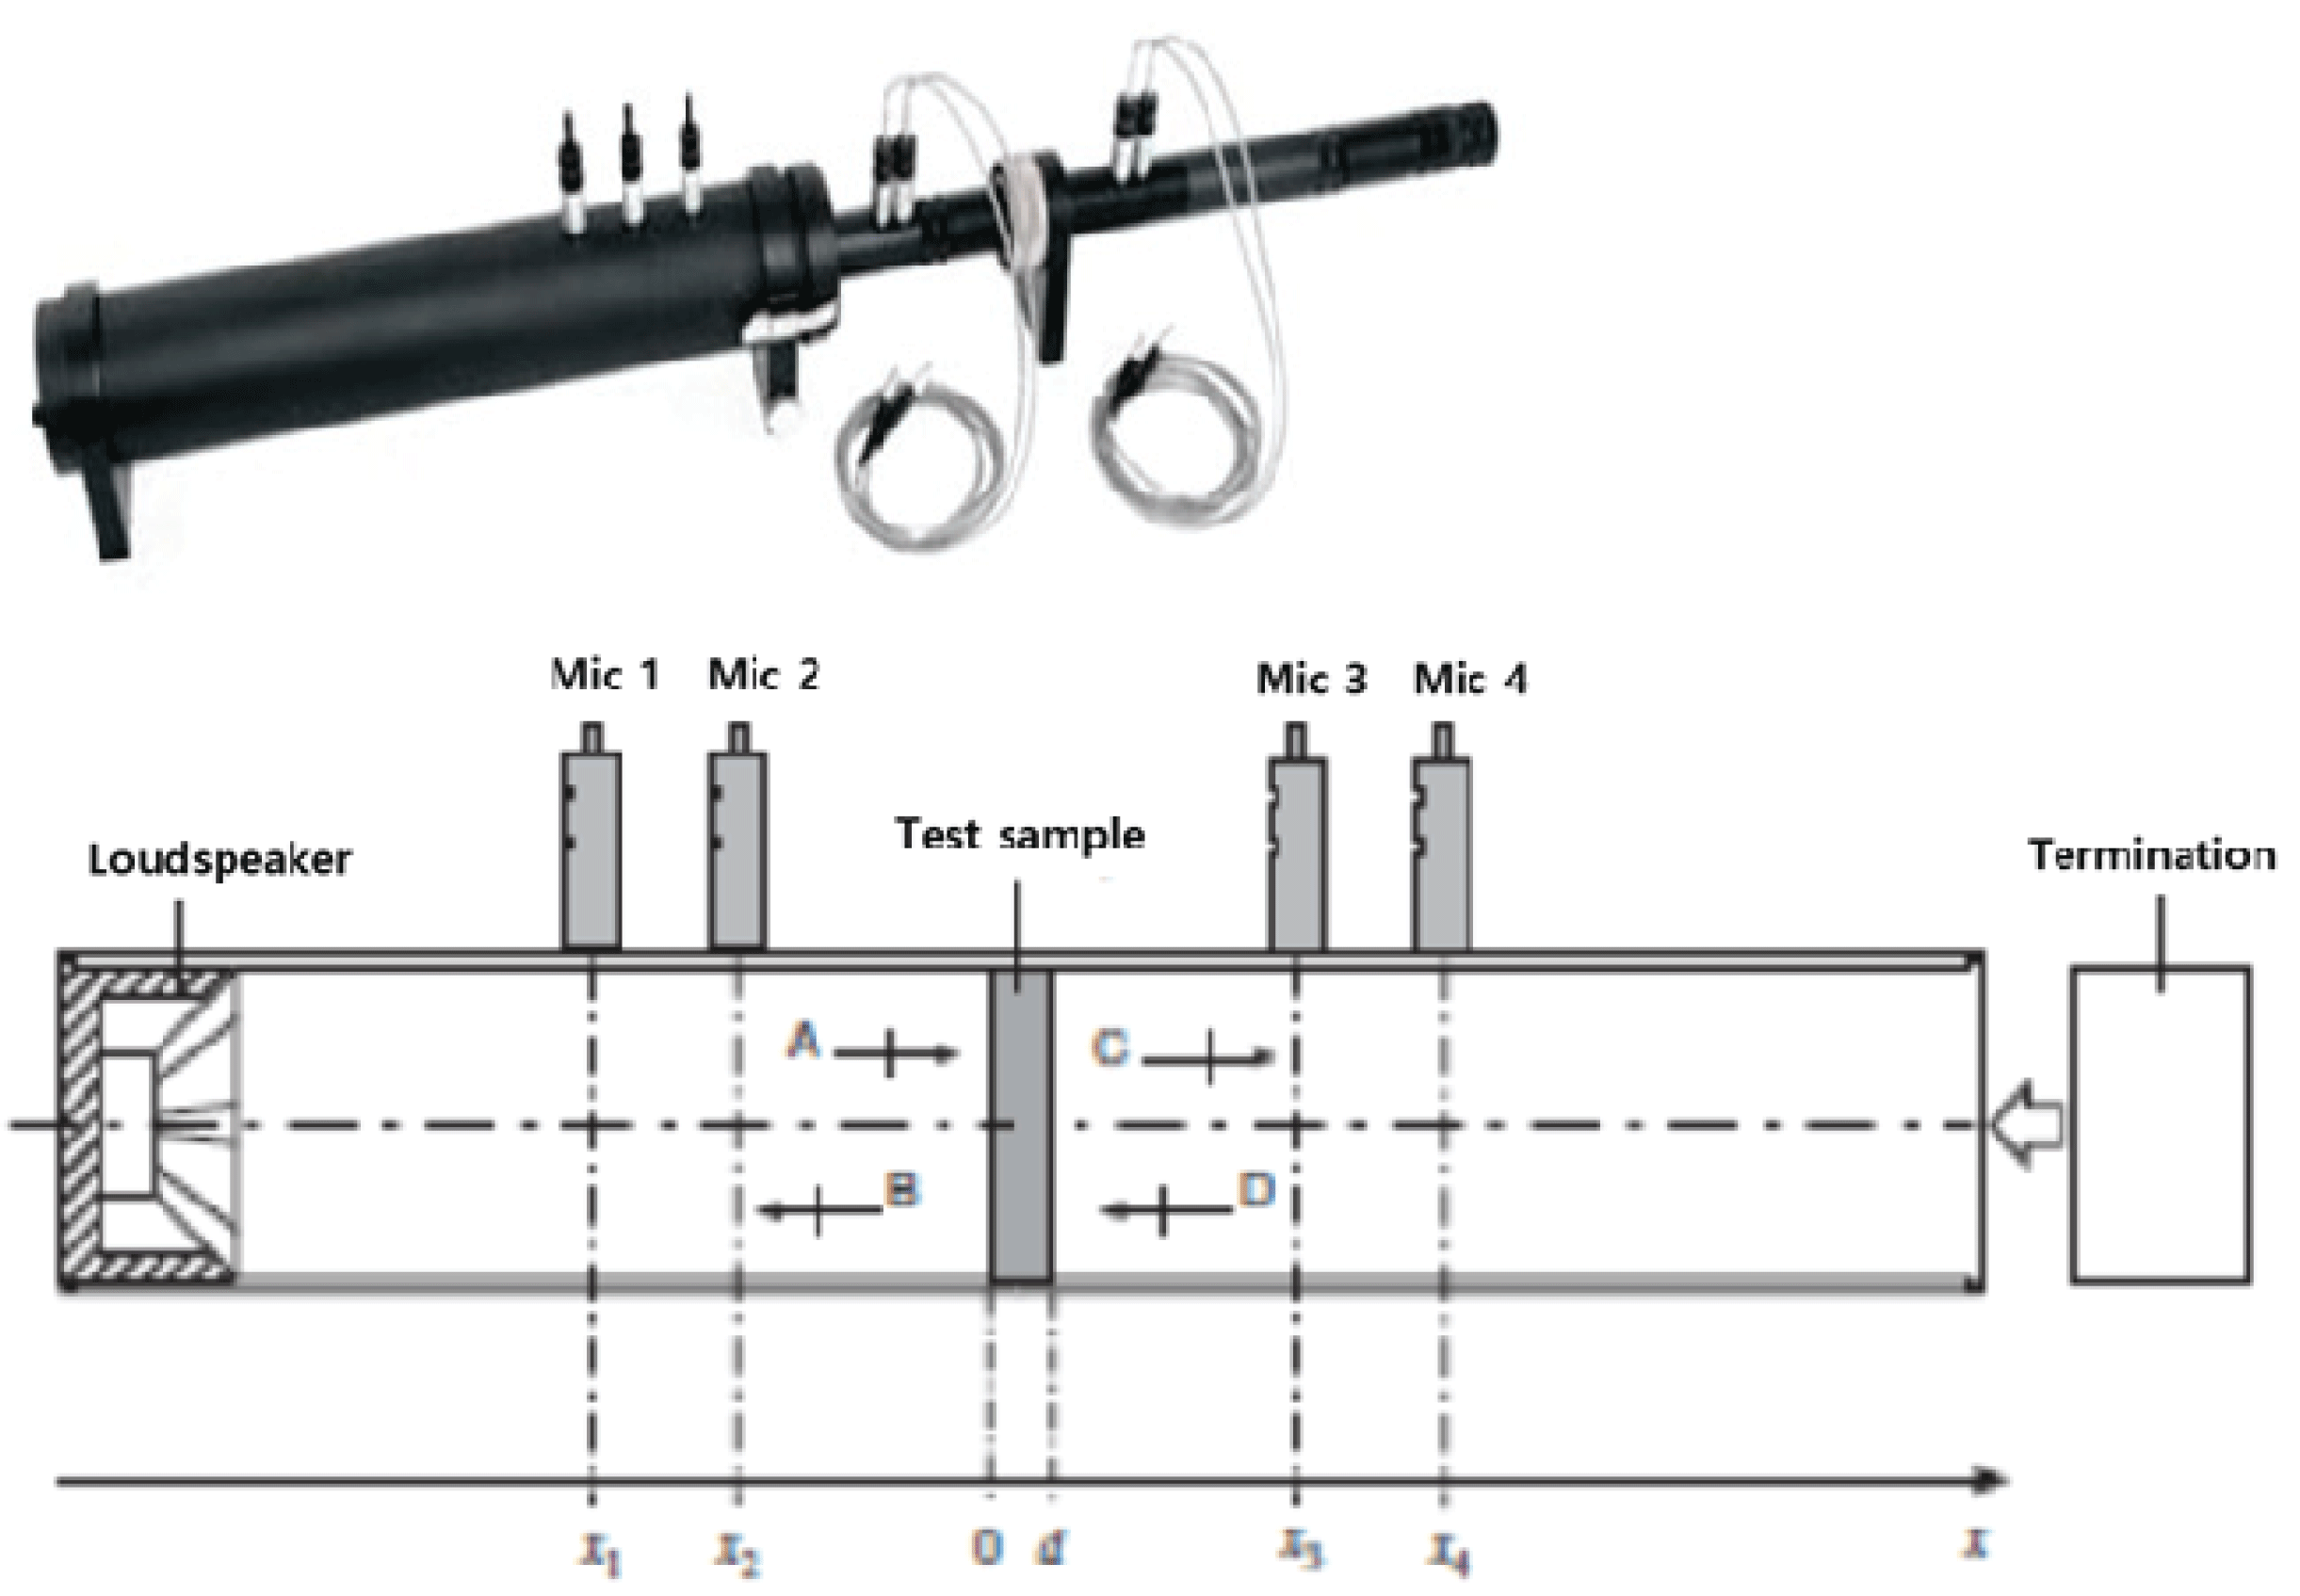
Following ASTM E 2611-09, a specimen was placed at the center of the impedance tube, as shown in Fig. 2. In the transfer function method, an impedance tube with a sound source part and sound-receiving part was used. The sample holder was inserted between the two parts, as shown in Fig. 2. Four microphones were installed-two microphones on each side of the impedance tube. The sound transmission loss ratio was calculated from the transfer functions obtained from each of the microphones. The diameter of the impedance tube was 29 mm; the frequency band used during the measurement was 500-6400 Hz. The temperature and atmospheric pressure were 23°C and 1013.5 hPa, respectively.
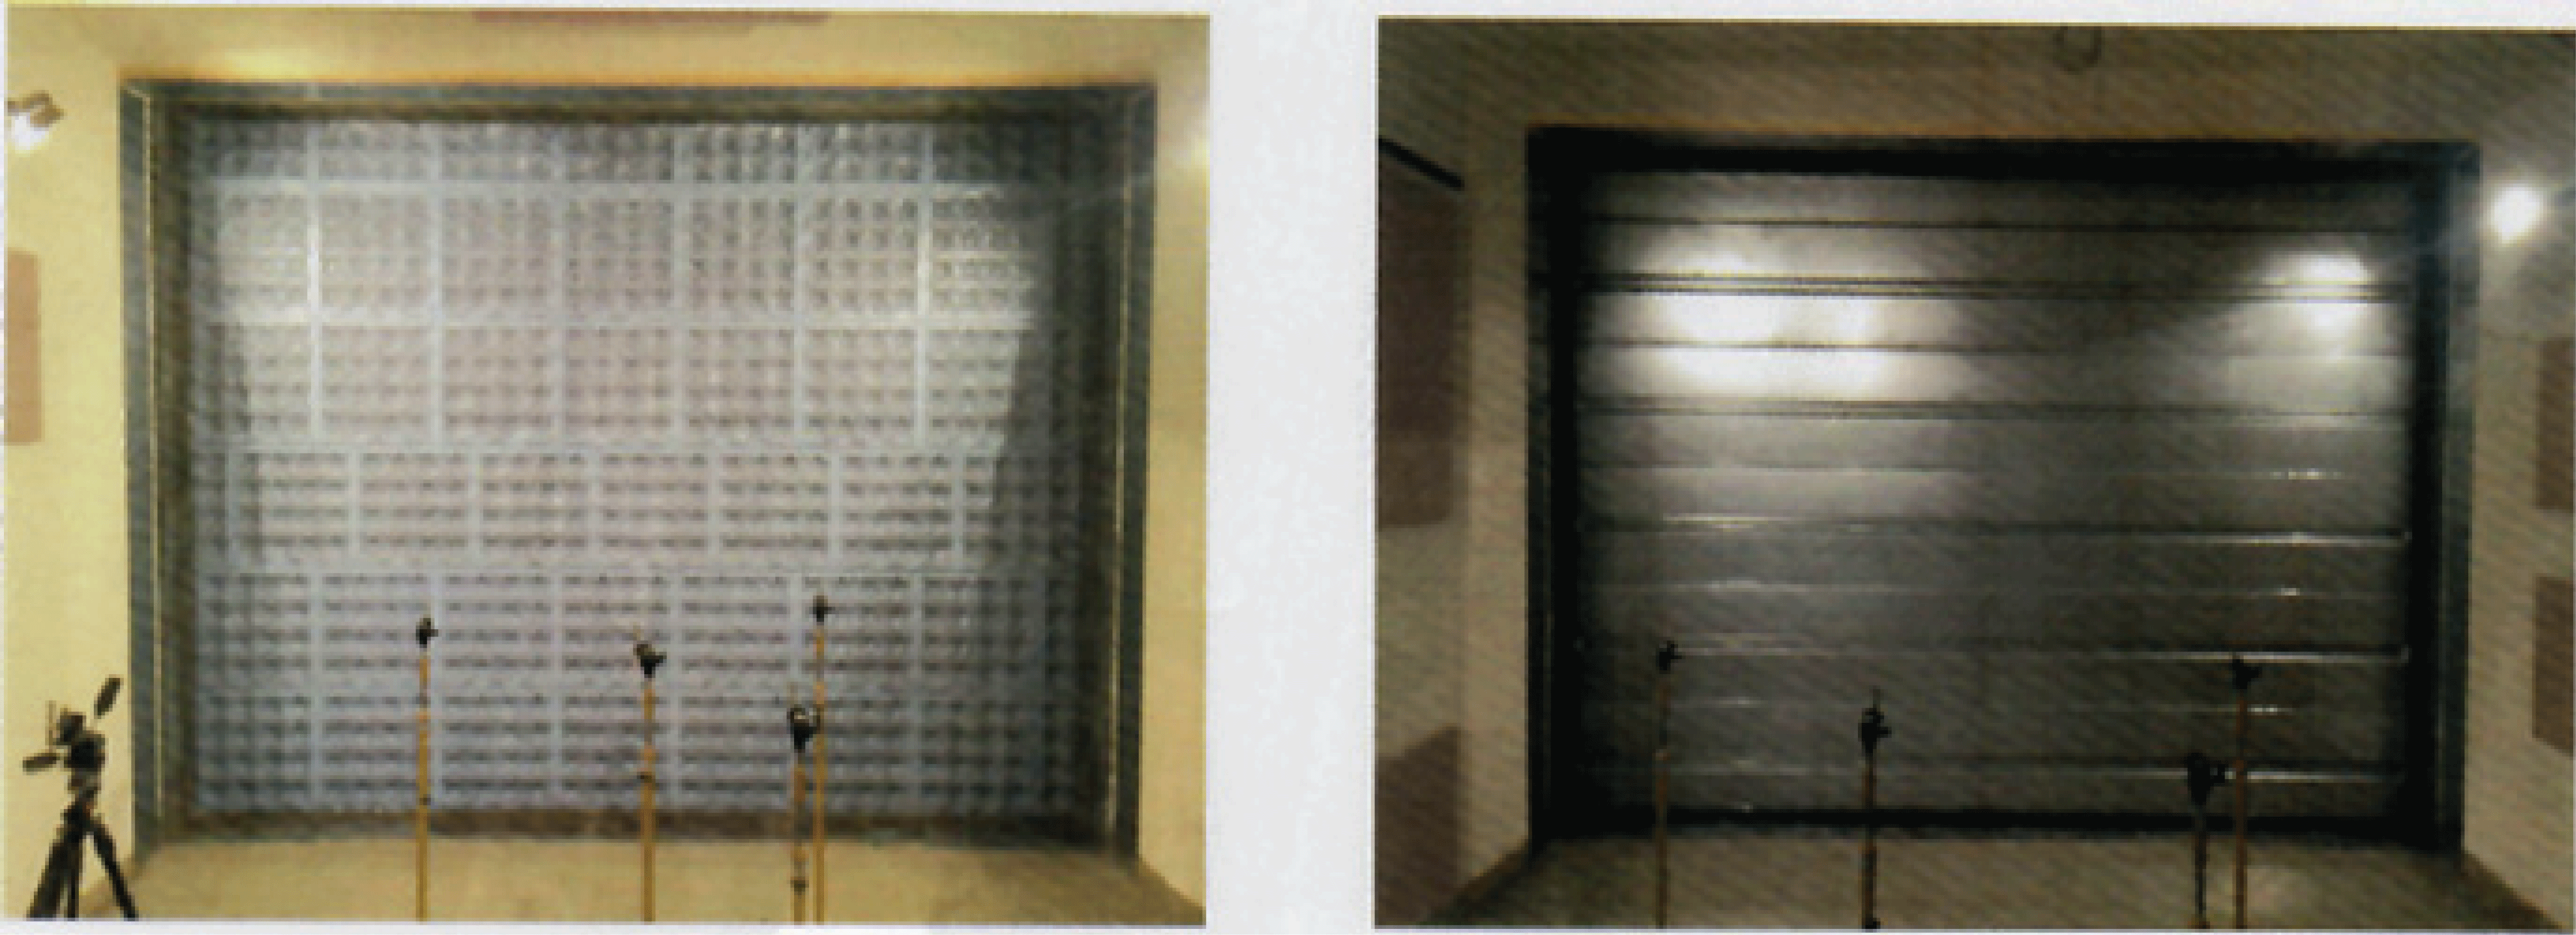
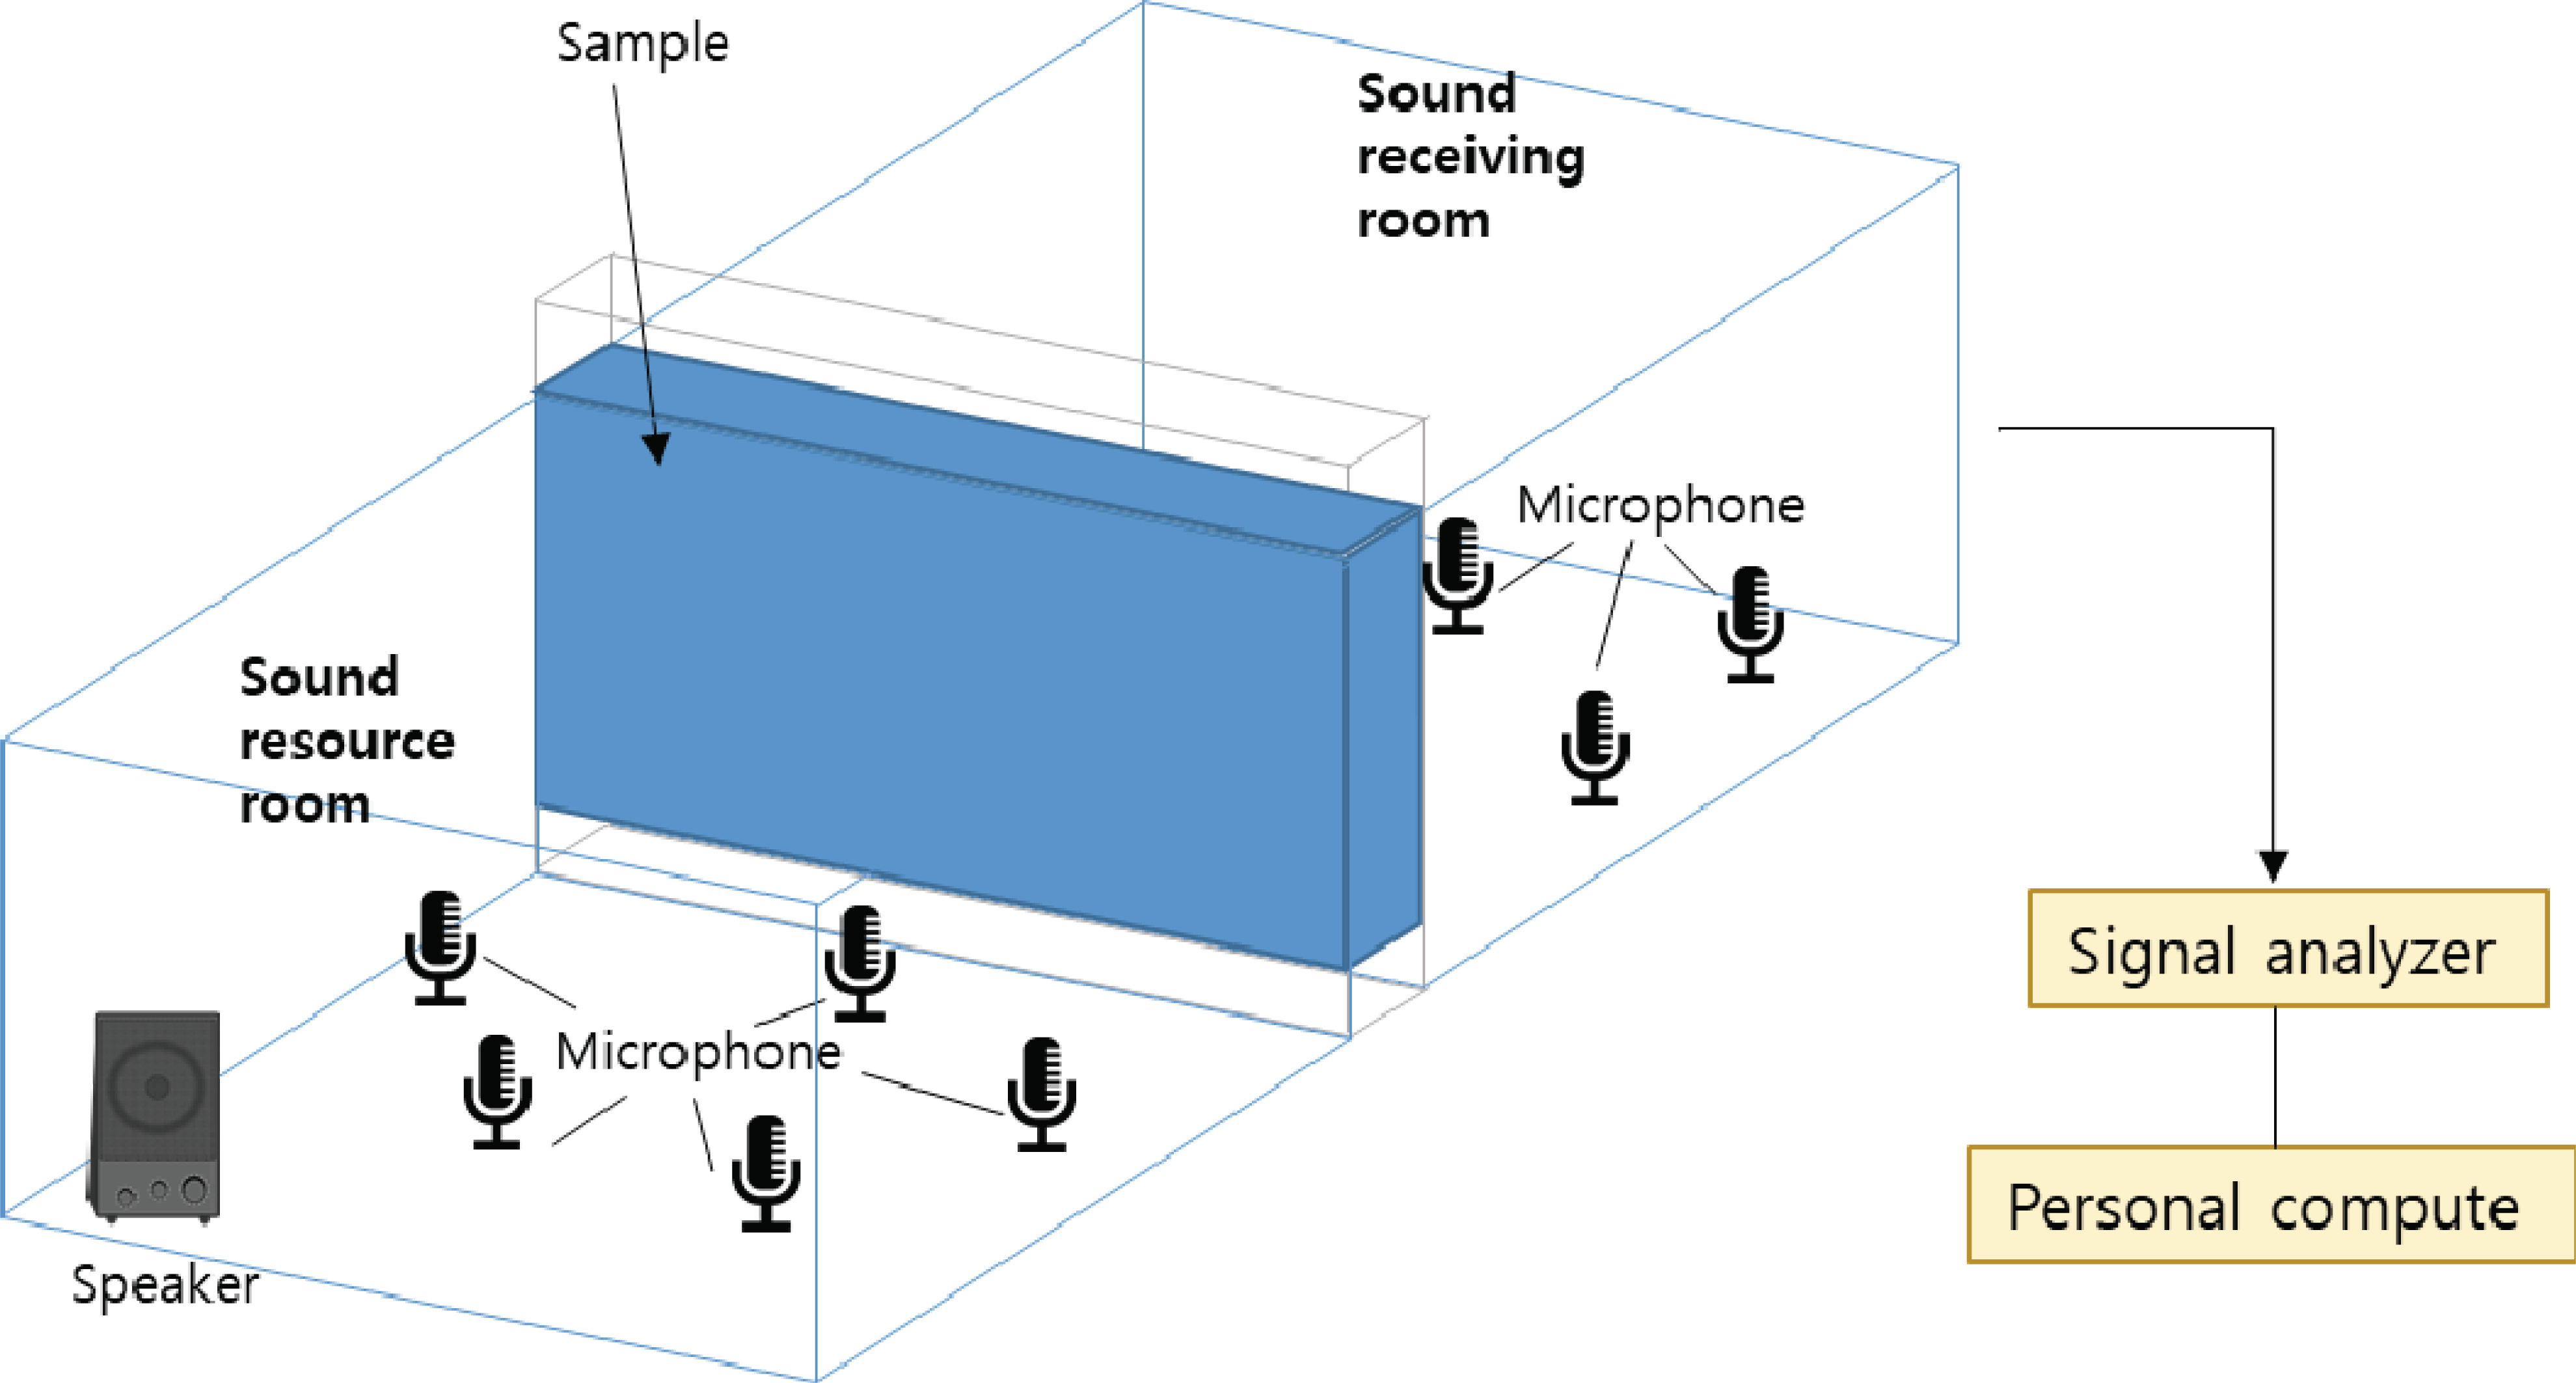
Following the specified laboratory measurement method for the sound insulation performance of buildings (KS F ISO 10140-2:2010), a specimen was placed between the sound source room and the sound-receiving room, as shown in Figs. 3 and 4. The insulation performance was evaluated by measuring the differences in the sound pressure level. The sound barrier was installed between the sound source room (volume, 51.54 m3) and the sound-receiving room (volume, 57.02 m3). The sound pressure was measured by using five microphones installed each room. Further, 5.5 pieces of unit test specimens (width, 505 mm; length, 3605 mm; thickness, 95 mm) were connected between the sound source room and receiving room. A specimen of length 3620 mm and height 2780 mm was installed, and the gap between the two boards was sealed using a sealant. During the measurement, the temperature, relative humidity, and atmospheric pressure were 7 ± 1 °C, 41 % ± 3 %, and 100.9 ± 0.1 kPa, respectively. The pure tone inside the sound source room was produced by a power amplifier (CONA V2-5000, Inter-M, Korea) and a loud speaker (D012, FALM, Germany/SRX 725, JBL, USA). The acoustical attenuation constant of specimens was calculated after measuring the average sound pressure level difference in two rooms using a real-time analyzer (PAK MK II MOLLER-BBM, Germany) and a 1/2″condenser microphone set (46AF, G.R.A.S., Denmark) in the sound-receiving room. As seen in Fig. 4, five omnidirectional microphones were set in each room at intervals of 0.7 m. The microphones were installed 1.0 m from the sound resource and 0.7 m from the boundary of room and sound diffuser. The average energy value of the measured sound pressure level difference (L) was calculated using Equation (1).
where Li is the sound pressure level from fixed measuring point I (dB) and n is the number of fixed measuring points.
Equivalent sound-absorbing power A was calculated using Equation (2).
where A is the equivalent sound-absorbing power (m2), V is the volume of sound-receiving room (m3), and T is the reverberation time of the sound-receiving room (s).
The acoustical attenuation constant R was calculated using Equation (3).
where L1 is the average sound pressure level of the sound source room (dB), L2 is the average sound pressure level of the sound-receiving room (dB), S is the area of the specimen (m2), and A is the soundabsorbing power of the sound-receiving room (m2).
3. RESULTS and DISCUSSION
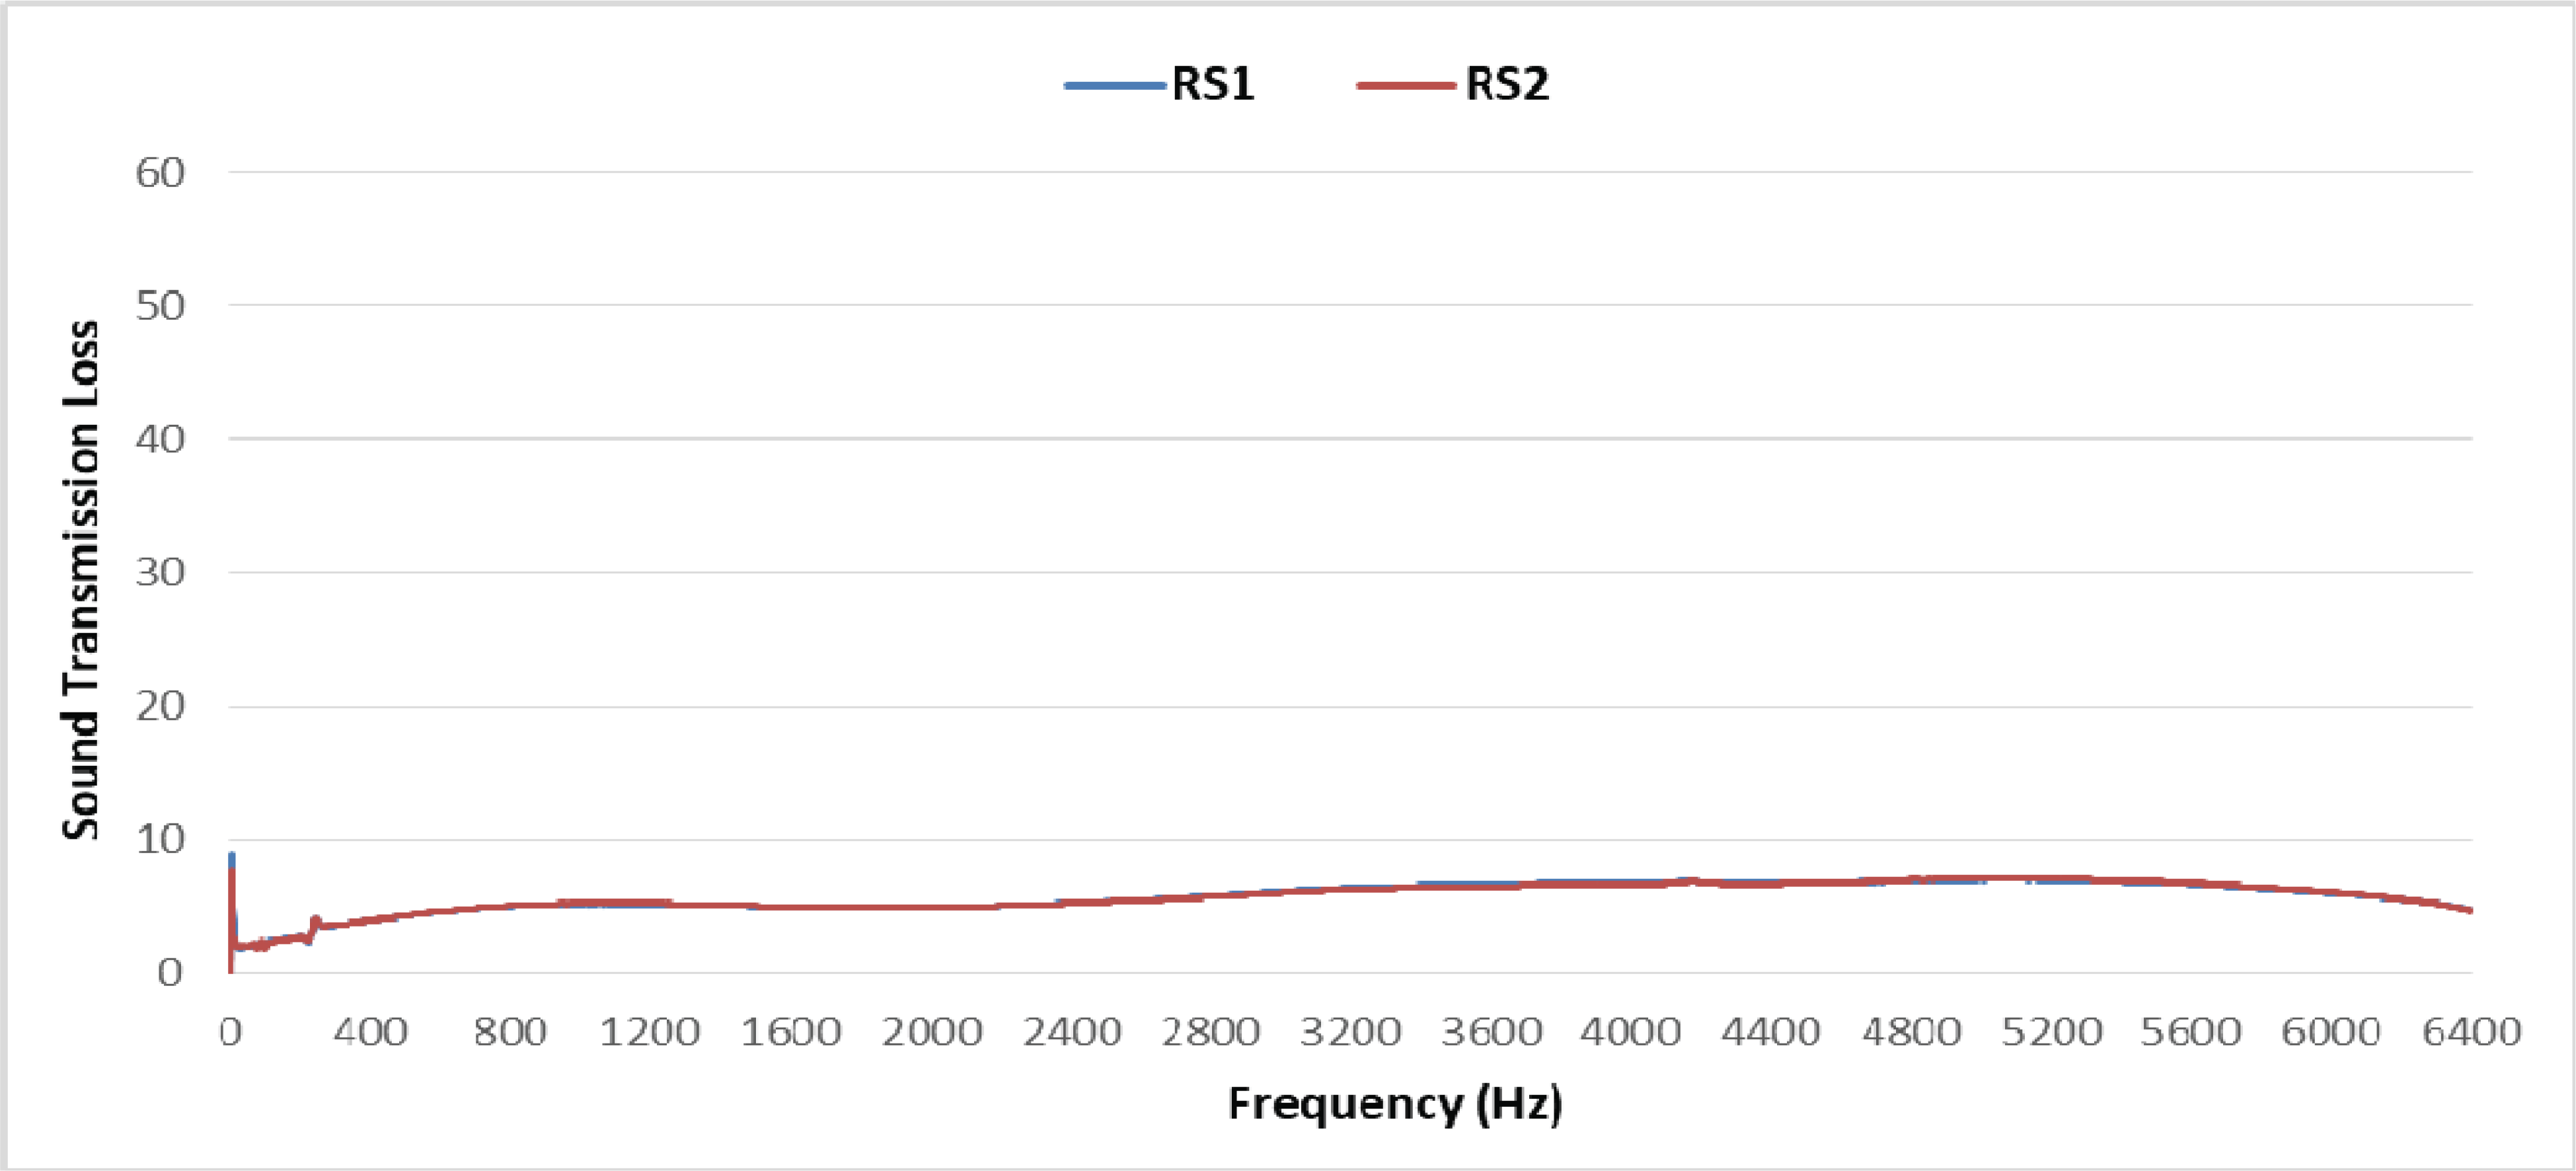
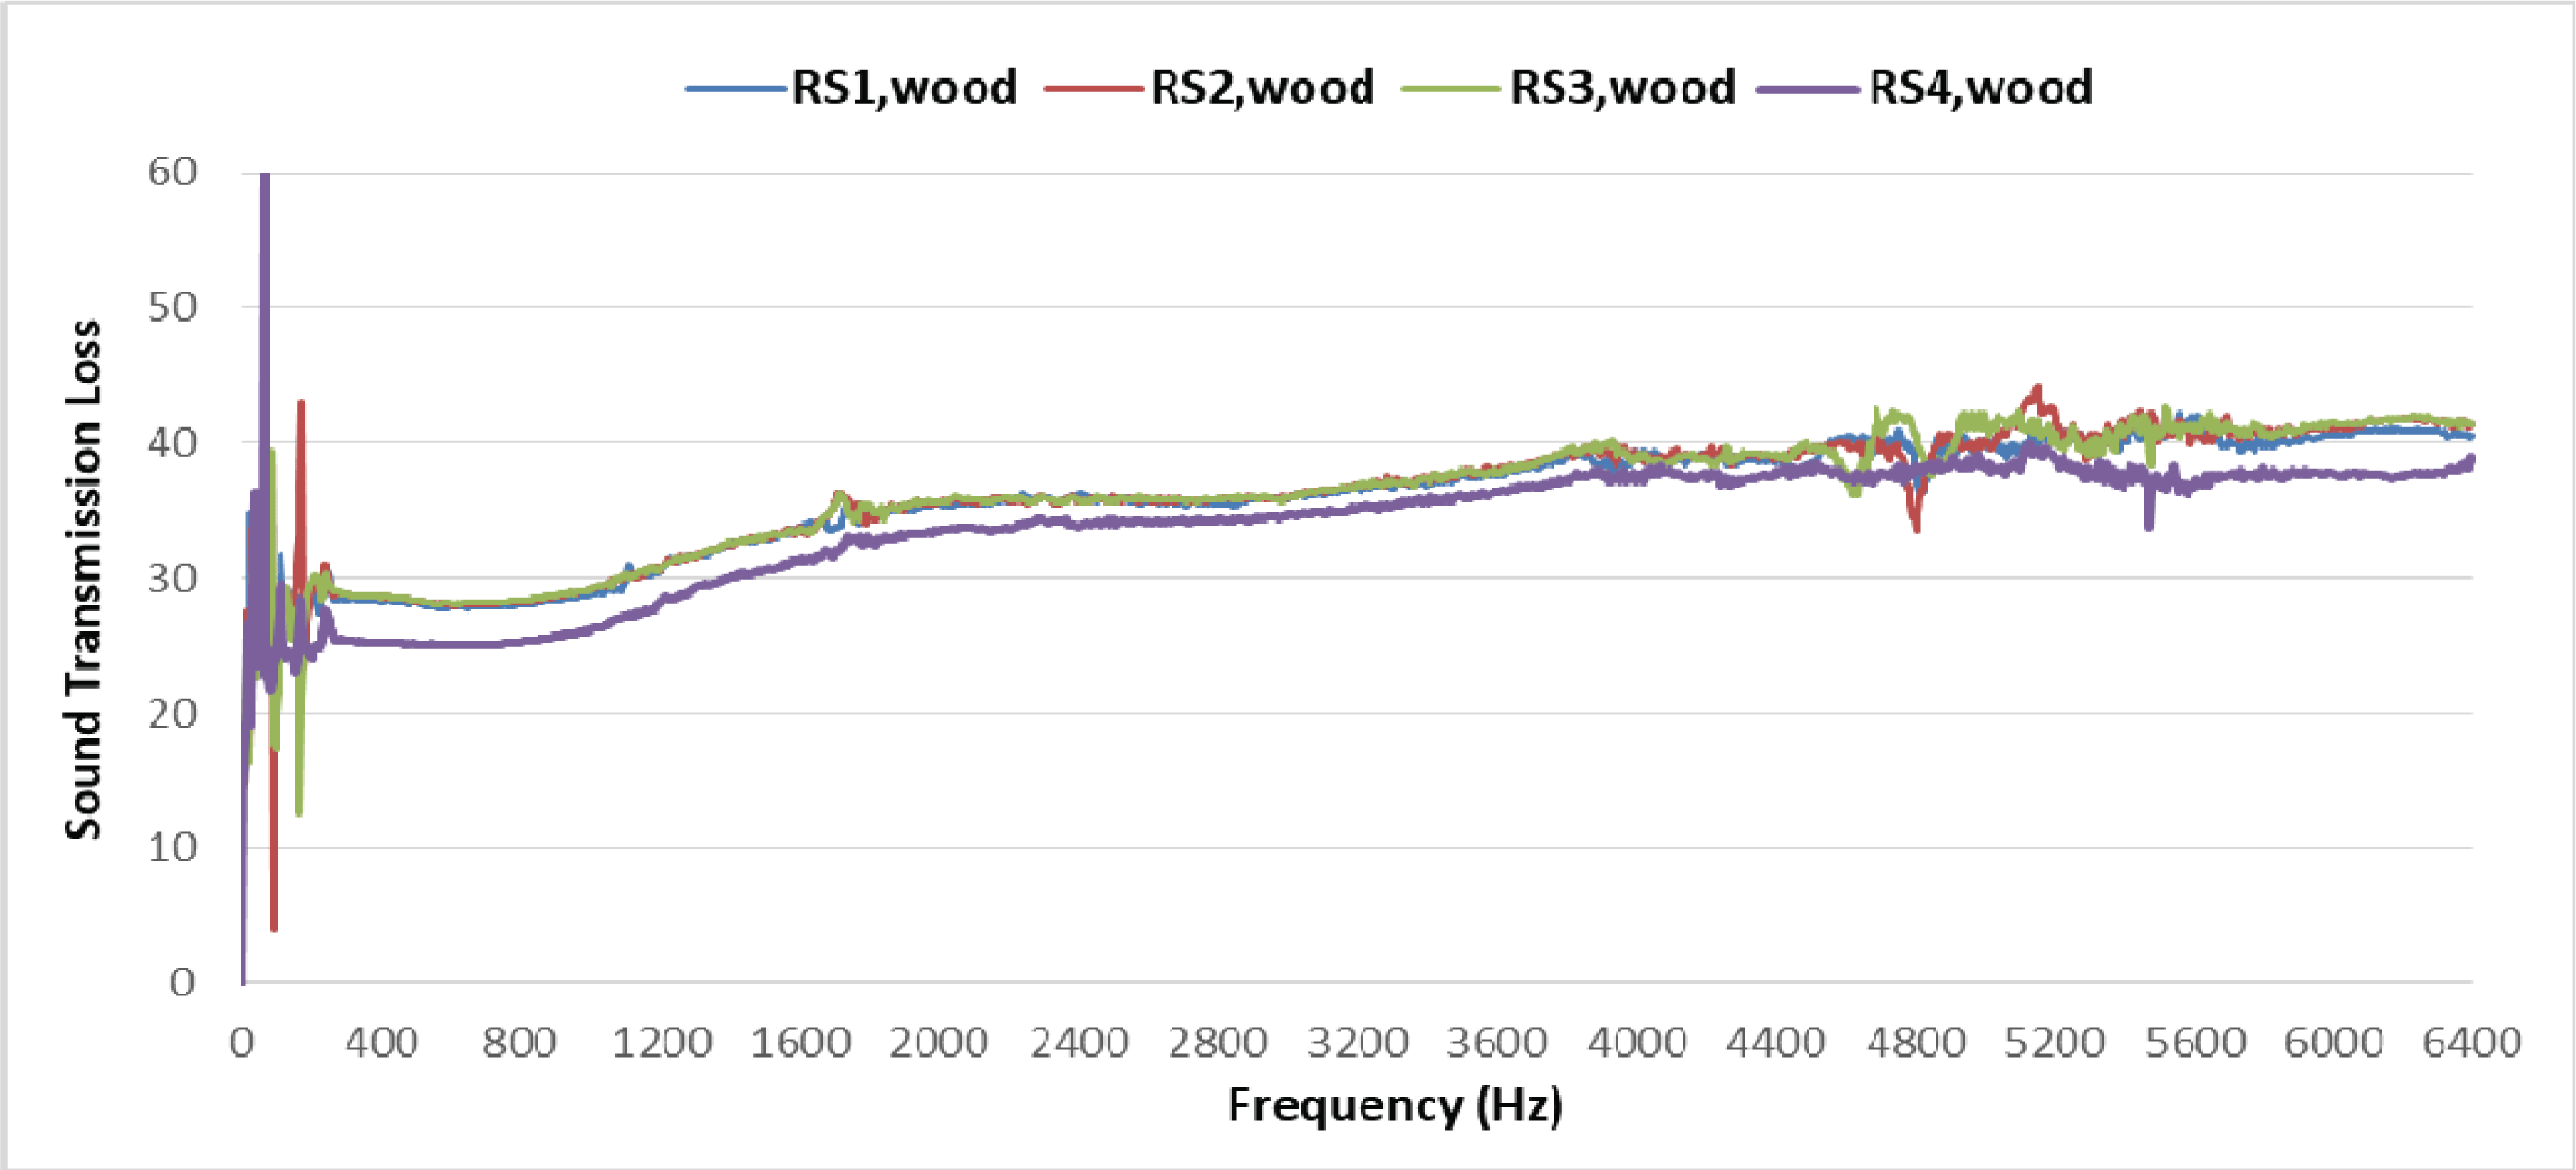
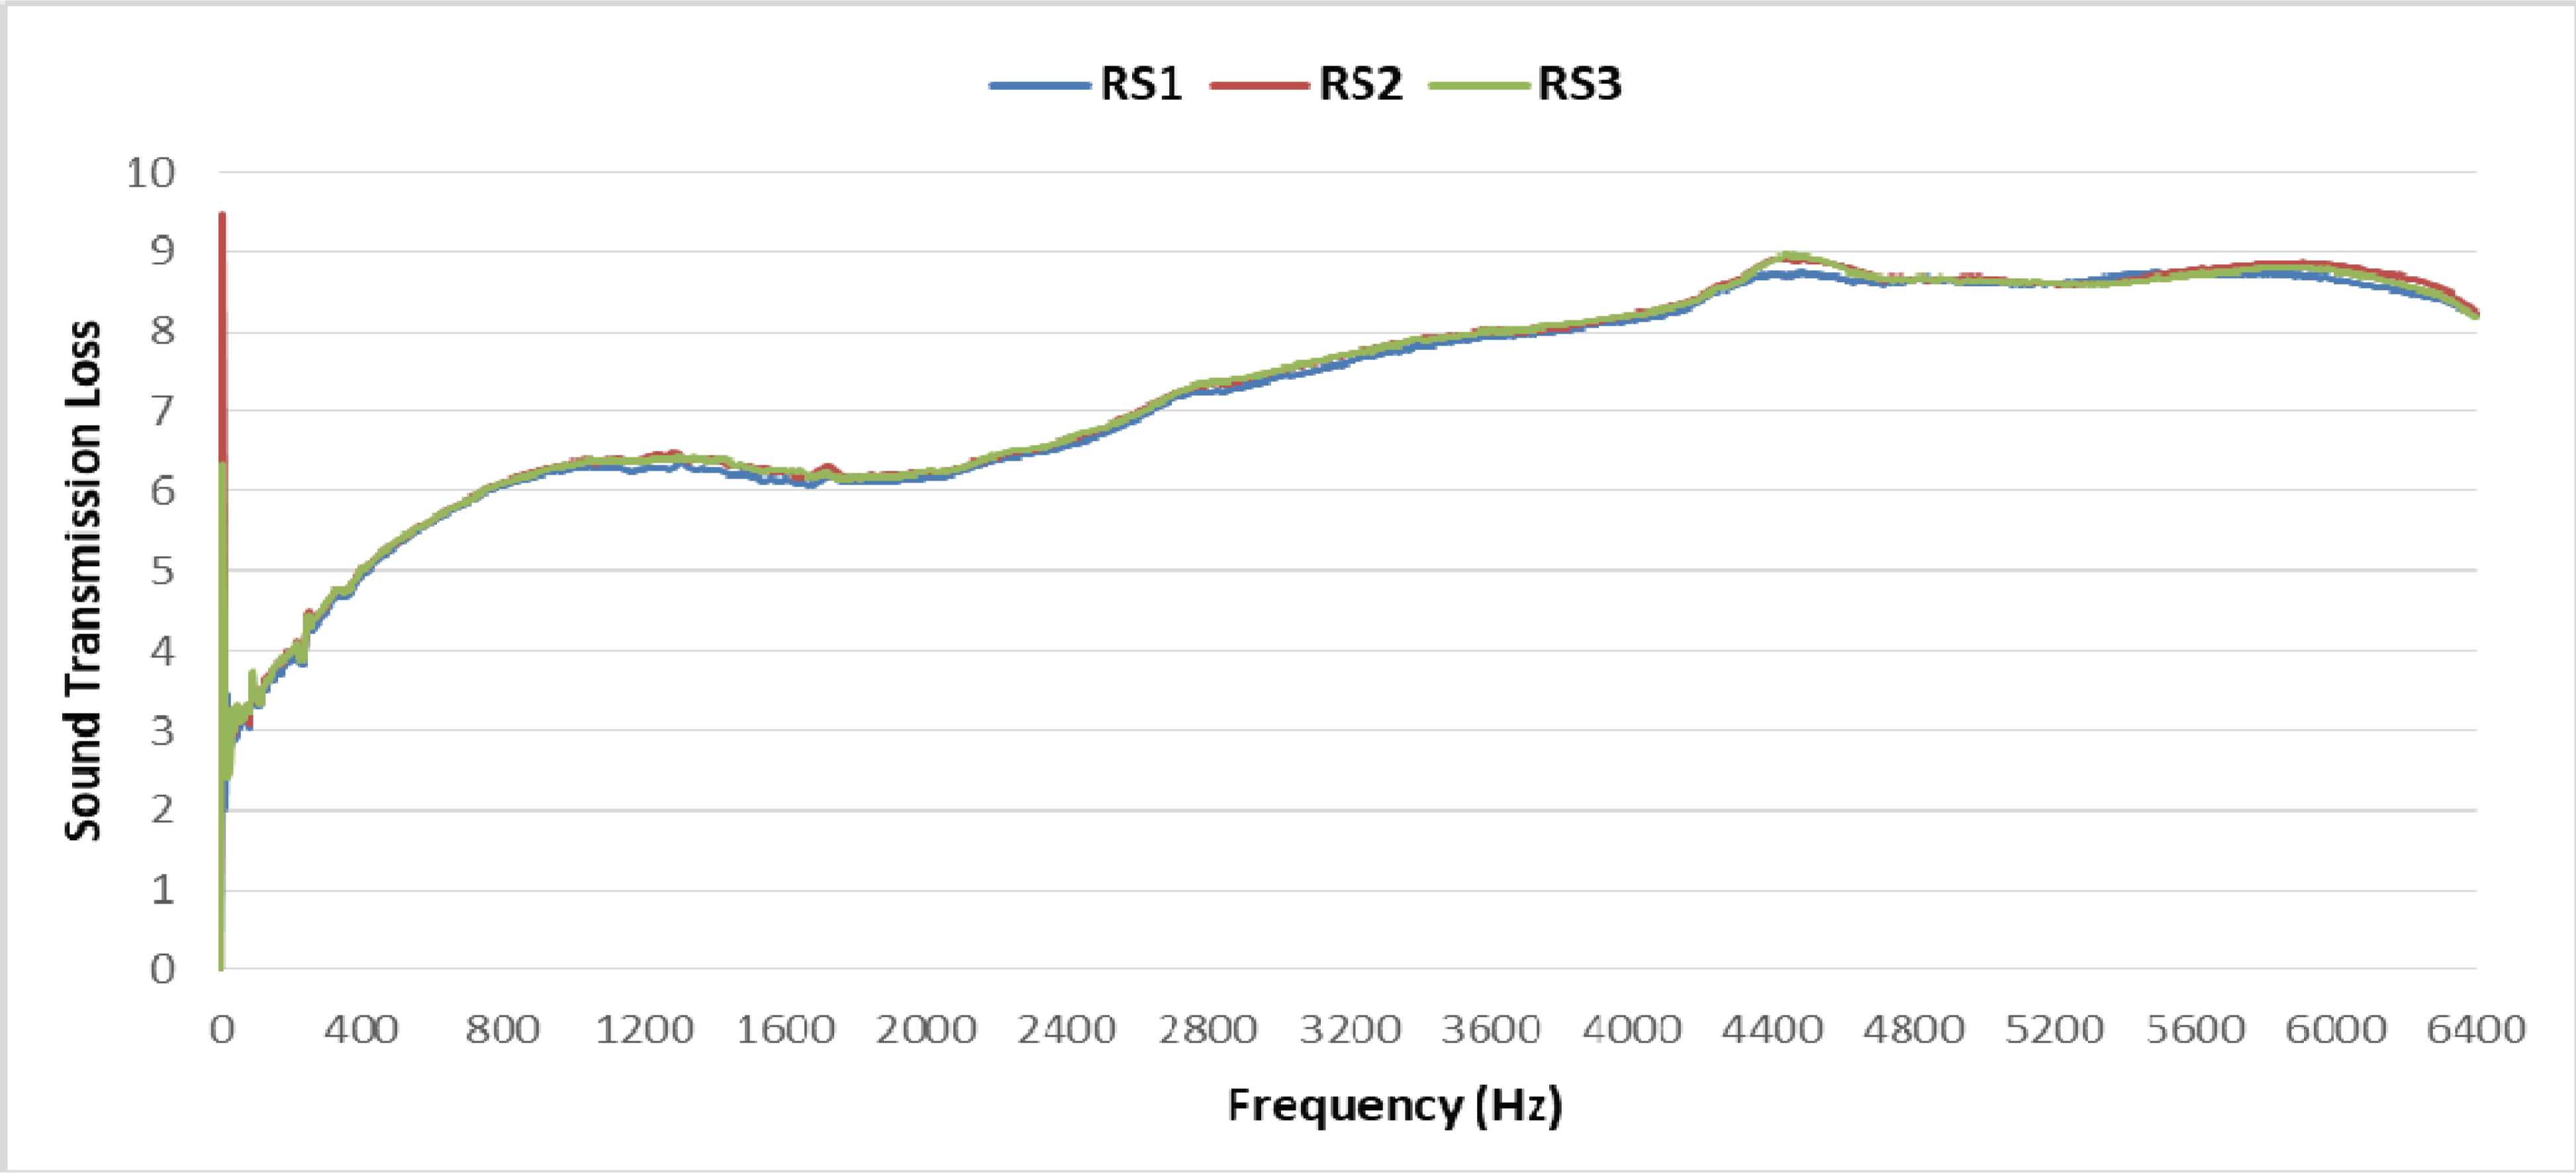
The transmission loss of specimens changed with the apparent specific density, as shown in Figs. 5-8.
During sound transmission loss measurement, the diameter of the impedance tube was limited by frequency: the diameter was 29 mm for the highfrequency range and 99 mm for the low-frequency range. In this study, the sound transmission loss was measured in the frequency range of 500-6.4 kHz using the impedance tube of diameter 29 mm.
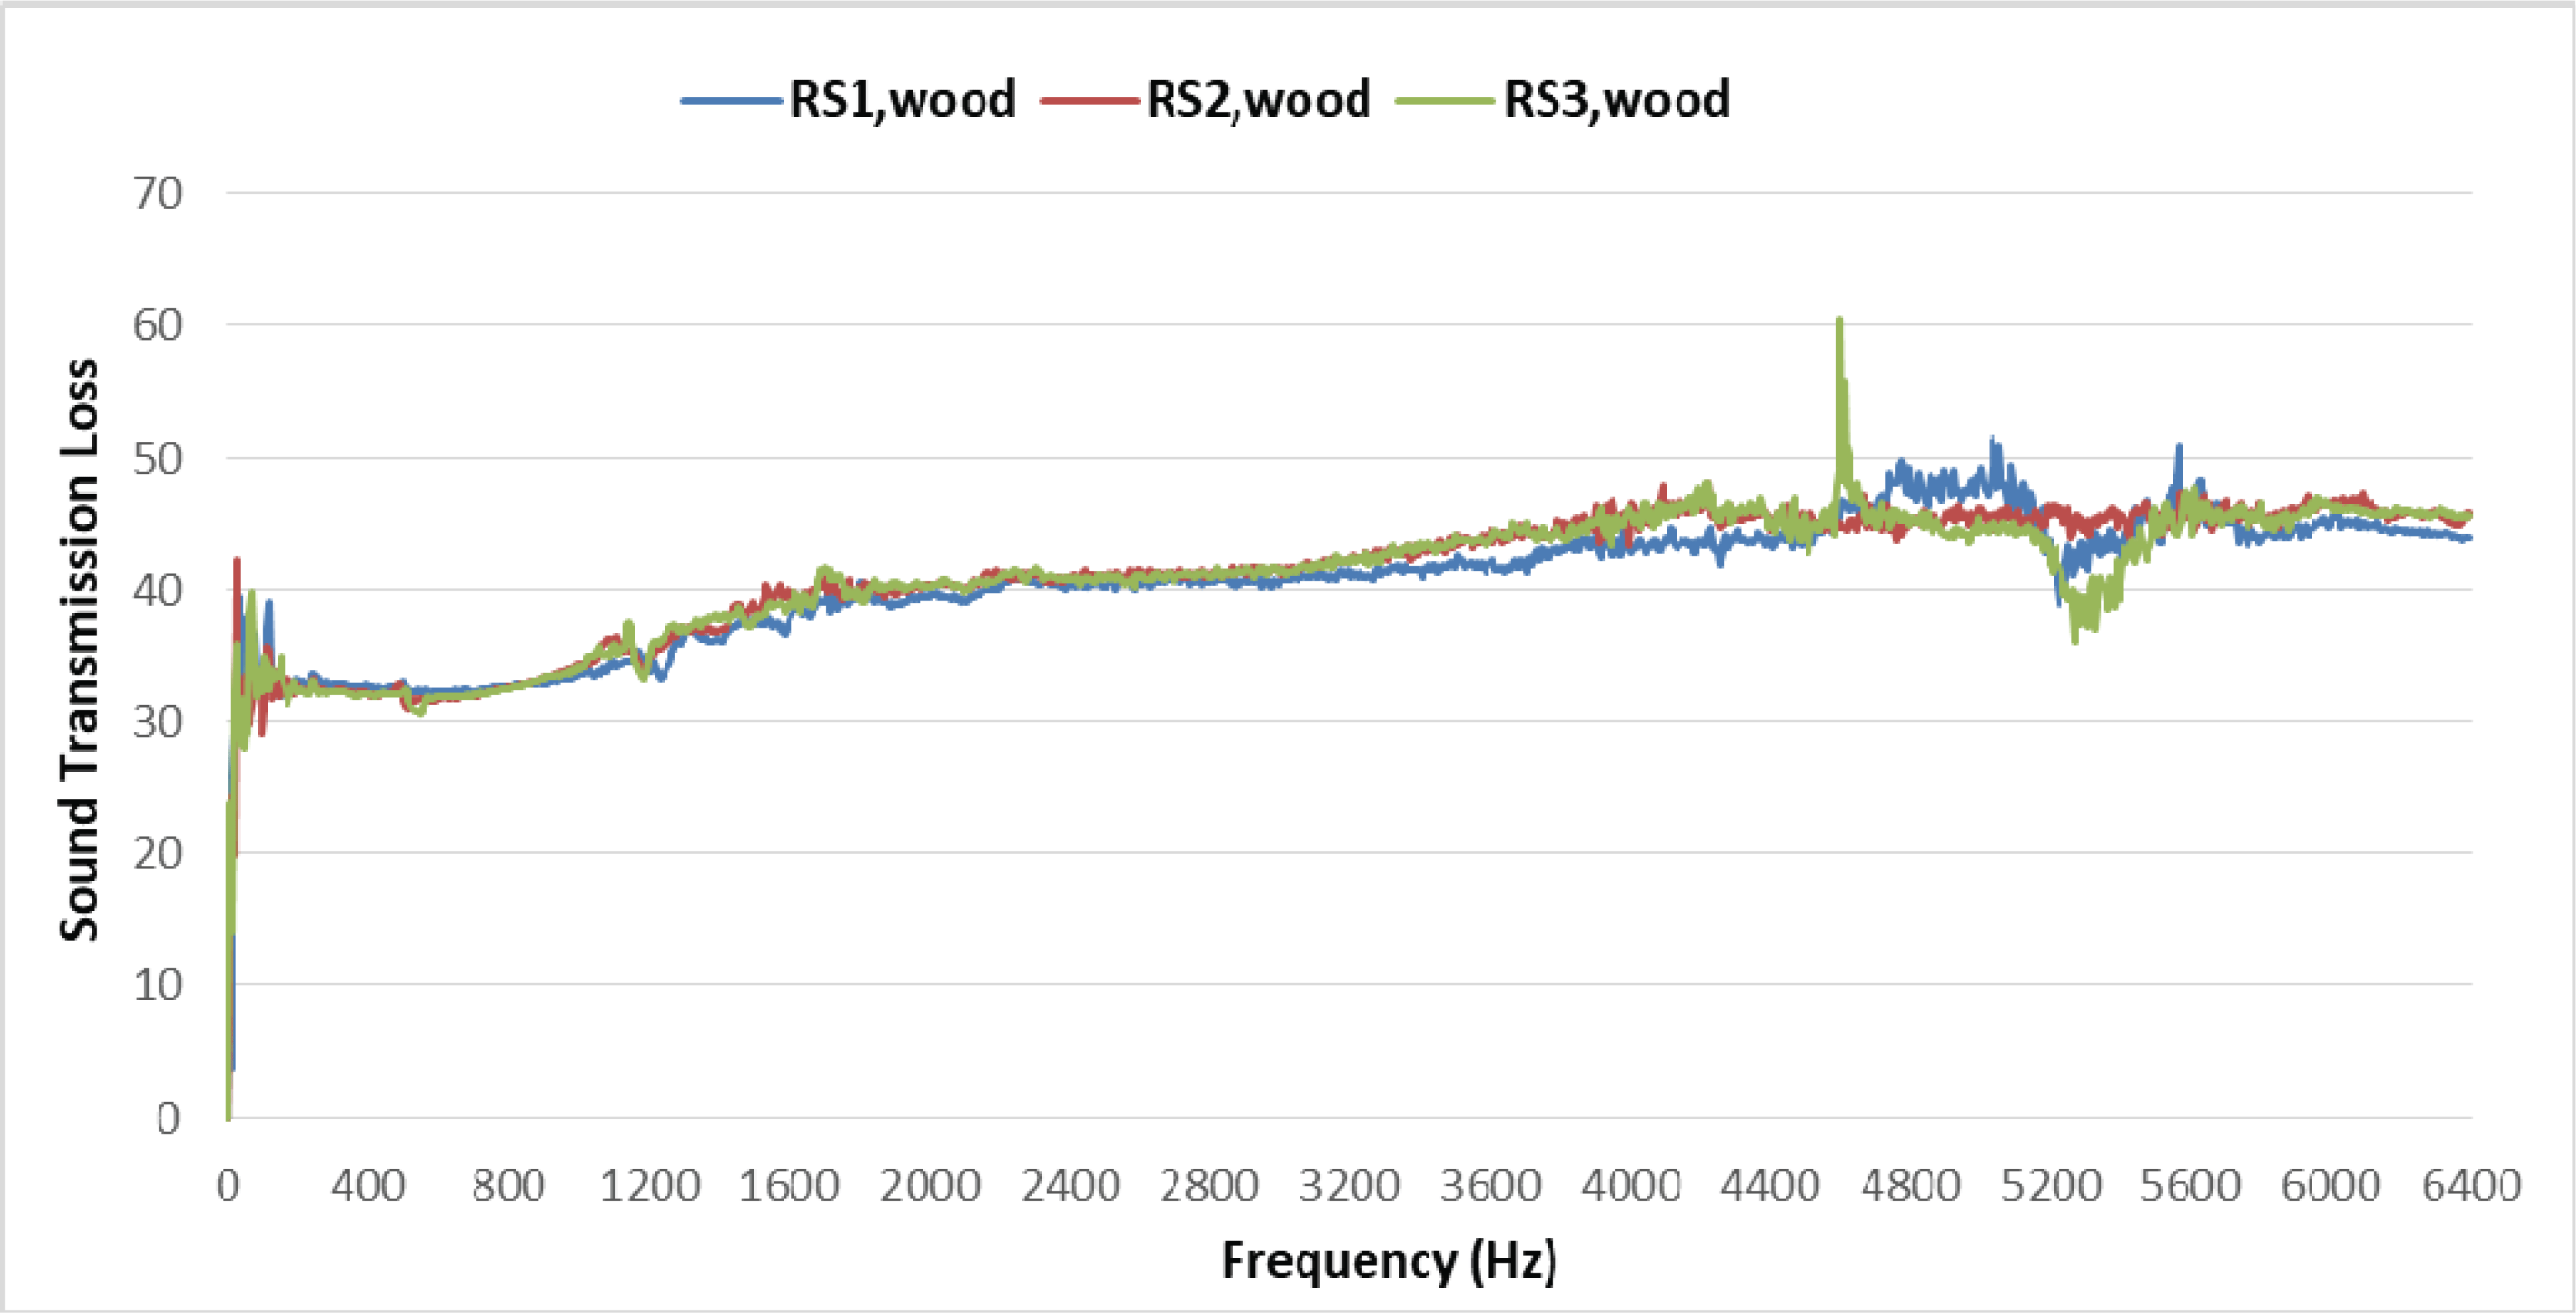
The transmission loss of the rice-straw mat increased as the density increased and as the frequency increased. The transmission loss of the 50-mm-thick rice-straw mat with a density of 0.07 g/cm3 was less than 5 dB for frequencies less than 1000 Hz. Hence, such mats are not suitable as sound insulation materials; however, for frequencies greater than 1000 Hz, the loss was 6-7 dB. Further, in the frequency range of 3000-5000 Hz, the loss was 25 dB. The transmission loss of the 50-mm-thick rice-straw mat with an additional 1-cmthick plywood layer was 25-28 dB at frequencies less than 1000 Hz, greater than 30 dB for frequencies greater than 1000 Hz, and 35-50 dB for the frequency range of 3000-5000 Hz. The 1-cm-thick plywood layer behaved as a 1-mm-thick iron back plate of the sound barrier owing to the similar surface density of the two layers. Such mats can be used as sound insulation materials.
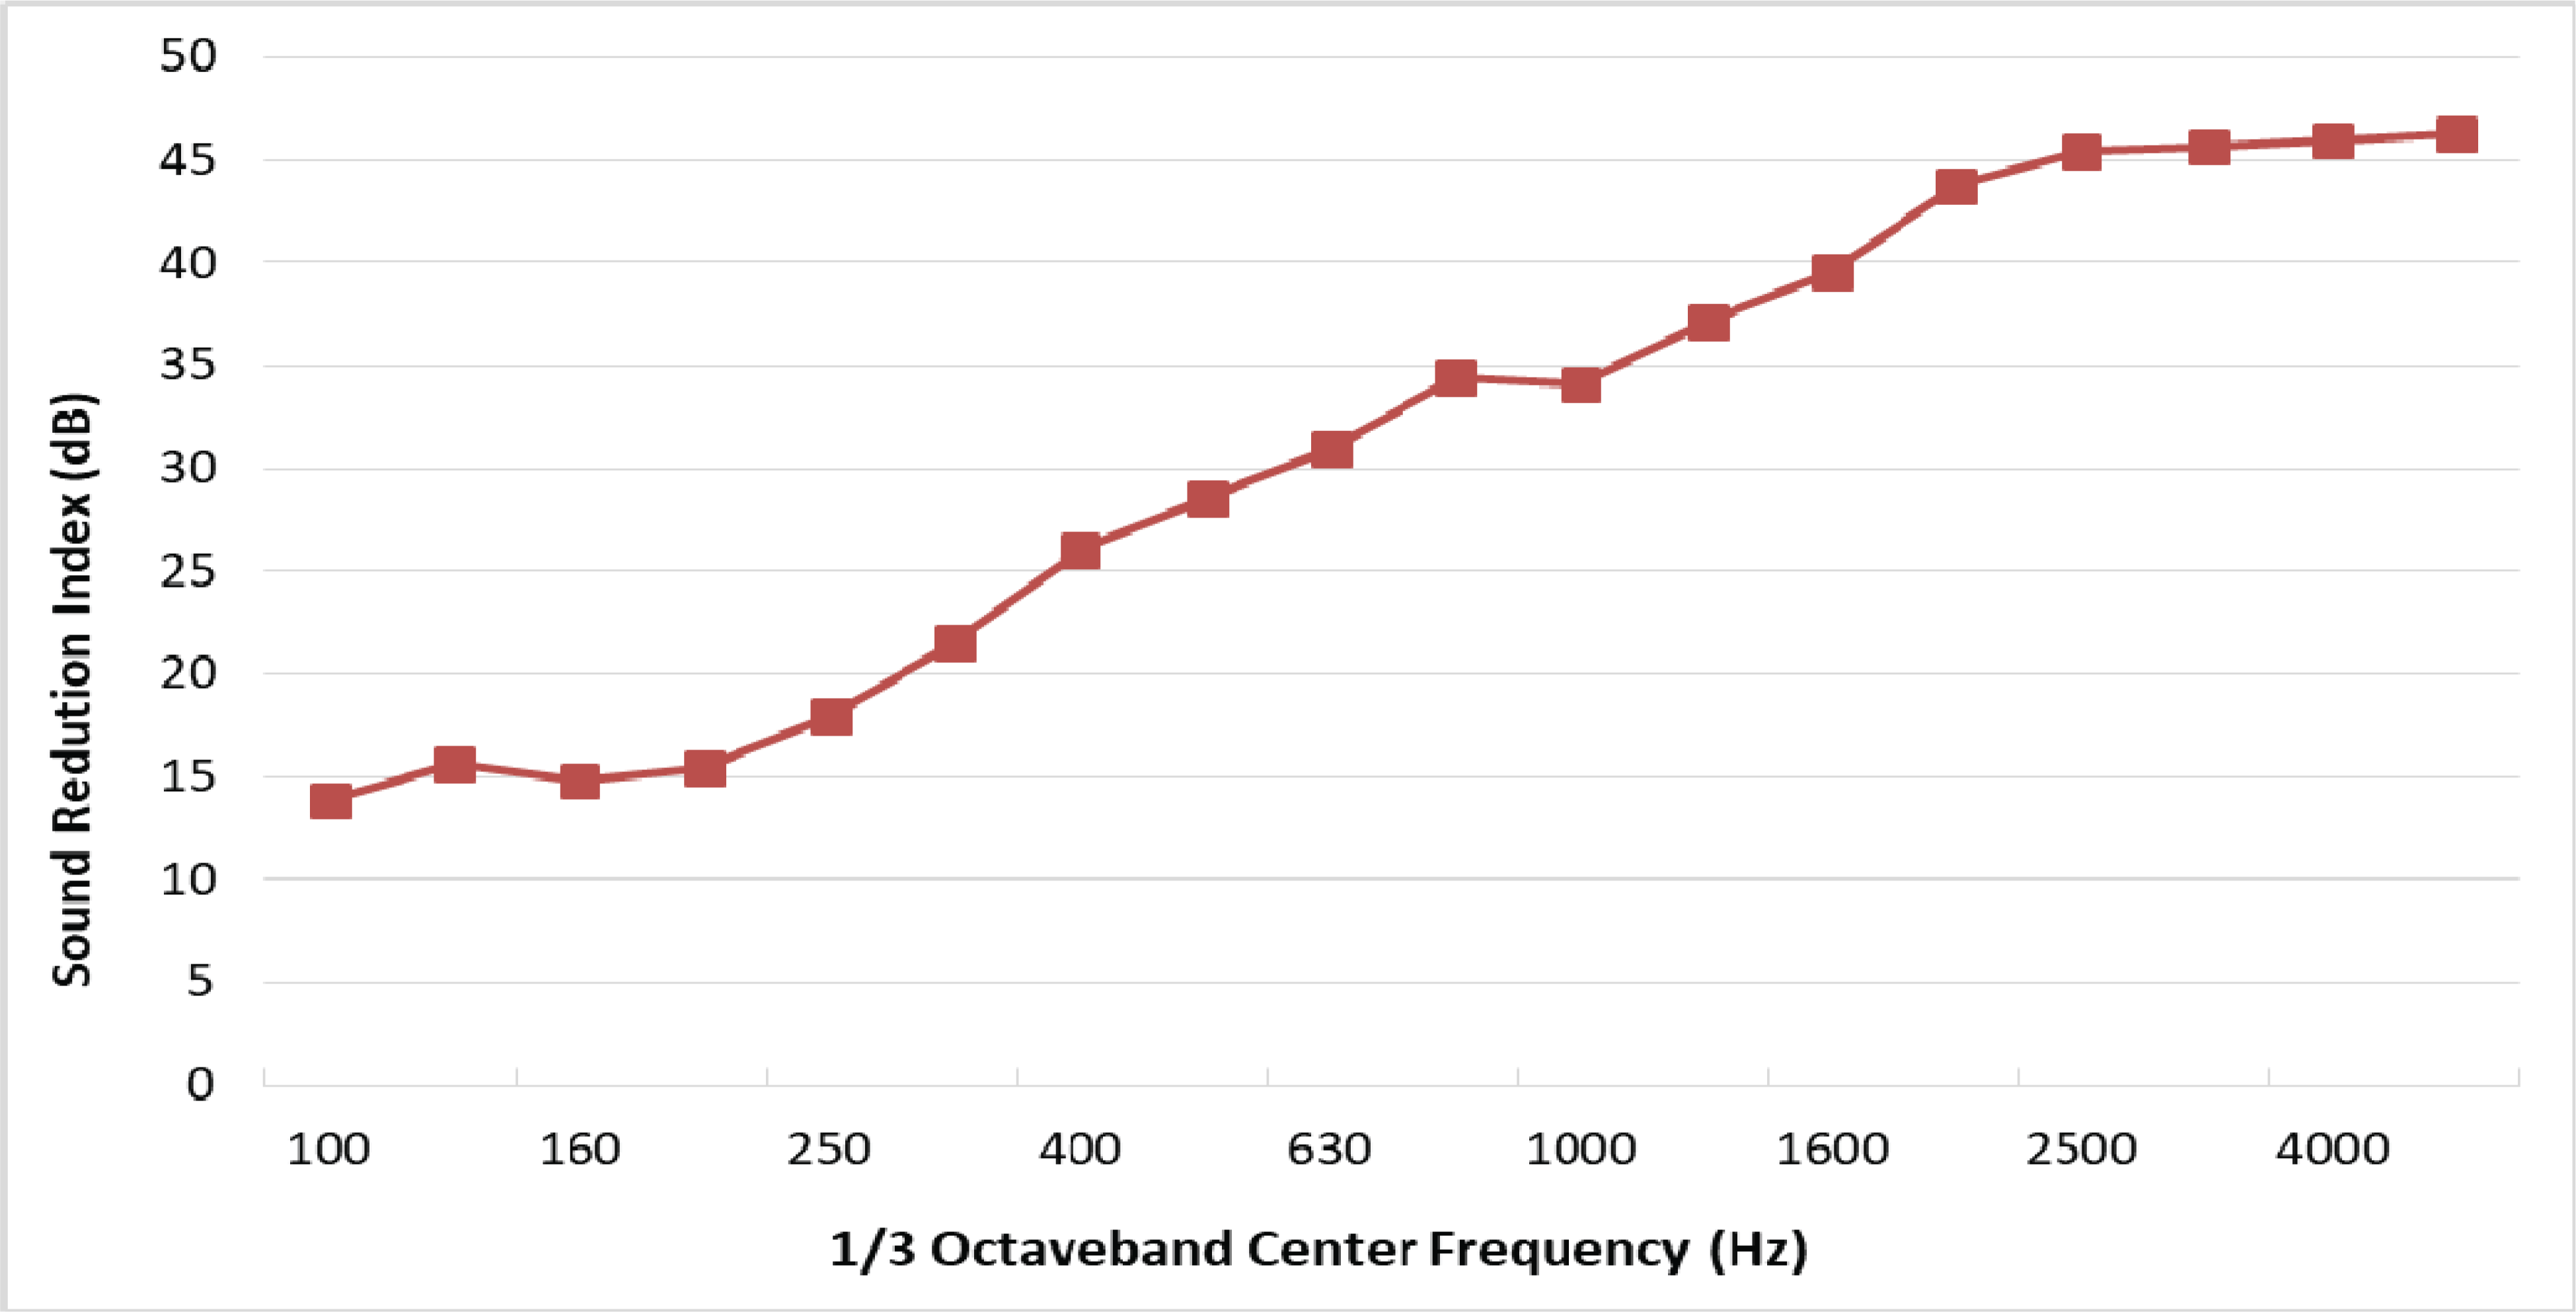
The sound transmission loss was also estimated by a laboratory measurement method. The results were directly compared with those obtained using the impedance tube method because both results were corrected by the environmental conditions. In the laboratory measurement method, the sound insulation performance of the building was obtained using five microphones installed at intervals of 0.7 m apart. The results are presented in Fig. 9. The transmission loss coefficient was 15 dB for frequencies less than 200 Hz, 35 dB for frequencies up to 800 Hz, and 45 dB for a frequency of 2500 Hz. According to the regulation of the Ministry of Land in Korea, the transmission loss coefficient of the sound barrier for roads should exceed 25 dB for a frequency of 500 Hz and 30 dB for a frequency of 1000 Hz; in this study, the corresponding values of the sound barrier were 28.55 dB for 500 Hz and 34.1 dB for 1000 Hz. The transmission loss of the specimens was close to but higher than the loss measured by the transfer function method for the frequency range 500-4000 Hz. This could be attributed to the differences in the materials on which the sound is incident.
4. CONCLUSION
The sound transmission loss, which indicates the sound insulation capability of a building, was measured for a rice-straw particle mat by using the transfer function method and a laboratory measurement method. The measurement results were compared. The following conclusions were drawn.
The transmission loss values of the sound barrier filled with rice-straw particles as measured by the two methods were similar for 500-4000 Hz.
The transmission loss of the sound barrier filled with rice-straw particle with an additional plywood layer was significantly higher; therefore, such mats are suitable for use as sound barriers for roads.

