

1. INTRODUCTION
Wood packaging material (WPM), including pallets, crates, and dunnage, is widely used to load, secure, and protect internationally traded cargo. Unprocessed WPM, which closely resembles roundwood, can serve as a potential vector for harmful organisms such as wood-boring insects (e.g., Cerambycidae and Scolytinae) and nematodes, and has been identified as a major pathway by which invasive pests cross national borders (Haack et al., 2014; Meurisse et al., 2019). The tree species and forms of processing used for WPM vary among countries and industries, and alternative materials, such as block pallets manufactured by compressing waste-wood chips, have recently been developed to avoid the risks associated with WPM (Hermawan et al., 2024a).
The International Plant Protection Convention (IPPC) adopted International Standard for Phytosanitary Measures No. 15 (ISPM 15) in 2002, requiring approved phytosanitary treatments before export, such as heat treatment (HT) or methyl bromide (MB) fumigation, and the display of the ISPM 15 mark (country code, producer number, and treatment method; IPPC, 2018). Using the United States quarantine monitoring data, Haack et al. (2022) reported that the detection rate of wood-boring insects declined by approximately 61%, from 0.34% in 2003 to 0.21% in 2020, after implementation of ISPM 15, demonstrating the effectiveness of the standard while noting that detections had not been eliminated. The insecticidal effectiveness of HT depends on whether the core temperature of the wood reaches the prescribed conditions; internal temperature distributions may be uneven depending on wood thickness, initial moisture content, and drying method (Lee et al., 2024; Sumardi et al., 2024). In addition, as international restrictions on MB, an ozone-depleting substance, have increased reliance on HT, interest in the limitations of treatment methods and alternative treatment technologies has grown (Priadi et al., 2023).
Nevertheless, quarantine non-compliance resulting from counterfeit marks, inadequate treatment, post-treatment reinfestation, and repeated pallet reuse continues to be detected at borders worldwide, and quarantine authorities must monitor enormous trade volumes with limited resources (Brockerhoff et al., 2006).
Korea and the United States are both major trading countries that implement ISPM 15, but their trading-partner composition and geographic conditions differ markedly. Korea, a peninsular country, relies on sea and air transport and has a high share of intraregional trade with Asian countries such as China and Vietnam (for the properties and uses of major domestic wood species, see Park et al., 2024). In contrast, the United States shares extensive land borders with Mexico and Canada, and truck and rail transport across these borders is active. These structural differences are likely to produce different types of quarantine risk in the two countries.
This study harmonized non-compliance data from Korea and the United States through variable mapping and compared them across six dimensions: non-compliance type, country of origin, transport mode, commodity, seasonality, and detected pests, to (1) diagnose differences in the regulatory approaches of the two countries, (2) identify the effects of geographic and logistical conditions on quarantine risk, and (3) propose policy directions toward targeted inspection.
2. MATERIALS and METHODS
The Korean dataset comprised 3,924 records of WPM inspection non-compliance of imported cargo by the Animal and Plant Quarantine Agency (APQA), from 2010 to early 2026. The United States dataset comprised 7,822 records of WPM non-compliance detected by the United States Department of Agriculture, Animal and Plant Health Inspection Service (USDA APHIS), from 2020 to 2025.
The country variables in the two datasets are not defined identically. The United States dataset records the country of origin, whereas the Korean dataset records the exporting country. Because these concepts may differ when entrepôt trade is involved, they are collectively referred to as “country of origin” in this study, while recognizing that they are not strictly identical; this limitation is discussed again below. Hereafter, the term “country of origin” is used consistently to avoid mixed terminology.
Because the datasets differ in collection period and recording structure, analyses of proportions (%) among all non-compliance cases were conducted in addition to direct comparisons of absolute counts to control for statistical distortions caused by population differences. For time-series comparisons, the overlapping 2020–2025 period was used as a supplementary interval.
Key analytical variables were mapped to harmonize the different data structures of the two countries (Table 1). Regulatory violations, such as missing ISPM 15 marks and inadequate debarking, were classified as “administrative violations,” whereas cases in which pests were actually detected were classified as “biological violations.” A small number of cases that could not be classified into either category (ETC or cases with no stated reason in the Korean dataset) were retained separately as “Other” so that the component proportions summed to 100%.
Transport mode was derived from information on the port of entry and inspection office. In Korea, records were classified as air transport when the inspection-office name included “airport”; all other port offices were classified as sea transport. Because Korea has no land border, land transport was not applicable (N/A), and 10 records (0.25%) in which the inspection office was listed as “no data” were retained as “Unknown.” In the United States, ports of entry were classified into three categories: air (airports and courier hubs), land (land customs-clearance sites along the Mexican and Canadian borders), and sea (all other ports). Seasons were defined as spring (March–May), summer (June–August), autumn (September–November), and winter (December–February).
The denominators of the two proportional indicators used in this study differ and are defined as follows. First, the “proportion among all non-compliance cases” is the composition ratio using the total number of non-compliance cases in the relevant country as the denominator. Second, the “proportion of pest detection within non-compliant consignments” uses the number of non-compliance cases detected in a specific category (transport mode or commodity) as the denominator and the number of those cases in which pests were detected as the numerator. The latter does not indicate the proportion of all cargo imported in that category in which pests were detected. For example, a pest-detection proportion of 36.0% for tile does not mean that pests were detected in 36.0% of imported tile consignments; rather, it means that pests were detected in 99 (36.0%) of the 275 non-compliance cases detected among tile consignments. A true detection rate using total imported cargo volume as the denominator could not be calculated because data on the total number of imports by commodity were unavailable.
Descriptive statistics and cross-tabulations were used to calculate the composition of non-compliance types, rankings of countries of origin, distributions by transport mode, proportions of pest detection by commodity, and monthly and seasonal trends. Statistical significance of differences among categories was evaluated using Pearson’s chi-square test, with Yates’ continuity correction applied to 2 × 2 contingency tables. For the Korean sea-versus-air comparison, one cell had an observed frequency of zero and the marginal total for pest detection was sparse (19 of 3,914); therefore, the chi-square result was confirmed using Fisher’s exact test. Effect sizes were reported as Cramér’s V; however, because V may understate practical differences between groups for rare outcomes such as pest detection, risk ratios (RRs) were also reported where necessary. The significance level was α = 0.05. Data processing and visualization were conducted using Python 3.10 (pandas, matplotlib, and SciPy).
The comparison of non-compliance types by country was performed using two categories, “administrative violation” and “pest detection”; the 37 “Other” cases, which belonged to neither category, were excluded from the test. Accordingly, the Korean denominator used for the test was 3,887, which differs from the total of 3,924 non-compliance cases used to calculate composition ratios.
3. RESULTS and DISCUSSION
In both countries, most non-compliance cases were administrative violations, such as missing ISPM 15 marks (Fig. 1). Of 3,924 cases in Korea, missing marks accounted for 97.50% (3,826 cases), inadequate debarking for 1.07% (42 cases), pest detection for 0.48% (19 cases), and Other for 0.94% (37 cases); the counts for these four categories total 3,924 and thus sum to 100%. In the United States, missing marks accounted for 91.26% (7,138 cases) and pest detection for 8.74% (684 cases). In the two-category test of administrative violations and pest detection, the proportion of cases with pest detection was significantly higher in the United States (684/7,822 = 8.74%) than in Korea (19/3,887 = 0.49%; χ2 = 312.1, df = 1, p < 0.001). Although the effect size, Cramér’s V = 0.163, was not large, this is because administrative violations accounted for an overwhelming majority in both countries, limiting the predictive power of country for the type of an individual case. The pest-detection proportions themselves differed substantially, with a RR of 17.9 between the two groups.
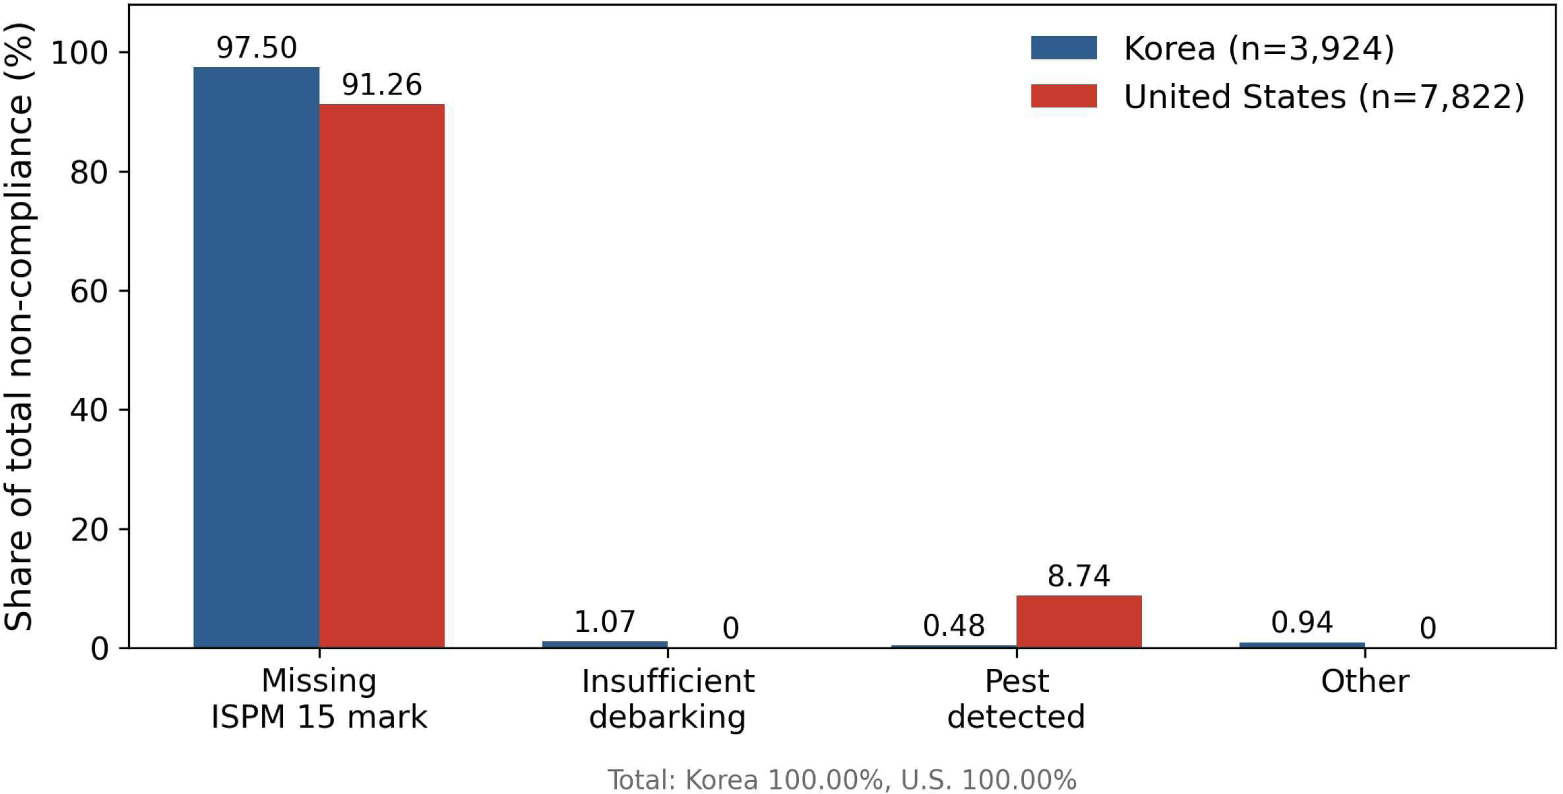
This gap cannot be explained by differences in collection periods alone. Even when the Korean data were limited to the overlapping 2020–2025 period, the proportion of pest detection was only 0.38%. Nevertheless, caution is required before interpreting this difference directly as a difference in actual pest-introduction pressure between the two countries. APHIS records pest detection separately as “the United States pest of concern,” whereas in Korea, processing may be concluded through return or disinfestation measures at the stage of detecting a missing mark, resulting in a lower proportion of cases proceeding to pest identification. Thus, the observed gap likely reflects both differences in actual pest occurrence and differences in quarantine-recording practices, and these two factors cannot be disentangled using the present data alone.
Comparison of the top 10 countries of origin for non-compliance (Fig. 2, Table 2) revealed differences in the trade structures of the two countries. In Korea, China ranked first, accounting for 31.2% (1,226 cases), followed by Vietnam (13.8%) and the United States (11.9%). In the United States, Mexico accounted for the largest share, at 34.2% (2,675 cases), followed by China (7.3%), Turkey (5.7%), India (4.7%), and Germany (4.1%).
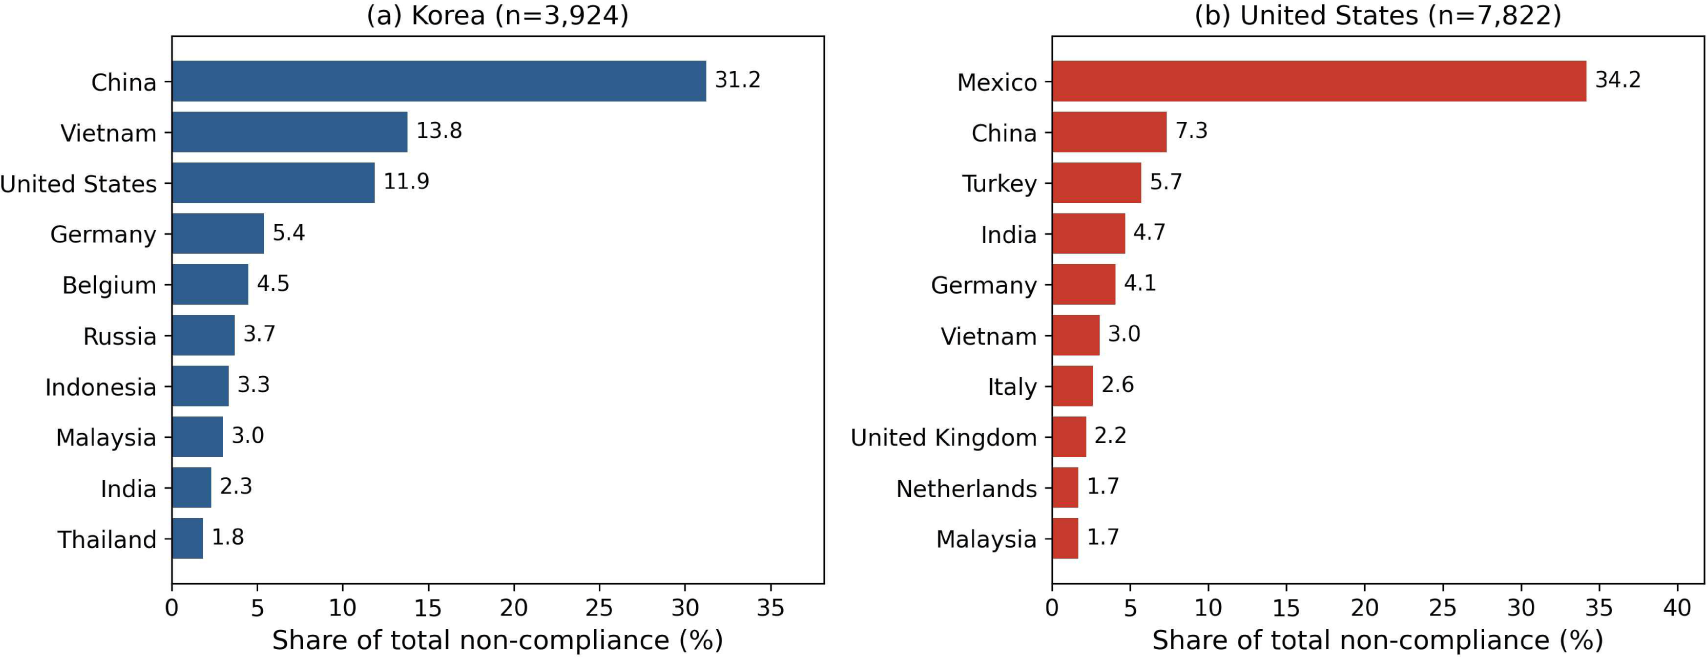
Percentages in parentheses are based on the total number of non-compliance cases in each country (Korea, n = 3,924; United States, n = 7,822). Country names are standardized in English. As in Fig. 2, the table presents the top 10 countries.
Of the 2,675 non-compliance cases from Mexico, 2,430 (90.8%) entered by land. Administrative violations accounted for 95.7% of Mexican non-compliance cases, which is presumed to be related to mark wear and reuse of pallets repeatedly crossing the border. However, because the present dataset does not record pallet reuse histories, this should be regarded as an interpretive hypothesis rather than a directly verified result. Korea’s concentration in China appears to reflect geographic proximity and trade volume.
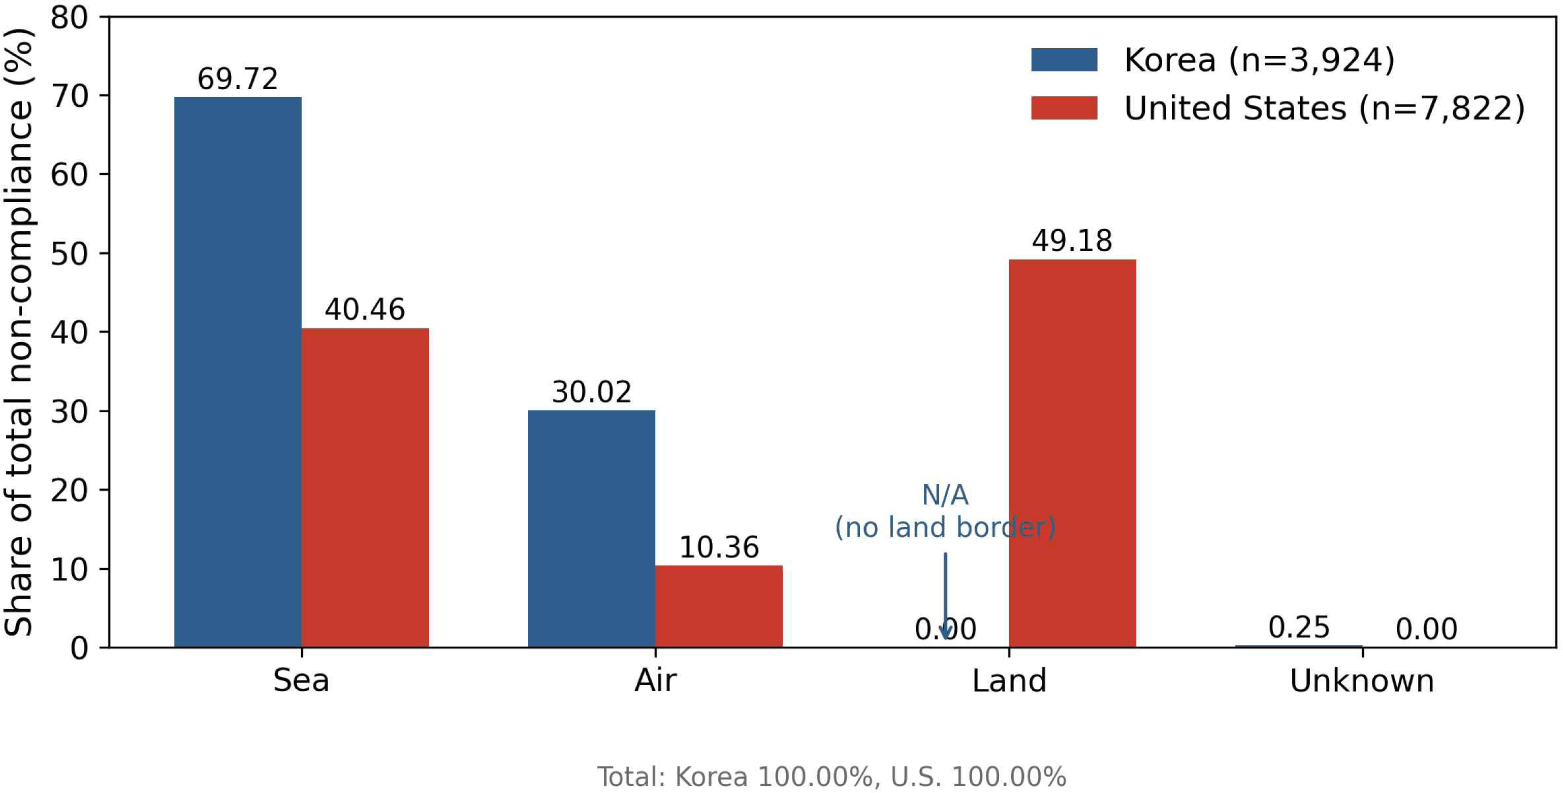
The distribution of non-compliance by transport mode illustrates differences in the logistics structures of the two countries (Fig. 3). Korea comprised sea transport (69.72%), air transport (30.02%), and Unknown (0.25%); land transport was N/A because Korea has no land border. In the United States, land, sea, and air transport accounted for 49.18%, 40.46%, and 10.36%, respectively.
Non-compliance types by transport mode in the Korean dataset are shown in Table 3. All 19 pest-detection cases occurred in sea transport, and none was identified in air transport (sea: 19/2,736 = 0.69%; air: 0/1,178 = 0%). This difference was statistically significant (χ2 = 6.85, df = 1, p = 0.009; Fisher’s exact test, p = 0.002). In the United States, the proportion of pest detection was also higher for sea transport (17.76%) than for land (3.17%) or air (0%) transport (Table 4; χ2 = 549.5, df = 2, p < 0.001; Cramér’s V = 0.265). Thus, the tendency for pest detection to be relatively more frequent in sea transport was observed in both countries. However, the absolute levels differed substantially, 0.69% in Korea and 17.76% in the United States, and should not be interpreted as phenomena of the same magnitude (Fig. 4). In addition, the statistical power of this comparison is limited because there were only 19 pest-detection cases in Korea.
| Transport mode | Administrative violation | Pest detection | Total |
|---|---|---|---|
| Sea | 2,603 (82.24) | 562 (17.76) | 3,165 |
| Land | 3,725 (96.83) | 122 ( 3.17) | 3,847 |
| Air | 810 (100.0) | 0 ( 0.00) | 810 |
| Total | 7,138 | 684 | 7,822 |
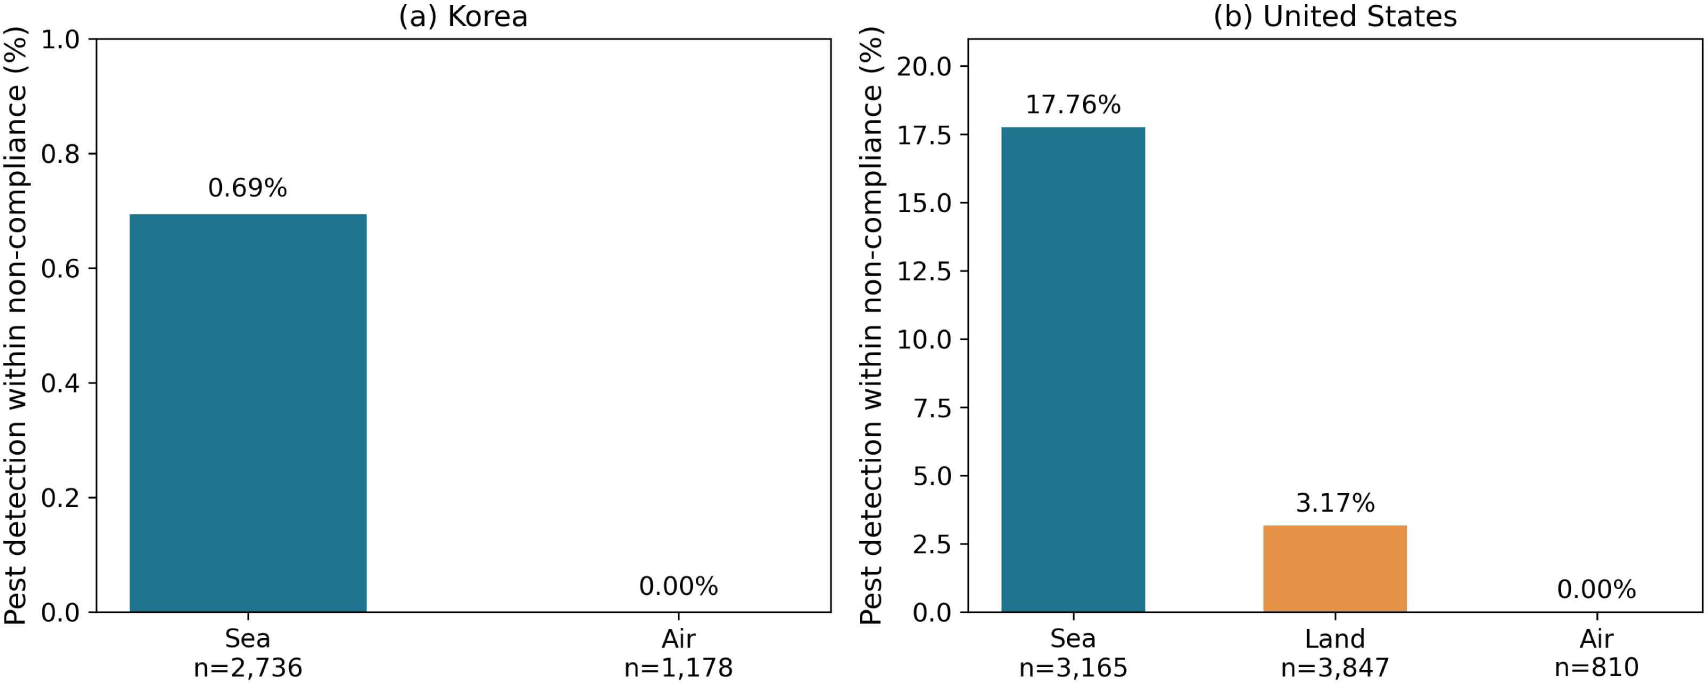
The higher proportion of pest detection in sea transport appears to be associated with the possibility that long-distance, long-duration transit, the use of dunnage for heavy cargo, and temperature and humidity conditions during voyages favor the survival of pests concealed within wood. In contrast, although land transport had many detected cases, most were mark-related administrative violations.
In the United States dataset, the most frequent commodity was WPM itself (1,105 cases), followed by machine parts (648), miscellaneous equipment (438), metals, minerals and metal products (416), tile (275), and construction materials (246). The proportion of pest detection within non-compliant consignments was highest for tile (36.0%), followed by metals, minerals and metal products (15.4%) and miscellaneous equipment (10.3%; Table 5; χ2 = 201.4, df = 6, p < 0.001). As defined in Section 2.3, this value does not mean that pests were found in 36.0% of imported tile consignments; it means that pests were confirmed in 99 of the 275 non-compliance cases detected among tile consignments.
The denominator of the detection proportion is the number of non-compliance cases detected for the relevant commodity, not the total number of imports of that commodity. Thus, this value indicates the proportion of pest detection within non-compliant consignments, rather than the detection rate among imported consignments (see Section 2.3.).
The distribution of non-compliance by commodity in the Korean dataset is shown in Table 6. Wood and articles of wood (HS 44) were overwhelmingly predominant, with 1,645 cases, accounting for 41.92% of the total, followed by machinery (6.42%), articles of stone or cement (4.36%), beverages (4.23%), and furniture and lighting (3.82%). Within wood and articles of wood, there were 553 cases of wood pellets, 535 of dunnage, and 73 of wood pallets; imports of wood fuel and WPM itself therefore comprised most of this category. This suggests that the high share of wood-related non-compliance in Korea may result not from defects in WPM but from the large import volume of the relevant commodities and also explains why risk estimates using the total number of imports by commodity as the denominator are needed.
Proportions are based on the total number of non-compliance cases in Korea (n = 3,924). The Korean dataset is recorded using 2-digit HS codes, whereas the United States dataset uses APHIS commodity categories; therefore, no statistical comparison directly matching the two systems was conducted. Because Korea had only 19 pest-detection cases, it was excluded from the commodity-specific detection-proportion analysis (see Section 3.4.).
No commodity-specific pest -detection proportions were calculated for the Korean dataset. With only 19 pest-detection cases, allocating them across 79 commodity categories would result in expected frequencies below 1 in most cells, failing to meet the approximation conditions for the chi-square test; even applying Fisher’s exact test would make it difficult to obtain interpretable conclusions. The commodity-specific analysis was therefore limited to the United States dataset. As a descriptive observation, however, Korea’s 19 pest-detection cases were distributed most frequently among vehicles (motorcycles; 5 cases), vegetable plaiting materials (e.g., coco peat; 5 cases), articles of stone or cement (2 cases), and tools and cutlery (2 cases), suggesting relative concentration in heavy cargo and plant-derived raw materials. This is directionally consistent with the United States finding of a high pest-detection proportion in heavy cargo such as tile and metals, but it was not confirmed by statistical testing because of the small number of cases.
Because the commodity classification systems differ between the two countries (Korea uses 2-digit HS codes, whereas the United States uses 264 APHIS commodity categories), no statistical comparison directly matching commodity categories was performed; distributions were only presented in parallel within each country’s dataset. Establishing a common classification system is a task for future research.
The fact that WPM itself was recorded as the top commodity in both countries also requires cautious interpretation. In the United States dataset, “wood packaging material” was the most frequent individual commodity, with 1,105 cases (14.1% of the total). In the Korean dataset, cases in which WPM itself, such as dunnage, pallets, and crates, was recorded as the imported-cargo name numbered 705 (18.0% of the total), accounting for 42.2% of the 1,645 cases in wood and articles of wood (HS 44). This may reflect the recording method at the time non-compliance is detected rather than indicating that WPM is in fact the highest-risk cargo group. When it is difficult to identify the commodity of the main cargo in the inspection field or when cargo information is insufficient, inspectors may have entered the WPM that was the actual object of interception directly in the commodity field. The separate existence in the United States data of 698 cases (8.9%) of “miscellaneous non-regulated material” and 68 cases (0.9%) of “no data available” also suggests that commodity records are, to some extent, broad or residual categories.
Accordingly, the high share of the WPM category may reflect both the actual cargo composition and recording practices, and there are limitations to directly converting the commodity-specific results of this study into risk estimates by cargo group. If commodity recording is standardized in the future, specifically, by separately recording in a dedicated field the commodity of the main cargo loaded on WPM, the precision of commodity-based targeted inspection could be improved.
Tile and stone are often transported from countries such as Turkey, Italy, and India on unprocessed dunnage, and may therefore pose a relatively high risk of harboring wood-boring pests. Pallets and dunnage for heavy cargo are often exposed to repeated loading and outdoor storage, so mark wear and biological deterioration may progress simultaneously; these conditions of use may increase quarantine risk (Hermawan et al., 2024a; Liu et al., 2022).
The monthly share of non-compliance increased in spring (March–May) and was lowest in December in both countries (Fig. 5). The peak occurred in March in the United States and in May in Korea; by season, spring was most frequent in both countries (Korea, 28.3%; United States, 27.7%). The difference in seasonal distributions between countries was statistically significant, but the effect size was very small (χ2 = 14.5, df = 3, p = 0.002; Cramér’s V = 0.035). Thus, it is reasonable to regard seasonal patterns as essentially similar in the two countries.
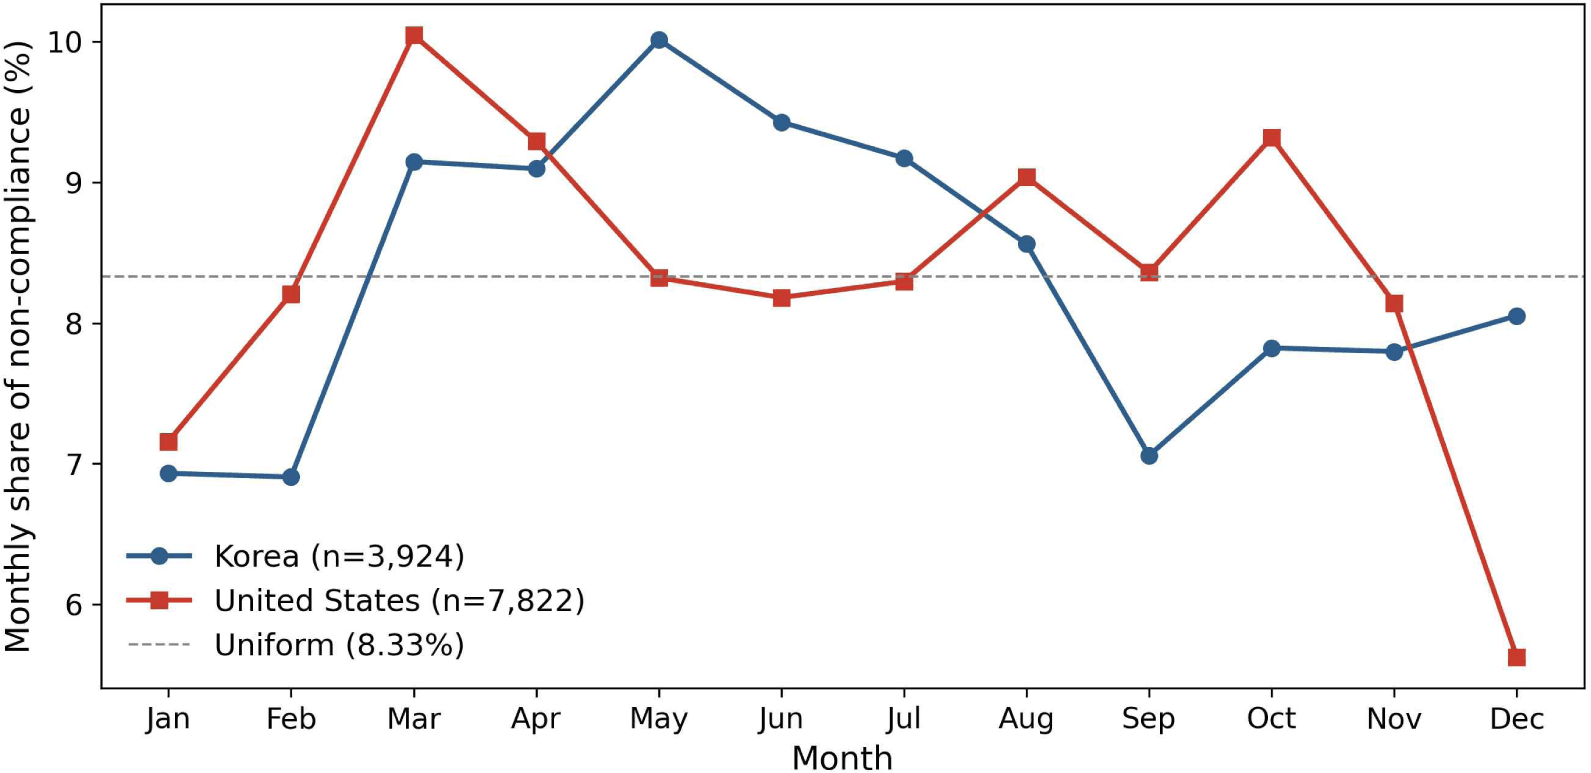
The spring concentration is interpreted as the joint result of logistical factors (inventory replenishment early in the year and increased cargo volume during the spring construction and manufacturing peak season) and biological factors (increased emergence and activity of wood-boring insects). Tree-ring analysis studies have also shown that tree growth and insect activity in wood exhibit distinct seasonal cycles (Ju et al., 2023). However, the contributions of these two factors cannot be separated using the present data alone, and normalized analyses combined with cargo-volume statistics are needed.
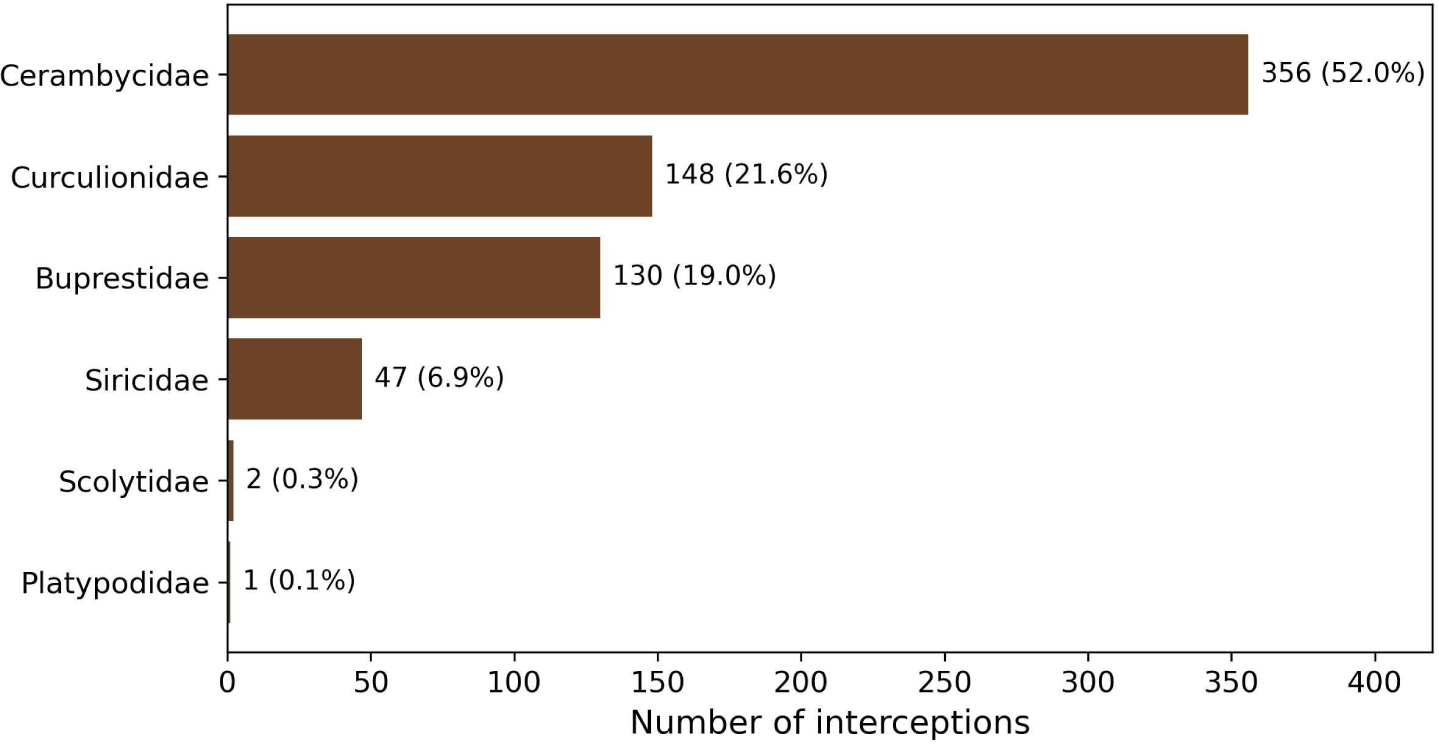
Among the 684 the United States cases in which pests were identified, Cerambycidae dominated with 356 cases (52.0%), followed by Curculionidae (148), Buprestidae (130), and Siricidae (47) (Fig. 6). This is consistent with the report by Haack et al. (2022) that wood-boring insects continue to be detected through the WPM pathway even after implementation of ISPM 15.
In contrast, Korea had only 19 cases in which pests were explicitly recorded, including Sinoxylon anale and S. conigerum (Bostrichidae), termites (Coptotermes spp. and Reticulitermes speratus), and Bursaphelenchus sp. Because one of the 19 Korean cases involved a nematode rather than an insect (Bursaphelenchus sp.), “detected pests” is used in this paper in a broad sense that includes both insects and nematodes.
The detected termites are also major damaging organisms of wooden cultural heritage and wooden buildings in Korea. Im and Han (2024) reported that resistance to Reticulitermes speratus differed markedly among the wood species used in components of Korea’s major wooden architectural heritage, suggesting that the scale of damage if introduced termites become established may vary with host tree species. Studies of attraction and control of Coptotermes termites (Arinana et al., 2024; Subekti et al., 2024) and of the termite resistance of chemically treated wood (Hermawan et al., 2024b) provide information on management measures after introduction. Border exclusion and post-introduction control should be considered in an integrated manner.
Although Cerambycidae and Scolytinae are major regulated pests in Korea, the small number of detection records is interpreted as resulting from a low proportion of cases proceeding to pest identification because processing is completed at the stage of detecting missing marks. This suggests that biological risk may be under-recorded in the Korean data and supports the possibility that a substantial part of the difference between the two countries observed in Section 3.1. is attributable to differences in recording practices.
The statistical significance tests for the main comparisons are summarized in Table 7. Differences in non-compliance types by country, the proportion of pest detection by transport mode, and the proportion of pest detection by commodity were all significant (p < 0.001). However, effect sizes (Cramér’s V) ranged from 0.163 to 0.265, which are no more than moderate, and although the difference in seasonal distribution was significant, its effect size was very small (0.035), indicating that the practical difference was limited. Because even small differences can become statistically significant when sample sizes are large, effect sizes were interpreted together with p-values. In particular, for rare outcomes such as pest detection, Cramér’s V may understate practical differences; therefore, the RR (17.9) was also reported for the country comparison.
4. CONCLUSIONS
This study compared WPM quarantine non-compliance data from Korea and the United States across six dimensions. First, administrative violations related to ISPM 15 marks accounted for most non-compliance in both countries, but the proportion of cases with pest detection was significantly higher in the United States (8.74%) than in Korea (0.48%). However, this gap may substantially reflect differences in quarantine-recording practices. Second, countries of origin were concentrated in China for Korea and in Mexico for the United States, reflecting the supply-chain structure of each country. Third, the proportion of pest detection within non-compliant consignments was highest in sea transport in both countries (Korea, 0.69%; United States, 17.76%), but the large difference in absolute levels means that these should not be regarded as the same phenomenon. Fourth, heavy cargo, including tile, showed a high proportion of pest detection by commodity. Fifth, seasonality was similar in the two countries, with a spring concentration and a December minimum. Sixth, Cerambycidae dominated the pests detected in the United States.
From a policy perspective, we propose (1) strengthening intensive inspection of dunnage and crates for heavy sea cargo (tile, stone, metals, and machinery); (2) establishing a targeted inspection system based on combined profiles of [transport mode × commodity × country of origin]; (3) systematizing pest identification and recording in Korean quarantine inspections even when missing marks are detected, thereby making biological risk visible; and (4) standardizing variables and coding systems for non-compliance data among countries implementing ISPM 15. Ensuring the uniformity of heat-treatment conditions and considering alternative treatment technologies should also proceed in parallel (Hadi et al., 2022; Na and Kim, 2022; Park et al., 2022; Priadi et al., 2023).
This study has several limitations. First, the collection periods and recording structures of the two datasets differ, limiting direct absolute comparisons. Second, the Korean data record exporting country and the United States data record country of origin; these concepts may not coincide when entrepôt trade is involved. Third, data were unavailable to calculate detection rates using total import volume as the denominator. Fourth, the transport-mode and commodity classifications are derived variables based on ports of entry and cargo names and may contain some error. Fifth, Korea had only 19 pest-detection cases, limiting the statistical power of comparisons by transport mode. Normalized analyses combined with cargo-volume statistics are needed in future research.


